
In this article, we will explore some of the most liberal cities in Michigan, where progressive ideas and inclusive attitudes flourish.
If you’re looking to move to Michigan and want to know where the majority of Michiganders lean left, you’ve come to the right place.
Specifically, we wanted to know which cities have the highest number of liberal voters in the Wolverine State.
To do so, we analyzed how the people in each city in Michigan with a population greater than 5,000 voted during the last presidential election. The cities with the highest percentage of voters who voted Democrat were named the most liberal cities in the state.
Table Of Contents: Top Ten | Methodology | Summary | Table
If you’re wondering, Hillsdale is the most conservative city in Michigan of all those we measured.
And to be clear, we didn’t form this list based on our biases — we relied on the cold hard data. For more on how we ran the numbers, keep on reading. Then, we’ll take a closer look at each of our top 10 most liberal cities in Michigan.
And if you already knew these places were liberal, check out some more reading about Michigan and the most liberal places in the country:
The 10 Most Liberal Places In Michigan For 2026

/10

/10

/10

/10
/10

/10

/10

/10

/10

/10
How we determined the most liberal cities in Michigan for 2026
To find the most liberal places in Michigan, we used Saturday Night Science – the argument you’d make at a bar – to find the cities with the most liberals.
Straight forward.
We started by making a list of every city in Michigan over 5,000 people based on the 2020-2024 American Community Survey. That left us with 153 cities and towns.
We then measured the voting record and MIT election data to determine which places lean the most leftward in their allegiances by:
- Percentage Of Votes For Democratic President In 2020
Because no voting data exists at the city level, we used county-level election results from the 2020 election. We assigned every city in a county the percentage of votes that went to the Democrats, effectively extending the county’s results to the city level. In cases where larger cities encompassed an entire county, the election outcomes accurately reflected the city’s political landscape.
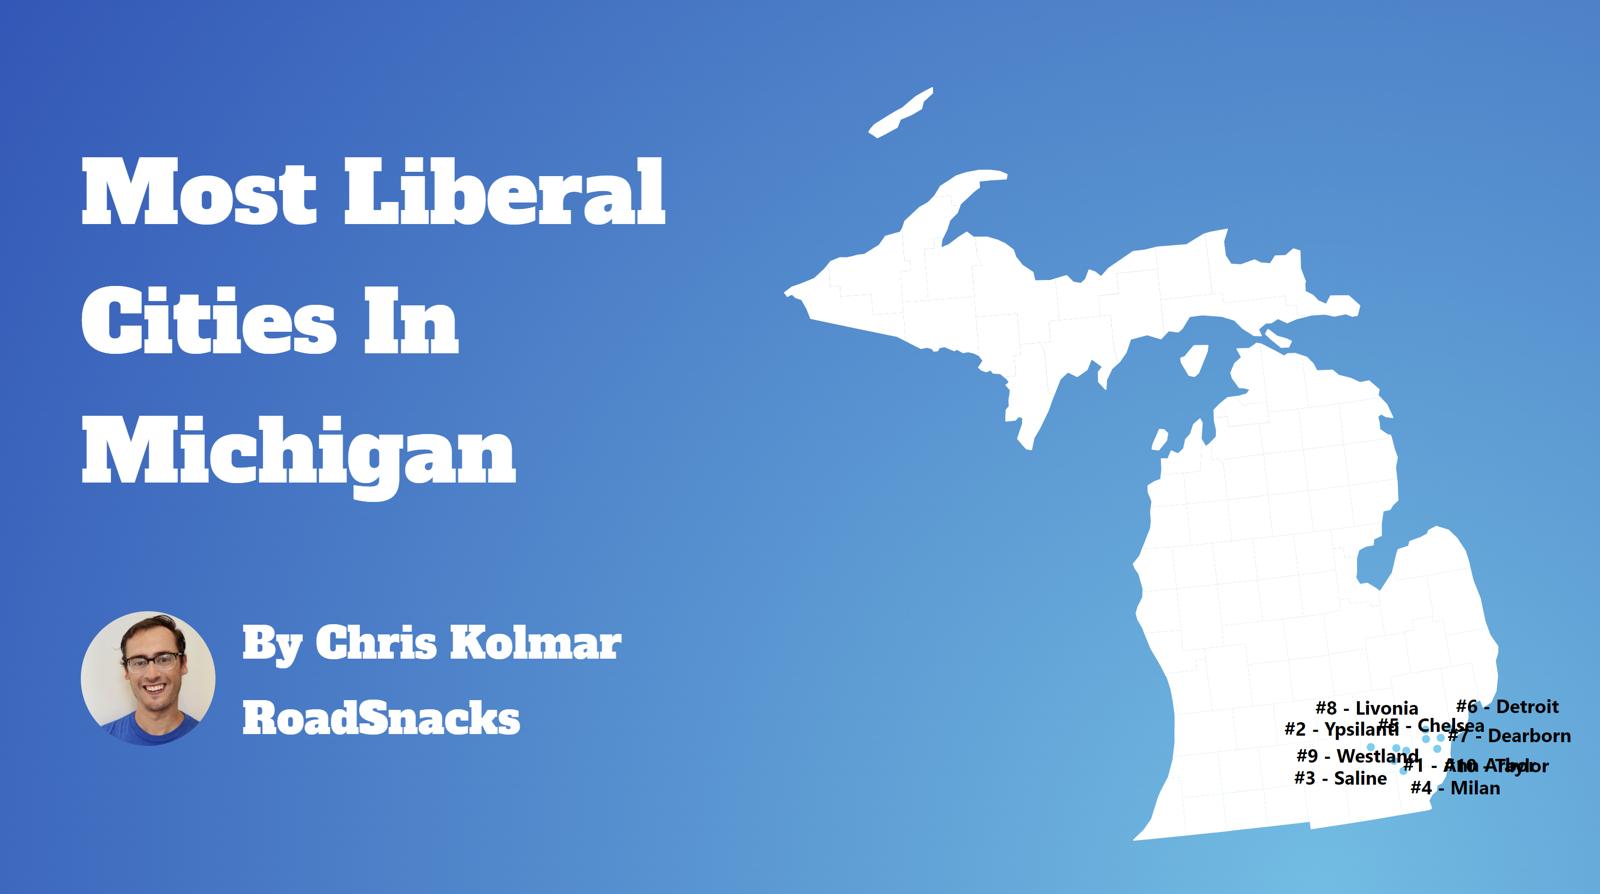
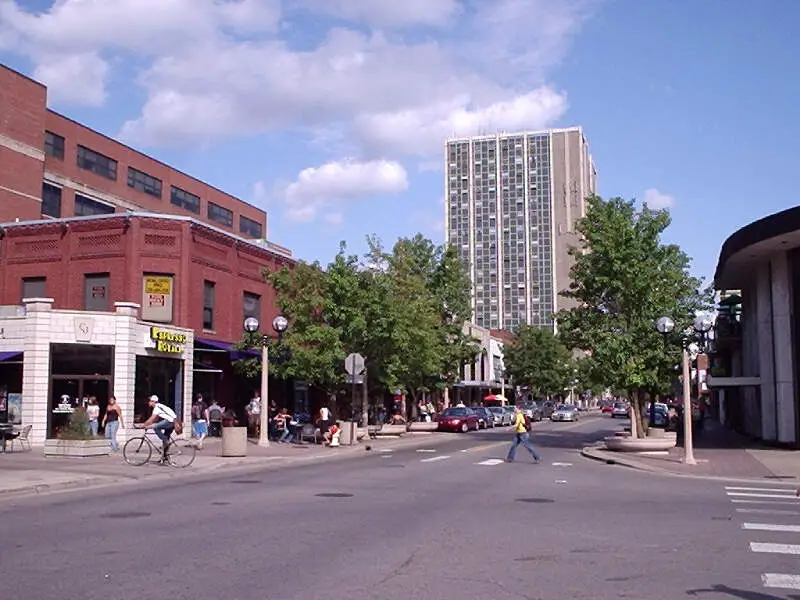
The winner, Ann Arbor, is “The Most liberal City in Michigan For 2026”. The most conservative place in Michigan was Hillsdale.
We updated this article for 2026. This report is our eleventh time ranking the most liberal places to live in Michigan.
Summing Up The Liberal Snowflakes in Michigan
Well, there you have it, the places in Michigan that have the highest number of liberals per capita, with Ann Arbor ranking as the least conservative in the entire state.
The most liberal cities in Michigan are Ann Arbor, Ypsilanti, Saline, Milan, Chelsea, Detroit, Dearborn, Livonia, Westland, and Taylor.
If you’re curious, here are the least liberal cities in Michigan:
- Hillsdale
- Coldwater
- Greenville
For more Michigan reading, check out:
- Best Places To Live In Michigan
- Cheapest Places To Live In Michigan
- Most Dangerous Places in Michigan
- Richest Cities In Michigan
- Safest Places In Michigan
- Worst Places To Live In Michigan
- Most Expensive Places To Live In Michigan
Most Liberal Places In Michigan
| Rank | City | Population | % Liberal |
|---|---|---|---|
| 1 | Ann Arbor, MI | 122,036 | 72.6% |
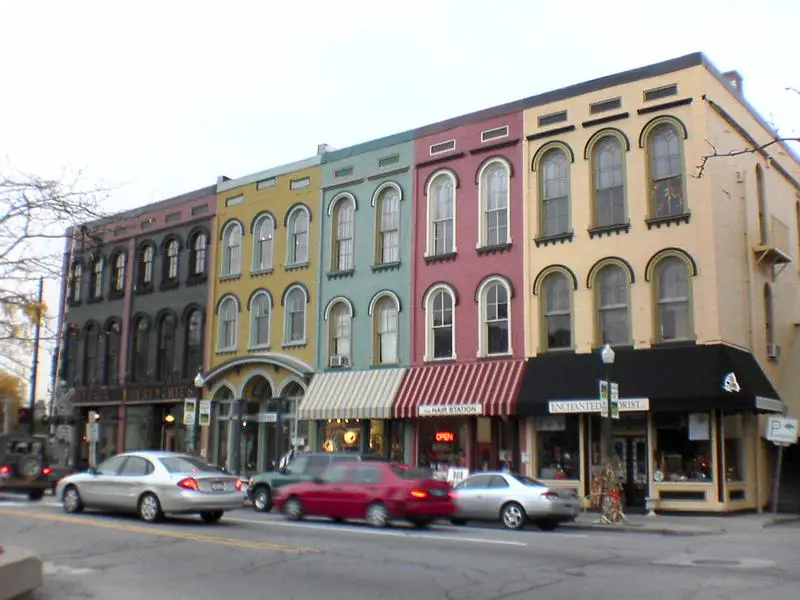
| 2 | Ypsilanti, MI | 19,857 | 72.6% |
| 3 | Saline, MI | 9,006 | 72.6% |
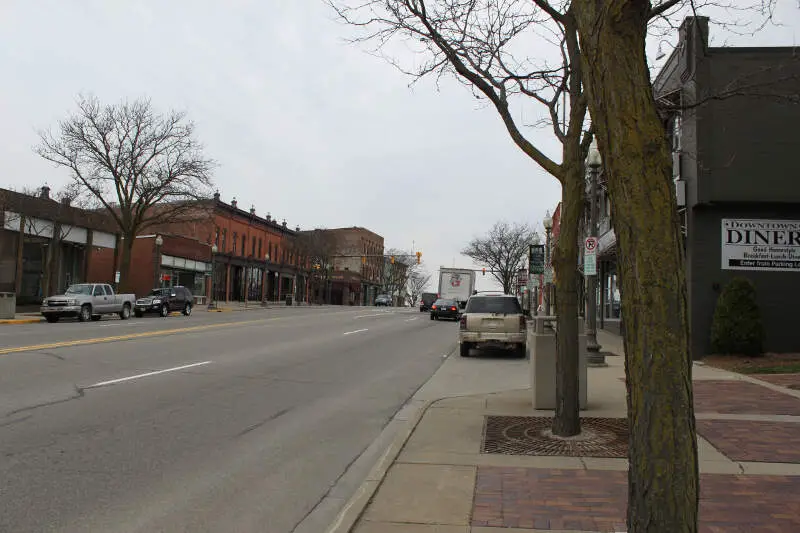
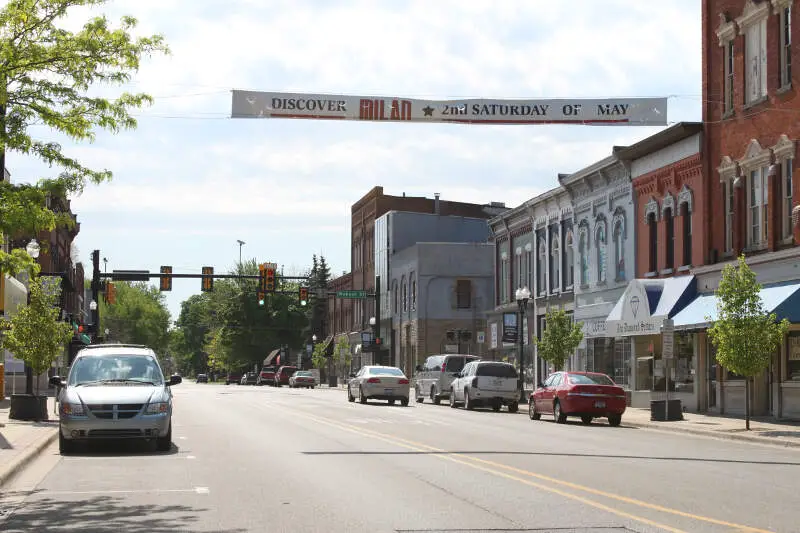
| 4 | Milan, MI | 5,987 | 72.6% |
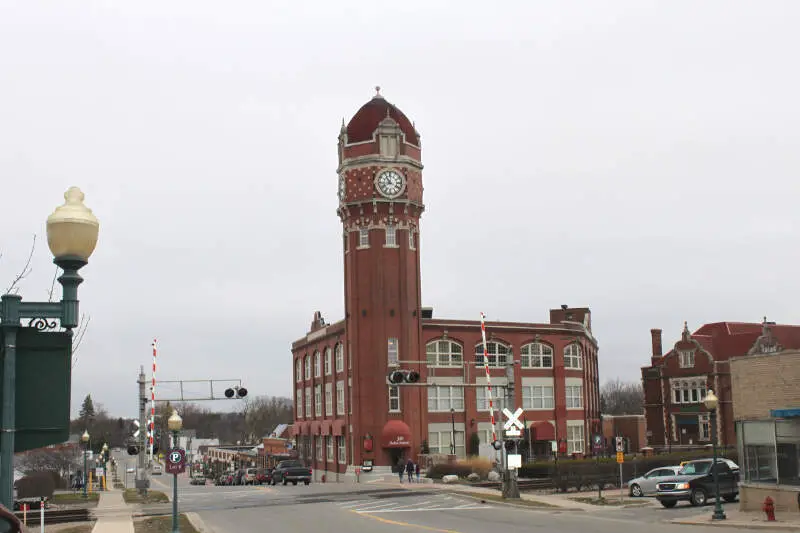
| 5 | Chelsea, MI | 5,426 | 72.6% |
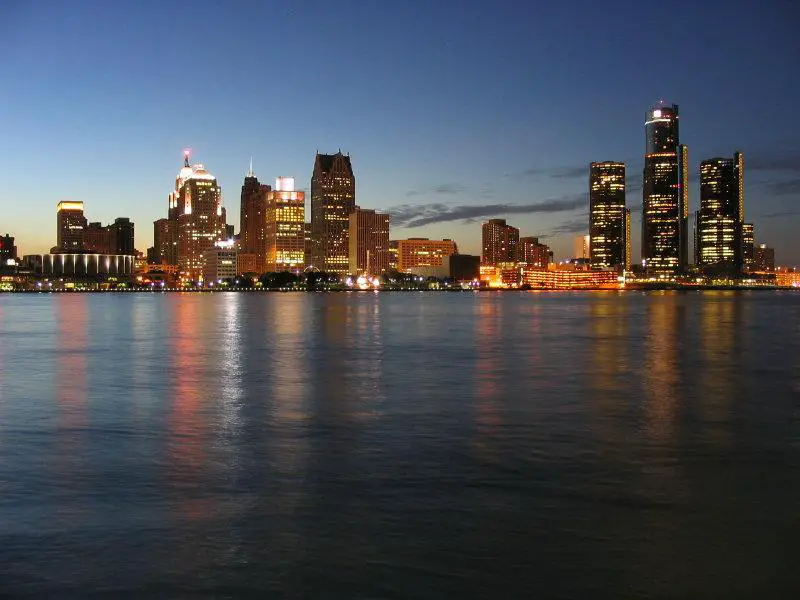
| 6 | Detroit, MI | 638,530 | 68.4% |
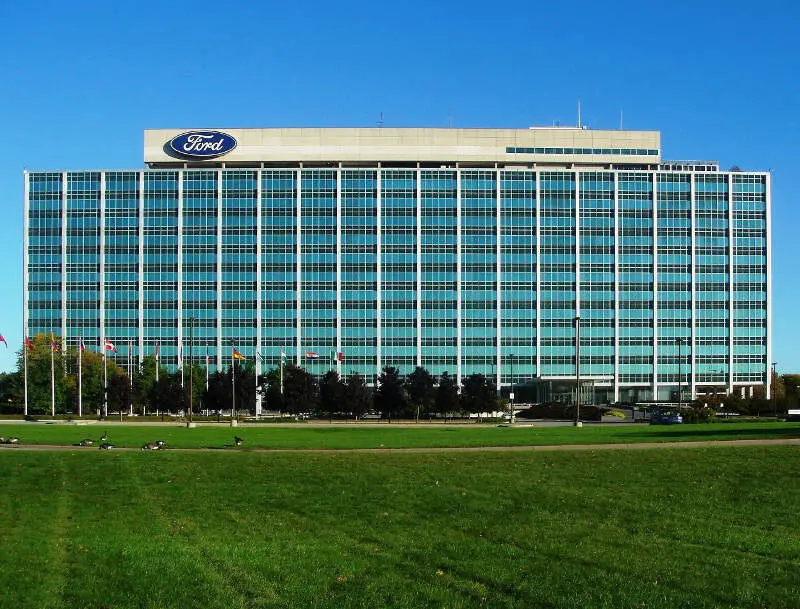
| 7 | Dearborn, MI | 107,423 | 68.4% |
| 8 | Livonia, MI | 93,851 | 68.4% |
| 9 | Westland, MI | 83,633 | 68.4% |
| 10 | Taylor, MI | 62,081 | 68.4% |
| 11 | Dearborn Heights, MI | 61,771 | 68.4% |
| 12 | Lincoln Park, MI | 39,257 | 68.4% |
| 13 | Southgate, MI | 29,366 | 68.4% |
| 14 | Allen Park, MI | 27,925 | 68.4% |
| 15 | Hamtramck, MI | 27,743 | 68.4% |
| 16 | Garden City, MI | 26,739 | 68.4% |
| 17 | Inkster, MI | 25,428 | 68.4% |
| 18 | Romulus, MI | 24,831 | 68.4% |
| 19 | Wyandotte, MI | 24,489 | 68.4% |
| 20 | Trenton, MI | 18,125 | 68.4% |
| 21 | Wayne, MI | 17,310 | 68.4% |
| 22 | Grosse Pointe Woods, MI | 16,094 | 68.4% |
| 23 | Harper Woods, MI | 15,116 | 68.4% |
| 24 | Woodhaven, MI | 12,690 | 68.4% |
| 25 | Melvindale, MI | 12,554 | 68.4% |
| 26 | Riverview, MI | 12,186 | 68.4% |
| 27 | Grosse Pointe Park, MI | 11,319 | 68.4% |
| 28 | Flat Rock, MI | 10,340 | 68.4% |
| 29 | Grosse Pointe Farms, MI | 9,904 | 68.4% |
| 30 | Plymouth, MI | 9,214 | 68.4% |
| 31 | Ecorse, MI | 9,064 | 68.4% |
| 32 | Highland Park, MI | 8,628 | 68.4% |
| 33 | River Rouge, MI | 7,008 | 68.4% |
| 34 | Northville, MI | 6,069 | 68.4% |
| 35 | Grosse Pointe, MI | 5,541 | 68.4% |
| 36 | Lansing, MI | 113,023 | 65.2% |
| 37 | East Lansing, MI | 45,758 | 65.2% |
| 38 | Mason, MI | 8,249 | 65.2% |
| 39 | Kalamazoo, MI | 73,076 | 58.4% |
| 40 | Portage, MI | 49,259 | 58.4% |
| 41 | Troy, MI | 87,898 | 56.4% |
| 42 | Farmington Hills, MI | 83,515 | 56.4% |
| 43 | Rochester Hills, MI | 77,089 | 56.4% |
| 44 | Southfield, MI | 76,236 | 56.4% |
| 45 | Novi, MI | 66,717 | 56.4% |
| 46 | Pontiac, MI | 62,104 | 56.4% |
| 47 | Royal Oak, MI | 57,950 | 56.4% |
| 48 | Oak Park, MI | 29,318 | 56.4% |
| 49 | Madison Heights, MI | 28,419 | 56.4% |
| 50 | Auburn Hills, MI | 25,105 | 56.4% |