
Murder rates by city in the United States research summary. We used Saturday Night Science to research the cities with the highest murder rates in the US for 2026. The data comes from the FBI Crimes trend which breaks down crime rates, including murder, for cities over 100,000 people every quarter. Our analysis reviews the reported murder rates in the 296 cities over 100,000 people.
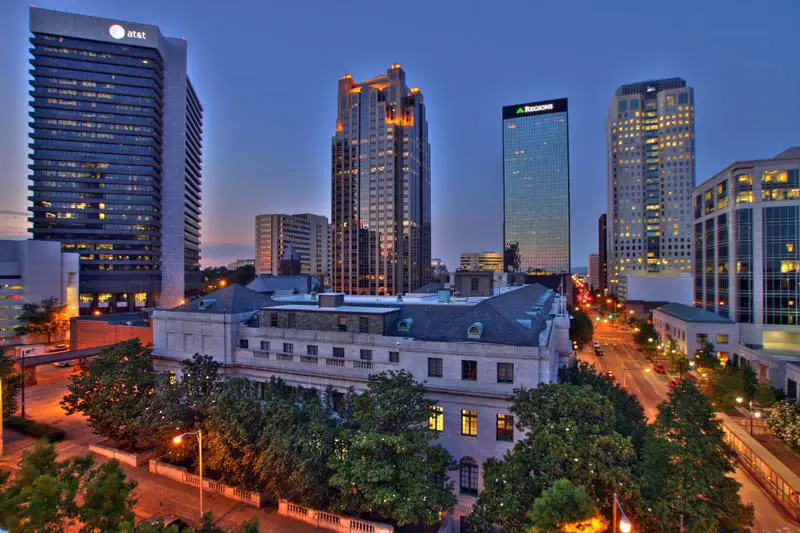
The city with the highest murder rate in the United States is Birmingham, AL. It has 58.8 murders per 100,000 people (Equivalent to per capita, but multiplied by 100,000).
The city in the United States with the most murders is Chicago, IL with 461 murders.
The city with the lowest murder rate in the United States is Torrance, CA. It is 0.0 murders per 100,000 people.
The state with the highest murder rate in the United States is Louisiana with 11 murders per 100,000 people.
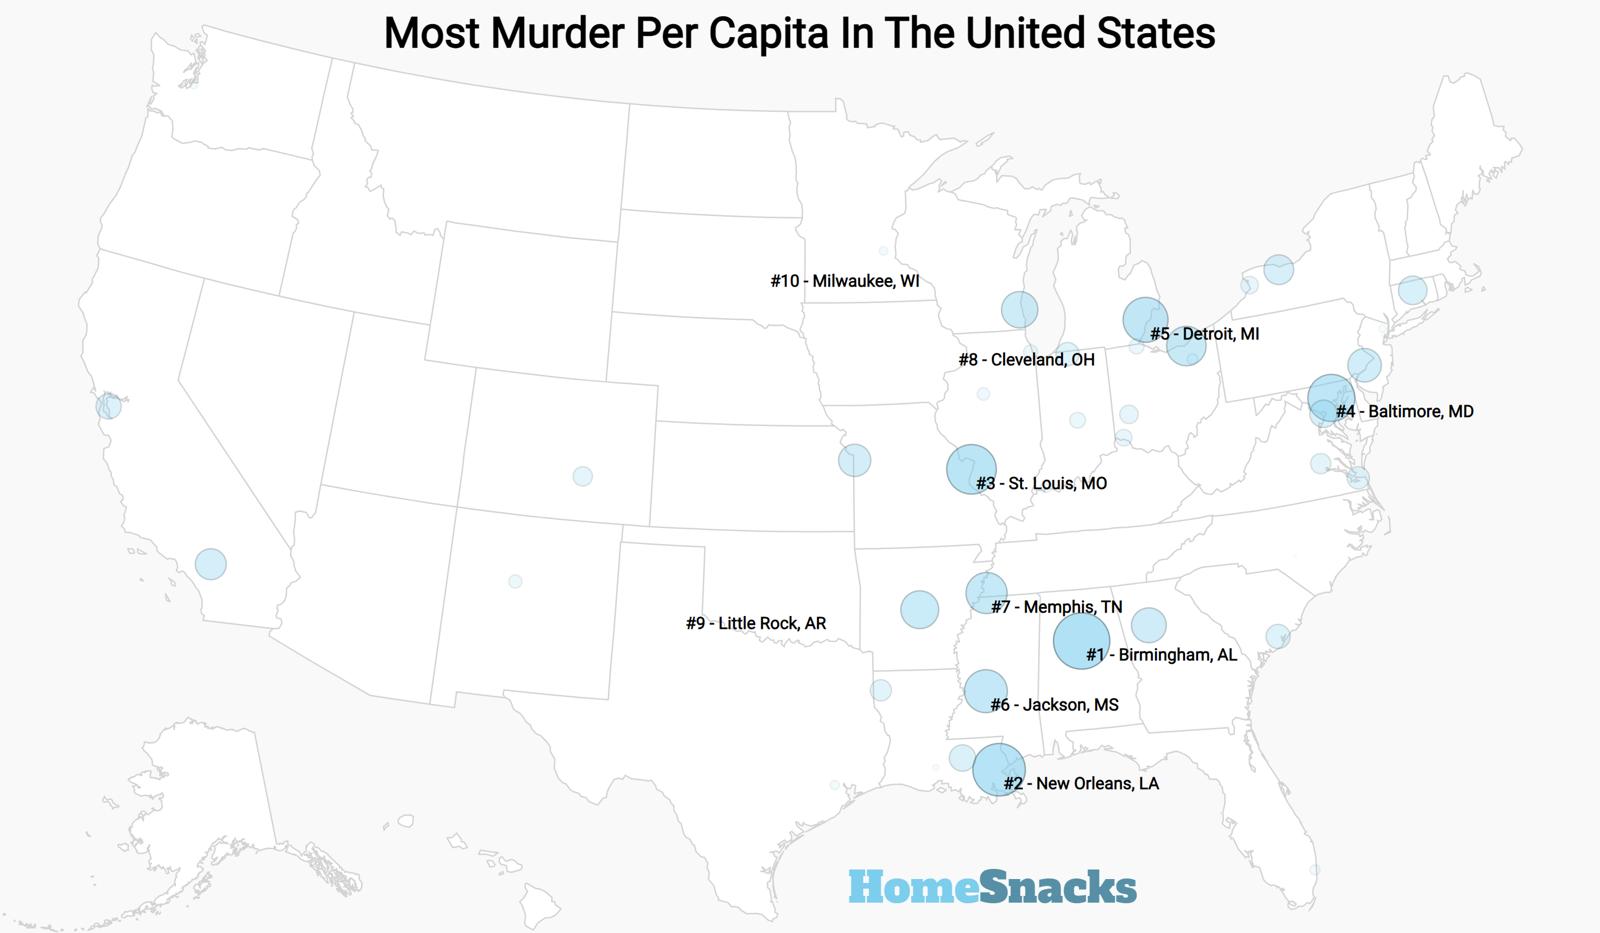
Table Of Contents: Top Ten | Methodology | Summary | Table
Murder has increased since George Floyd’s death in 2020.
While there are many possible reasons for the increase, murder rates are still low by historical standards.
But “the why” is not the subject of our analysis today. Instead, we’re reporting on the facts using Saturday Night Science to show the cities with the highest and lowest murder rates in the United States.
Using the most recent data from the FBI, we’ll analyze the cities with the highest rates of murder on a per capita basis.The ten cities in The United States with the highest murder rates per capita:
The ten cities in The United States with the lowest murder rates per capita:
The city with the highest murder rate according to the most recent FBI Data? That would be Birmingham with 0.0006 murders per capita — or about 1 for every 1,699 people, which is relatively low compared to historical norms and isn’t THAT dangerous.
So, while murder might be a problem in these cities, we have a feeling that the top offenders will get their murder rates under control in the coming years.
Read on for more information on how we calculated these numbers, or feel free to check out something a little less dreary:
- Most Dangerous States In America
- Poorest Cities In America
- Poorest Places By State
- Cheapest Cities By State
- Worst Mid-Sized Cities
The 10 Cities With The Highest Murder Rate In America For 2026

/10
Population: 195,418
Murders: 115
Murders Per Capita: 0.0006
More on Birmingham: Data | Cost Of Living


/10
Population: 277,294
Murders: 150
Murders Per Capita: 0.0005
More on St. Louis: Data | Crime | Cost Of Living


/10
Population: 613,207
Murders: 249
Murders Per Capita: 0.0004
More on Memphis: Data | Crime | Cost Of Living


/10
Population: 566,632
Murders: 197
Murders Per Capita: 0.0003
More on Baltimore: Data | Crime | Cost Of Living


/10
Population: 651,171
Murders: 203
Murders Per Capita: 0.0003
More on Detroit: Data | Crime | Cost Of Living


/10
Population: 362,762
Murders: 109
Murders Per Capita: 0.0003
More on Cleveland: Data | Crime | Cost Of Living


/10
Population: 134,857
Murders: 40
Murders Per Capita: 0.0003
More on Dayton: Data | Crime | Cost Of Living


/10
Population: 511,535
Murders: 141
Murders Per Capita: 0.0003
More on Kansas City: Data | Crime | Cost Of Living


/10
Population: 175,092
Murders: 47
Murders Per Capita: 0.0003
More on Shreveport: Data | Crime | Cost Of Living
10. Washington, DC

/10
Population: 702,250
Murders: 179
Murders Per Capita: 0.0003
More on Washington:
Methodology: How We Determined The Murder Capitals Of America For 2026
While there are surveys and public polls on what cities in a state are the most dangerous, we wanted to rely on something other than speculation and opinion. Instead, we looked to Saturday Night Science and the hard numbers from the FBI’s last year of reporting. Specifically, we analyzed the FBI’s Crime Data Explorer, which summarizes the number of murders that happen in each city per year.
We only looked at cities in America with over 100,000 people — that left us with 296 cities in America to analyze.
We then calculated the number of murders per capita for these cities to make an apples-to-apples comparison. This ranking created a “Murder Index.”
The cities with a higher Murder Index were deemed the “Murder Capitals of America For 2026.”
We must note that this report is not an analysis of the effectiveness of local police departments. It simply states where murders occurred.
We updated this report for 2026. This report is our eleventh time ranking the murder capitals of America.
Summary: Locking Up Murders Row For 2026
There you have it — a look at the cities with the highest murder rates in America for 2026 with Birmingham at the top of the list.
The cities with the highest murder rate in the United States are Birmingham, AL, St. Louis, MO, Memphis, TN, Baltimore, MD, Detroit, MI, Cleveland, OH, Dayton, OH, Kansas City, MO, Shreveport, LA, and Washington, DC.
If you’re looking for the safest cities in America when it comes to murder rates, check out Torrance and Joliet.
For more reading around America:
Murder Rate Per Capita By City In The US For 2026
| Rank | City | Population | Murders | Murder/100k |
|---|---|---|---|---|
| 1 | Birmingham, AL | 195,418 | 115 | 58.8 |
| 2 | St. Louis, MO | 277,294 | 150 | 54.1 |
| 3 | Memphis, TN | 613,207 | 249 | 40.6 |
| 4 | Baltimore, MD | 566,632 | 197 | 34.8 |
| 5 | Detroit, MI | 651,171 | 203 | 31.2 |
| 6 | Cleveland, OH | 362,762 | 109 | 30.0 |
| 7 | Dayton, OH | 134,857 | 40 | 29.7 |
| 8 | Kansas City, MO | 511,535 | 141 | 27.6 |
| 9 | Shreveport, LA | 175,092 | 47 | 26.8 |
| 10 | Washington, DC | 702,250 | 179 | 25.5 |
| 11 | Richmond, VA | 231,805 | 56 | 24.2 |
| 12 | Milwaukee, WI | 560,416 | 134 | 23.9 |
| 13 | Cincinnati, OH | 311,599 | 68 | 21.8 |
| 14 | Indianapolis, IN | 890,685 | 178 | 20.0 |
| 15 | Oakland, CA | 435,042 | 81 | 18.6 |
| 16 | Albuquerque, NM | 558,745 | 103 | 18.4 |
| 17 | Montgomery, AL | 193,728 | 35 | 18.1 |
| 18 | Lancaster, CA | 164,012 | 29 | 17.7 |
| 19 | Little Rock, AR | 204,247 | 36 | 17.6 |
| 20 | Hartford, CT | 119,626 | 21 | 17.6 |
| 21 | Chicago, IL | 2,638,698 | 461 | 17.5 |
| 22 | Pueblo, CO | 110,805 | 19 | 17.1 |
| 23 | North Charleston, SC | 123,511 | 21 | 17.0 |
| 24 | Philadelphia, PA | 1,549,259 | 262 | 16.9 |
| 25 | Mobile, AL | 237,092 | 39 | 16.4 |
| 26 | Vallejo, CA | 121,795 | 20 | 16.4 |
| 27 | Norfolk, VA | 230,460 | 37 | 16.1 |
| 28 | Stockton, CA | 319,069 | 51 | 16.0 |
| 29 | Topeka, KS | 125,156 | 20 | 16.0 |
| 30 | Tuscaloosa, AL | 113,834 | 18 | 15.8 |
| 31 | Syracuse, NY | 145,175 | 22 | 15.2 |
| 32 | Lafayette, LA | 121,471 | 18 | 14.8 |
| 33 | Greensboro, NC | 304,306 | 43 | 14.1 |
| 34 | Houston, TX | 2,319,160 | 320 | 13.8 |
| 35 | Dallas, TX | 1,321,502 | 180 | 13.6 |
| 36 | Antioch, CA | 117,675 | 16 | 13.6 |
| 37 | Rochester, NY | 206,093 | 27 | 13.1 |
| 38 | Rockford, IL | 145,280 | 19 | 13.1 |
| 39 | Columbus, GA | 201,061 | 26 | 12.9 |
| 40 | Peoria, IL | 109,677 | 14 | 12.8 |
| 41 | Akron, OH | 188,223 | 24 | 12.8 |
| 42 | Chattanooga, TN | 188,894 | 24 | 12.7 |
| 43 | Newark, NJ | 309,708 | 39 | 12.6 |
| 44 | Beaumont, TX | 111,320 | 14 | 12.6 |
| 45 | Buffalo, NY | 273,728 | 34 | 12.4 |
| 46 | Kansas City, KS | 153,363 | 19 | 12.4 |
| 47 | Fayetteville, NC | 209,945 | 26 | 12.4 |
| 48 | Killeen, TX | 161,667 | 20 | 12.4 |
| 49 | Durham, NC | 300,208 | 37 | 12.3 |
| 50 | Columbus, OH | 915,447 | 112 | 12.2 |
| 51 | Toledo, OH | 263,668 | 32 | 12.1 |
| 52 | Las Cruces, NM | 115,977 | 14 | 12.1 |
| 53 | Newport News, VA | 183,563 | 22 | 12.0 |
| 54 | North Las Vegas, NV | 293,100 | 35 | 11.9 |
| 55 | Miami Gardens, FL | 110,466 | 13 | 11.8 |
| 56 | Winston-Salem, NC | 254,041 | 29 | 11.4 |
| 57 | Pittsburgh, PA | 317,177 | 36 | 11.4 |
| 58 | San Bernardino, CA | 224,283 | 25 | 11.1 |
| 59 | Fort Wayne, IN | 271,892 | 30 | 11.0 |
| 60 | Knoxville, TN | 200,457 | 22 | 11.0 |
| 61 | Springfield, MA | 155,491 | 17 | 10.9 |
| 62 | New Haven, CT | 137,243 | 15 | 10.9 |
| 63 | Hampton, VA | 138,100 | 15 | 10.9 |
| 64 | Portland, OR | 623,066 | 67 | 10.8 |
| 65 | Suffolk, VA | 103,506 | 11 | 10.6 |
| 66 | Evansville, IN | 114,660 | 12 | 10.5 |
| 67 | Aurora, CO | 397,852 | 41 | 10.3 |
| 68 | Oklahoma City, OK | 709,456 | 73 | 10.3 |
| 69 | Columbia, MO | 130,354 | 13 | 10.0 |
| 70 | Denver, CO | 722,031 | 71 | 9.8 |
| 71 | Lansing, MI | 111,965 | 11 | 9.8 |
| 72 | Tacoma, WA | 223,980 | 22 | 9.8 |
| 73 | Columbia, SC | 144,559 | 14 | 9.7 |
| 74 | Savannah, GA | 241,780 | 23 | 9.5 |
| 75 | Tulsa, OK | 411,310 | 39 | 9.5 |
| 76 | Anchorage, AK | 286,958 | 27 | 9.4 |
| 77 | Independence, MO | 120,271 | 11 | 9.1 |
| 78 | Albany, NY | 102,095 | 9 | 8.8 |
| 79 | Tampa, FL | 408,646 | 36 | 8.8 |
| 80 | Wichita Falls, TX | 102,762 | 9 | 8.8 |
| 81 | Sacramento, CA | 526,670 | 45 | 8.5 |
| 82 | Corpus Christi, TX | 316,108 | 27 | 8.5 |
| 83 | San Antonio, TX | 1,514,458 | 127 | 8.4 |
| 84 | Amarillo, TX | 203,039 | 17 | 8.4 |
| 85 | Phoenix, AZ | 1,662,809 | 139 | 8.4 |
| 86 | Pomona, CA | 143,726 | 12 | 8.3 |
| 87 | Wichita, KS | 395,486 | 33 | 8.3 |
| 88 | Long Beach, CA | 444,232 | 37 | 8.3 |
| 89 | Huntsville, AL | 228,697 | 19 | 8.3 |
| 90 | Reno, NV | 278,313 | 23 | 8.3 |
| 91 | Bridgeport, CT | 148,132 | 12 | 8.1 |
| 92 | Tyler, TX | 111,714 | 9 | 8.1 |
| 93 | Springfield, IL | 111,965 | 9 | 8.0 |
| 94 | Richmond, CA | 113,418 | 9 | 7.9 |
| 95 | Hesperia, CA | 100,850 | 8 | 7.9 |
| 96 | West Palm Beach, FL | 126,427 | 10 | 7.9 |
| 97 | Victorville, CA | 140,309 | 11 | 7.8 |
| 98 | Glendale, AZ | 255,512 | 20 | 7.8 |
| 99 | Hayward, CA | 153,419 | 12 | 7.8 |
| 100 | Palm Bay, FL | 141,137 | 11 | 7.8 |
Your racist comment about black people in Baltimore sickens me. You clearly do not live in this city, because you would be aware of its many positive aspects.