
There’s a common denominator that all bad mid-sized cities have.
They are the places that have bad economies. They are the places where the school systems are in bad shape. They’re the places where people are out of work. They are the places where residents earn low salaries.
And certainly, no one wants to be there if crime is really high.
We defined mid-sized cities using we used Saturday Night Science as having populations between 76,000 and 118,000. The 251st through the 500th biggest cities in the United States to be exact. Many are suburbs of major cities where things aren’t going very well right now, at least according to data.
Table Of Contents: Top Ten | Methodology | Summary | Table
The 10 Worst Places To Live In The United States For 2025
We understand there’s a lot of good in every place. However, according to data (which doesn’t measure things like beauty, ‘friendly people,’ and community involvement), America has far better options for making a place home.
What is the best mid-sized city to live in in the United States? Newton, MA.
For more reading about America, check out:
- Most Dangerous Cities
- Best Places By State
- Cheapest Cities By State
- Most Dangerous States In America
- Safest Cities By State
- Safest Cities In America
- Worst States In America
- Worst Places To Live In America
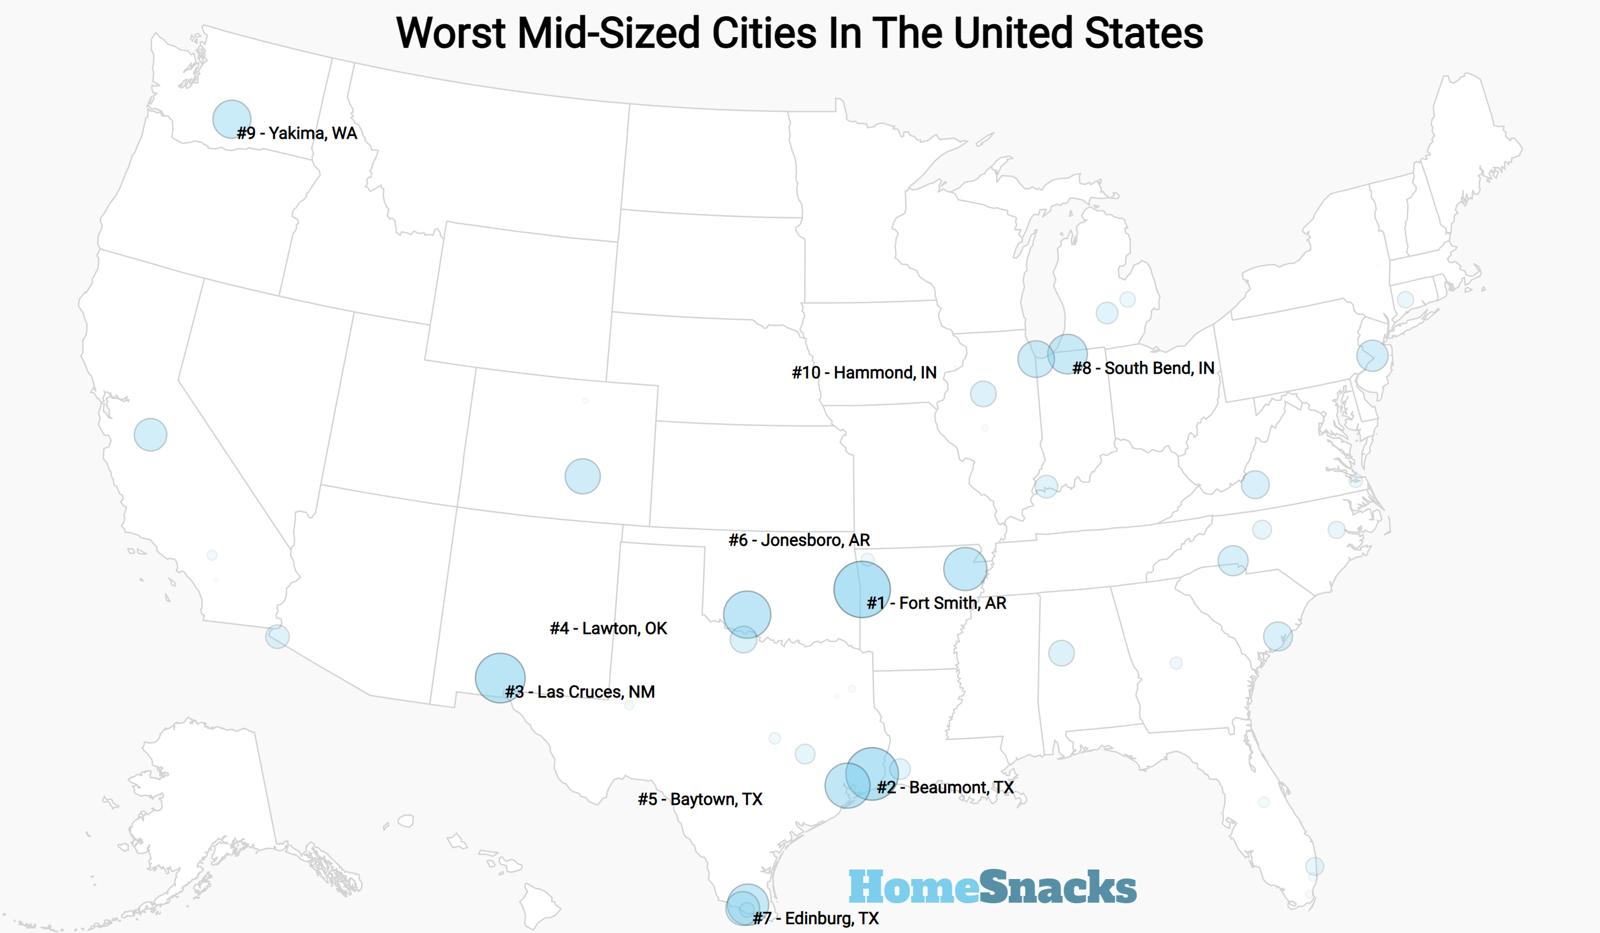
The 10 Worst Mid Sizes Cities In America For 2025

/10
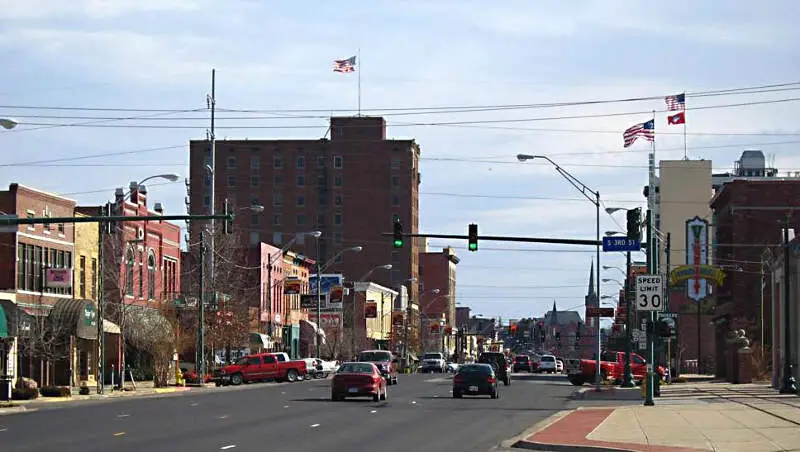
Population: 89,496
Median Home Value: $168,100 (20th worst)
Unemployment Rate: 6.7% (47th worst)
Median Income: $52,692
More on Fort Smith: Data | Real Estate

/10
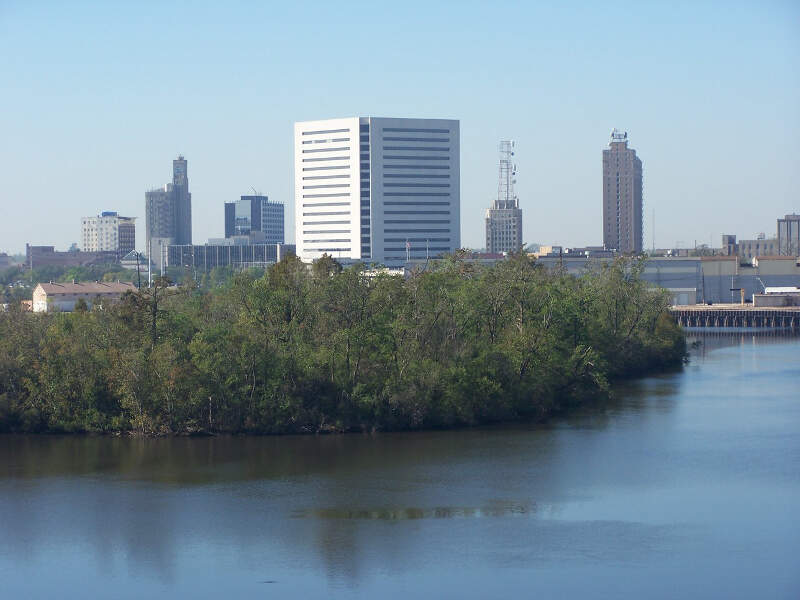
Population: 113,710
Median Home Value: $158,800 (16th worst)
Unemployment Rate: 5.3% (92nd worst)
Median Income: $57,530
More on Beaumont: Data | Real Estate

/10
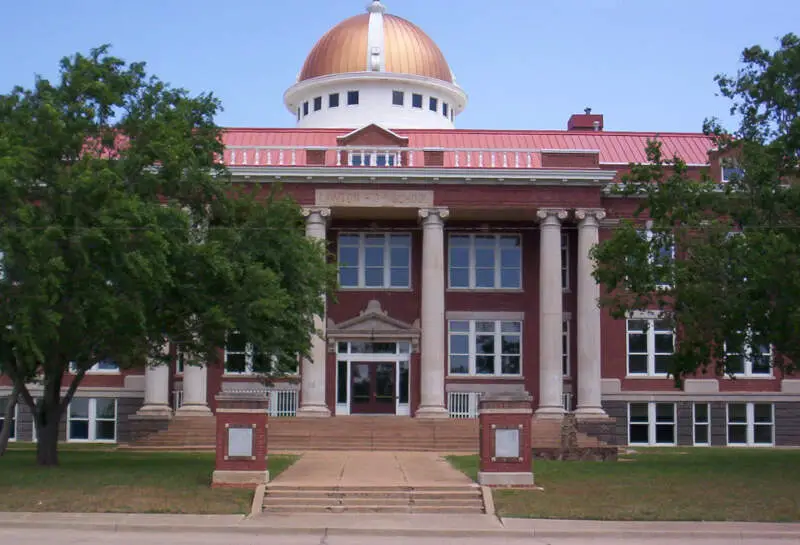
Population: 90,662
Median Home Value: $134,200 (9th worst)
Unemployment Rate: 8.1% (14th worst)
Median Income: $53,588
More on Lawton: Data | Real Estate

/10
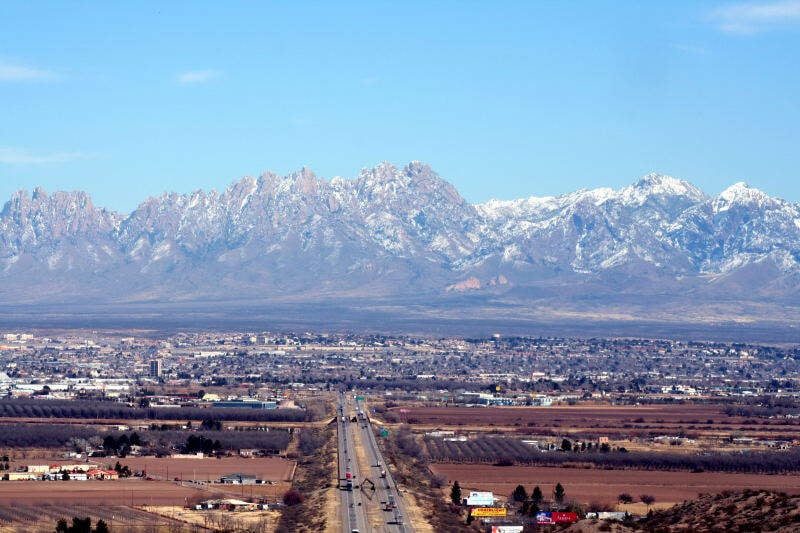
Population: 112,612
Median Home Value: $217,400 (44th worst)
Unemployment Rate: 7.4% (24th worst)
Median Income: $55,176
More on Las Cruces: Data | Real Estate

I have lived in NM for many years, and I find NM very beautiful and the people are very pleasant and helpful. I have traveled extensively through NM from Las Cruces to Pie Town to Socorro to Roswell, to Hobbs to Taos, to Albuquerque to Pinehill, to Ramah to Tucumcari to Raton to Gallup to Zuni. People have always been nice and helpful. I realize that there are issues in NM as there are everywhere, in every state.

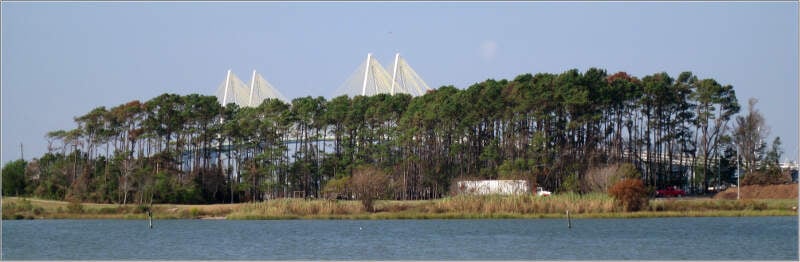
/10
Population: 84,538
Median Home Value: $187,900 (29th worst)
Unemployment Rate: 9.0% (8th worst)
Median Income: $61,699
More on Baytown: Data | Real Estate

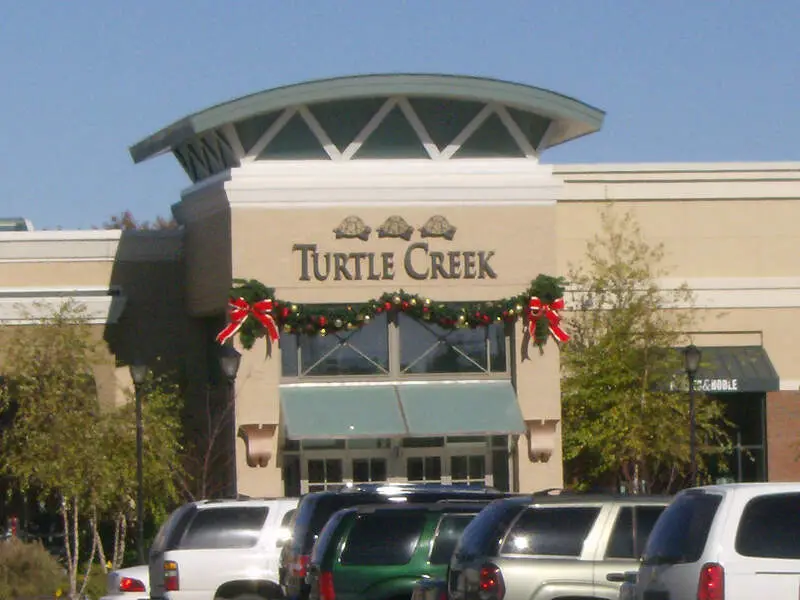
/10
Population: 79,187
Median Home Value: $213,400 (42nd worst)
Unemployment Rate: 6.8% (44th worst)
Median Income: $52,559
More on Jonesboro: Data | Real Estate

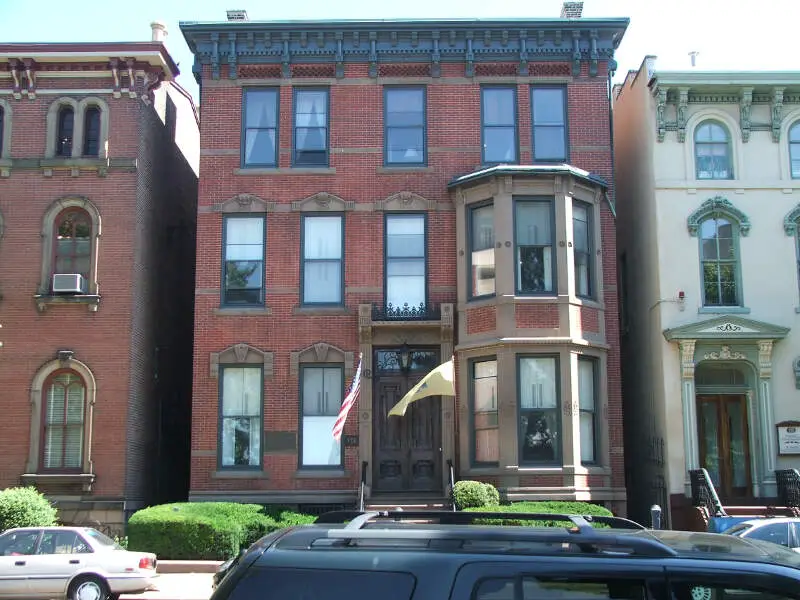
/10
Population: 89,966
Median Home Value: $122,500 (6th worst)
Unemployment Rate: 10.5% (4th worst)
Median Income: $47,102
More on Trenton: Data | Real Estate
I grew up in Trenton. It was close to everything, malls, food, and shops. You name it! We kept our doors unlocked and everyone knew their neighbor. It wasn’t a very rich city but people were friendly and there was low crime. Fast forward to today, 39 years later, things are a lot different. Shops are closed, crime is high, streets a loaded with trash and everyone is fighting each other. No one goes to Trenton anymore.
I wouldn’t recommend a trip to Trenton unless you are visiting relatives or have an appointment during the day with a business. Bullets are always crossing the streets from gang fights. I’d recommend going else where.

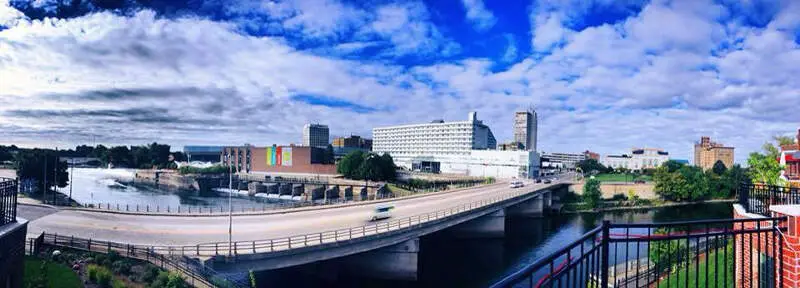
/10
Population: 102,866
Median Home Value: $124,500 (7th worst)
Unemployment Rate: 6.0% (64th worst)
Median Income: $52,512
More on South Bend: Data | Real Estate
For me, the lack of sunshine really hits hard. 73 full sunny days. Their idea of party cloudy seems pretty cloudy to me. I have lived in 7 states now and South Bend, area is the most unfriendly I have ever lived. The economy is not good, It looses population every year 3 %. Terrible crime. They did fix up the down town are but once your outside of that it is a lot of blight in the area, dilapidated homes, boarded up. Not a pretty city by any means. It was very hard to find work, mostly a union town, homeless on many streets that hang out by the stoplights and intersections asking for money. I have never seen anything like that in my life.
Notre is cool and some historical housing. Not a good economy is the trouble, and the lack of sun is pretty bad.

/10
Population: 77,098
Median Home Value: $141,700 (10th worst)
Unemployment Rate: 6.8% (41st worst)
Median Income: $53,950
More on Hammond: Data | Real Estate
I have lived here for over 15 years and have seen significant improvements in school and crime the past 4 years. The police now have a Blue net that helps them deal with a lot of the criminals coming from the 2 worst cities to share a border with E.C. and Gary. This city has a extremely great support for the elderly and they have a great college bound program for students of property owners.
Favorite thing about Hammond is the great variety of things to eat and vast community events that include the whole family along with some great bike trails.

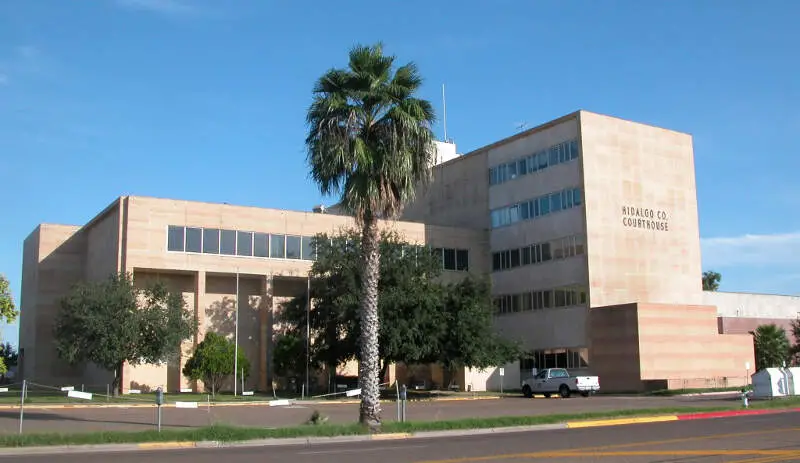
/10
Population: 102,561
Median Home Value: $174,800 (22nd worst)
Unemployment Rate: 6.6% (49th worst)
Median Income: $57,789
More on Edinburg: Data | Real Estate
Methodology: How We Determined The Worst Mid-Sized Cities In The US
In order to rank the worst mid-sized cities to live in America, we had to determine what criteria people like or dislike about a place. It isn’t a stretch to assume that people like low crime, solid education, things to do, and a stable economy.
Using FBI crime data and the most recent 2019-2023 American Community Survey data, this is the criteria we plugged into Saturday Night Science:
- Low Population Density
- Highest Unemployment Rates
- Adjusted Median Income (Median income adjusted for the cost of living)
- Low home prices
- A lot of uninsured individuals
- A high portion of uneducated adults
- High Crime
- High Poverty
We defined “mid-sized” to be the 251st through the 500th biggest cities in the United States.
If you’d like to see the complete list of cities, scroll to the bottom of this post to see a link to the entire data set.
We updated this report for 2025. This report is our tenth time ranking the worst mid-sized cities to live in America. This report is an opinion based on facts and is meant as infotainment — don’t freak out.
Summary: The Worst Mid-Sized Cities in America
These are the mid-sized cities in the U.S. where crime is high, people are broke, and the public schools are lousy.
The worst mid-sized cities in the United States are Fort Smith, AR, Beaumont, TX, Lawton, OK, Las Cruces, NM, Baytown, TX, Jonesboro, AR, Trenton, NJ, South Bend, IN, Hammond, IN, and Edinburg, TX.
If you’re also curious enough, here are the best cities in America, according to Saturday Night Science:
- Newton
- San Ramon
- Mission Viejo
For more reading, check out:
Detailed List Of The Worst Mid-Sized Cities To Live In America
| Rank | City | Population | Unemployment Rate | Home Value | Median Income |
|---|---|---|---|---|---|
| 1 | Fort Smith, AR | 89,496 | 6.7% | $168,100 | $52,692 |
| 2 | Beaumont, TX | 113,710 | 5.3% | $158,800 | $57,530 |
| 3 | Lawton, OK | 90,662 | 8.1% | $134,200 | $53,588 |
| 4 | Las Cruces, NM | 112,612 | 7.4% | $217,400 | $55,176 |
| 5 | Baytown, TX | 84,538 | 9.0% | $187,900 | $61,699 |
| 6 | Jonesboro, AR | 79,187 | 6.8% | $213,400 | $52,559 |
| 7 | Trenton, NJ | 89,966 | 10.5% | $122,500 | $47,102 |
| 8 | South Bend, IN | 102,866 | 6.0% | $124,500 | $52,512 |
| 9 | Hammond, IN | 77,098 | 6.8% | $141,700 | $53,950 |
| 10 | Edinburg, TX | 102,561 | 6.6% | $174,800 | $57,789 |
| 11 | Peoria, IL | 112,126 | 7.8% | $149,500 | $58,716 |
| 12 | North Charleston, SC | 117,460 | 4.3% | $267,700 | $62,789 |
| 13 | Evansville, IN | 116,441 | 5.3% | $129,100 | $52,251 |
| 14 | Temple, TX | 86,358 | 7.2% | $220,300 | $64,945 |
| 15 | Gastonia, NC | 81,632 | 5.2% | $250,000 | $60,554 |
| 16 | Greenville, NC | 88,540 | 9.0% | $213,100 | $50,564 |
| 17 | Roanoke, VA | 98,677 | 5.5% | $180,500 | $52,671 |
| 18 | Tuscaloosa, AL | 107,699 | 7.0% | $236,600 | $48,536 |
| 19 | Reading, PA | 94,836 | 12.1% | $109,800 | $45,599 |
| 20 | Merced, CA | 89,766 | 12.3% | $347,700 | $59,938 |
| 21 | Lansing, MI | 112,546 | 8.1% | $119,400 | $52,170 |
| 22 | Springdale, AR | 87,388 | 5.1% | $237,200 | $66,044 |
| 23 | Flint, MI | 80,835 | 17.4% | $47,600 | $36,194 |
| 24 | Pueblo, CO | 111,514 | 5.9% | $230,900 | $55,305 |
| 25 | Waterbury, CT | 114,356 | 9.3% | $185,400 | $51,642 |
| 26 | Yuma, AZ | 98,461 | 7.5% | $209,100 | $62,546 |
| 27 | Pharr, TX | 79,809 | 6.8% | $111,500 | $49,884 |
| 28 | Lake Charles, LA | 81,679 | 5.5% | $204,000 | $56,864 |
| 29 | Warner Robins, GA | 81,438 | 6.5% | $171,600 | $65,715 |
| 30 | Yakima, WA | 96,810 | 8.0% | $273,400 | $59,228 |
| 31 | Wichita Falls, TX | 102,558 | 3.5% | $142,600 | $58,568 |
| 32 | Mission, TX | 86,234 | 8.6% | $160,800 | $60,813 |
| 33 | High Point, NC | 115,263 | 5.6% | $212,400 | $61,228 |
| 34 | Greeley, CO | 109,421 | 5.8% | $369,600 | $68,650 |
| 35 | Portsmouth, VA | 97,299 | 6.6% | $229,400 | $58,972 |
| 36 | Springfield, IL | 113,714 | 6.7% | $155,200 | $65,537 |
| 37 | Sioux City, IA | 85,651 | 4.5% | $162,600 | $65,473 |
| 38 | Longview, TX | 82,765 | 3.3% | $182,700 | $62,488 |
| 39 | Santa Fe, NM | 88,224 | 5.1% | $411,500 | $70,110 |
| 40 | Hemet, CA | 90,646 | 8.3% | $314,200 | $53,623 |
| 41 | Albany, NY | 100,081 | 8.3% | $223,000 | $59,485 |
| 42 | Fall River, MA | 93,764 | 8.1% | $357,800 | $53,933 |
| 43 | Compton, CA | 93,525 | 7.1% | $546,700 | $74,270 |
| 44 | Davenport, IA | 101,083 | 4.8% | $162,900 | $64,497 |
| 45 | Tyler, TX | 107,718 | 4.7% | $216,400 | $65,527 |
| 46 | Perris, CA | 79,349 | 7.1% | $431,900 | $82,523 |
| 47 | Santa Maria, CA | 109,880 | 7.1% | $478,200 | $84,617 |
| 48 | Erie, PA | 94,156 | 7.0% | $108,200 | $43,397 |
| 49 | Odessa, TX | 114,080 | 5.5% | $208,000 | $73,030 |
| 50 | Rapid City, SD | 76,836 | 3.2% | $270,000 | $65,712 |
| 51 | Fayetteville, AR | 97,227 | 4.9% | $322,500 | $59,074 |
| 52 | Inglewood, CA | 105,575 | 7.9% | $744,300 | $71,029 |
| 53 | South Gate, CA | 91,836 | 6.9% | $608,500 | $71,315 |
| 54 | Rialto, CA | 103,866 | 8.4% | $454,400 | $85,521 |
| 55 | Kennewick, WA | 84,389 | 4.9% | $343,600 | $72,867 |
| 56 | Asheville, NC | 94,369 | 4.0% | $411,000 | $67,221 |
| 57 | Avondale, AZ | 90,644 | 4.6% | $348,700 | $81,260 |
| 58 | New Bedford, MA | 100,731 | 7.6% | $324,400 | $56,025 |
| 59 | Richmond, CA | 115,396 | 7.0% | $650,100 | $90,038 |
| 60 | Pasco, WA | 78,446 | 5.2% | $344,700 | $81,130 |
| 61 | San Angelo, TX | 99,507 | 3.2% | $179,300 | $64,146 |
| 62 | Lynchburg, VA | 79,255 | 5.0% | $211,800 | $59,808 |
| 63 | Waukegan, IL | 88,919 | 5.3% | $177,600 | $70,578 |
| 64 | Hawthorne, CA | 85,933 | 7.8% | $813,700 | $72,719 |
| 65 | Ogden, UT | 86,973 | 4.0% | $311,300 | $70,053 |
| 66 | Dearborn, MI | 107,846 | 6.8% | $205,900 | $65,192 |
| 67 | El Monte, CA | 107,066 | 6.4% | $626,000 | $64,484 |
| 68 | Jurupa Valley, CA | 106,244 | 6.4% | $538,700 | $96,190 |
| 69 | Green Bay, WI | 106,585 | 4.3% | $191,500 | $62,546 |
| 70 | Federal Way, WA | 99,232 | 5.9% | $499,600 | $82,144 |
| 71 | Brockton, MA | 105,080 | 8.3% | $405,500 | $77,089 |
| 72 | Boynton Beach, FL | 80,601 | 5.0% | $312,700 | $71,378 |
| 73 | Chico, CA | 102,032 | 6.6% | $455,300 | $67,929 |
| 74 | Everett, WA | 111,083 | 5.4% | $532,300 | $81,502 |
| 75 | Conroe, TX | 96,976 | 3.3% | $283,100 | $75,245 |
| 76 | Auburn, WA | 85,455 | 5.3% | $510,400 | $95,367 |
| 77 | Indio, CA | 90,669 | 4.6% | $424,700 | $78,709 |
| 78 | Bellflower, CA | 77,396 | 7.8% | $661,100 | $77,602 |
| 79 | Danbury, CT | 86,086 | 6.3% | $381,600 | $83,422 |
| 80 | Antioch, CA | 115,759 | 7.1% | $607,400 | $94,256 |
| 81 | Medford, OR | 85,794 | 5.4% | $387,000 | $70,497 |
| 82 | Spokane Valley, WA | 105,460 | 5.9% | $344,300 | $70,722 |
| 83 | El Cajon, CA | 104,909 | 9.2% | $632,800 | $66,478 |
| 84 | Wyoming, MI | 76,865 | 4.1% | $203,900 | $72,163 |
| 85 | Racine, WI | 77,155 | 5.8% | $158,100 | $55,705 |
| 86 | Westland, MI | 84,155 | 5.3% | $176,500 | $62,216 |
| 87 | Gresham, OR | 112,818 | 5.3% | $440,000 | $73,608 |
| 88 | Sparks, NV | 109,106 | 5.7% | $455,900 | $86,979 |
| 89 | Rancho Cordova, CA | 80,656 | 7.0% | $451,400 | $89,120 |
| 90 | Largo, FL | 82,506 | 4.3% | $208,500 | $60,465 |
| 91 | Duluth, MN | 86,863 | 4.8% | $225,700 | $66,263 |
| 92 | Clearwater, FL | 117,075 | 4.7% | $326,100 | $64,440 |
| 93 | Suffolk, VA | 96,638 | 5.3% | $329,600 | $90,089 |
| 94 | Champaign, IL | 88,822 | 4.3% | $199,700 | $57,544 |
| 95 | Elgin, IL | 114,106 | 6.3% | $252,400 | $88,316 |
| 96 | Cicero, IL | 83,223 | 4.3% | $236,000 | $68,548 |
| 97 | Bethlehem, PA | 77,069 | 7.2% | $236,500 | $66,443 |
| 98 | Bellingham, WA | 92,367 | 5.6% | $577,400 | $65,821 |
| 99 | Provo, UT | 114,303 | 4.7% | $437,100 | $62,800 |
| 100 | Brooklyn Park, MN | 84,349 | 3.7% | $313,500 | $85,964 |
Worst_mid_sized Places By State
Worst Places To Live In Alaska
Worst Places To Live In Alabama
Worst Places To Live In Arkansas
Worst Places To Live In Arizona
Worst Places To Live In California
Worst Places To Live In Colorado
Worst Places To Live In Connecticut
Worst Places To Live In Delaware
Worst Places To Live In Florida
Worst Places To Live In Georgia
Worst Places To Live In Hawaii
Worst Places To Live In Illinois
Worst Places To Live In Kentucky
Worst Places To Live In Louisiana
Worst Places To Live In Massachusetts
Worst Places To Live In Maryland
Worst Places To Live In Michigan
Worst Places To Live In Minnesota
Worst Places To Live In Missouri
Worst Places To Live In Mississippi
Worst Places To Live In Montana
Worst Places To Live In North Carolina
Worst Places To Live In North Dakota
Worst Places To Live In Nebraska
Worst Places To Live In New Hampshire
Worst Places To Live In New Jersey
Worst Places To Live In New York State
Worst Places To Live In Oklahoma
Worst Places To Live In Oregon
Worst Places To Live In Pennsylvania
Worst Places To Live In Rhode Island
Worst Places To Live In South Carolina
Worst Places To Live In South Dakota
Worst Places To Live In Tennessee
Worst Cities In Virginia For 2017
Worst Places To Live In Vermont
Worst Places To Live In Washington
Worst Places To Live In Wisconsin
I like Spring Hill. When I first came here, I asked folks where do the professionals and creative folks get together to meet one another. Was told there are no places to meet people.
Let me tell you, the houses are cheap. I would like to add, this place is called Sink Hill after all the sink holes. It is also called Sh*t Hill because the people are so unfriendly, narrow minded, suspicious, and stupid.
We can’t include every armpit town in the U.S. My nominee for one of the worst medium sized cities is Springdale, Arkansas. This town of about 74000 in Northwest Arkansas, otherwise not a bad place at all is pure hardcore right wing redneck on one side of town, the west, and is a slum full of very very bad people on the east.
Property values here have plummeted 60% in the last 10 to15 years, gang crime is rampant, there is no sense of community, only hate back and forth and against the other cities that are much much better, including Fayetteville, one of the highest ranking good cities in the country.
The downtown is deserted, there is no interest in historical buildings, reviving downtown, or anything to make Springdale anything more than a flat, ugly city with strip malls and fast food joints.
Plus, Tyson, Cargill and George’s poultry operations are the prominent employers, and the town smells absolutely terrible.
But it’s the people I had to work with and be around for over thirty two years that make this dump hideous. I do not live there, and wouldn’t for any amount of money because too many of its residents are just plain mean and poorly educated.
One of the most unfriendly cities you’ll ever encounter.
Fort Pierce, FL is on here for one of the top ten worst cities to live because there is nothing in Fort Pierce besides the hospital and the jail. The healthcare is horrible, but no need to worry they do have two cemeteries most likely where you end up after a hospital stay at there county hospital. The police were caught robbing people that they pulled over.
The only thing it has going for it is the water which is the Indian River, that is, of course, if they fixed its pollution problem.
They use to grow citrus until some citrus canker closed that industry down and good luck finding work here. If you buy in this city its most likely going to be yours forever unless you want to give it away. I can see why it made the worst place to live.
The bright side is that you can find some affordable rent in Fort Pierce.