
Missouri might be one of the most unique states in the country. Are you in the midwest or are you in the south? While much of the state is farmland, there are some southern features like the Ozarks that dominate the landscape. You’re friendly like the south, and you love frog giggin, but you love baseball and winter snow, too.
Plus, you’re in the SEC. Go figure.
Is it all rosy in the Show Me State? Of course not. Just like every other state, Missouri has its least desirable spots. The purpose of this post is to use science and data to determine which places are the worst you could possibly live in if you make Missouri your home.
After analyzing 124 of the state’s most populous cities (over 5,100 people), we came up with this list as the 10 worst places to live in the state of Missouri:
Table Of Contents: Top Ten | Methodology | Summary | Table
The 10 Worst Places To Live In Missouri For 2024
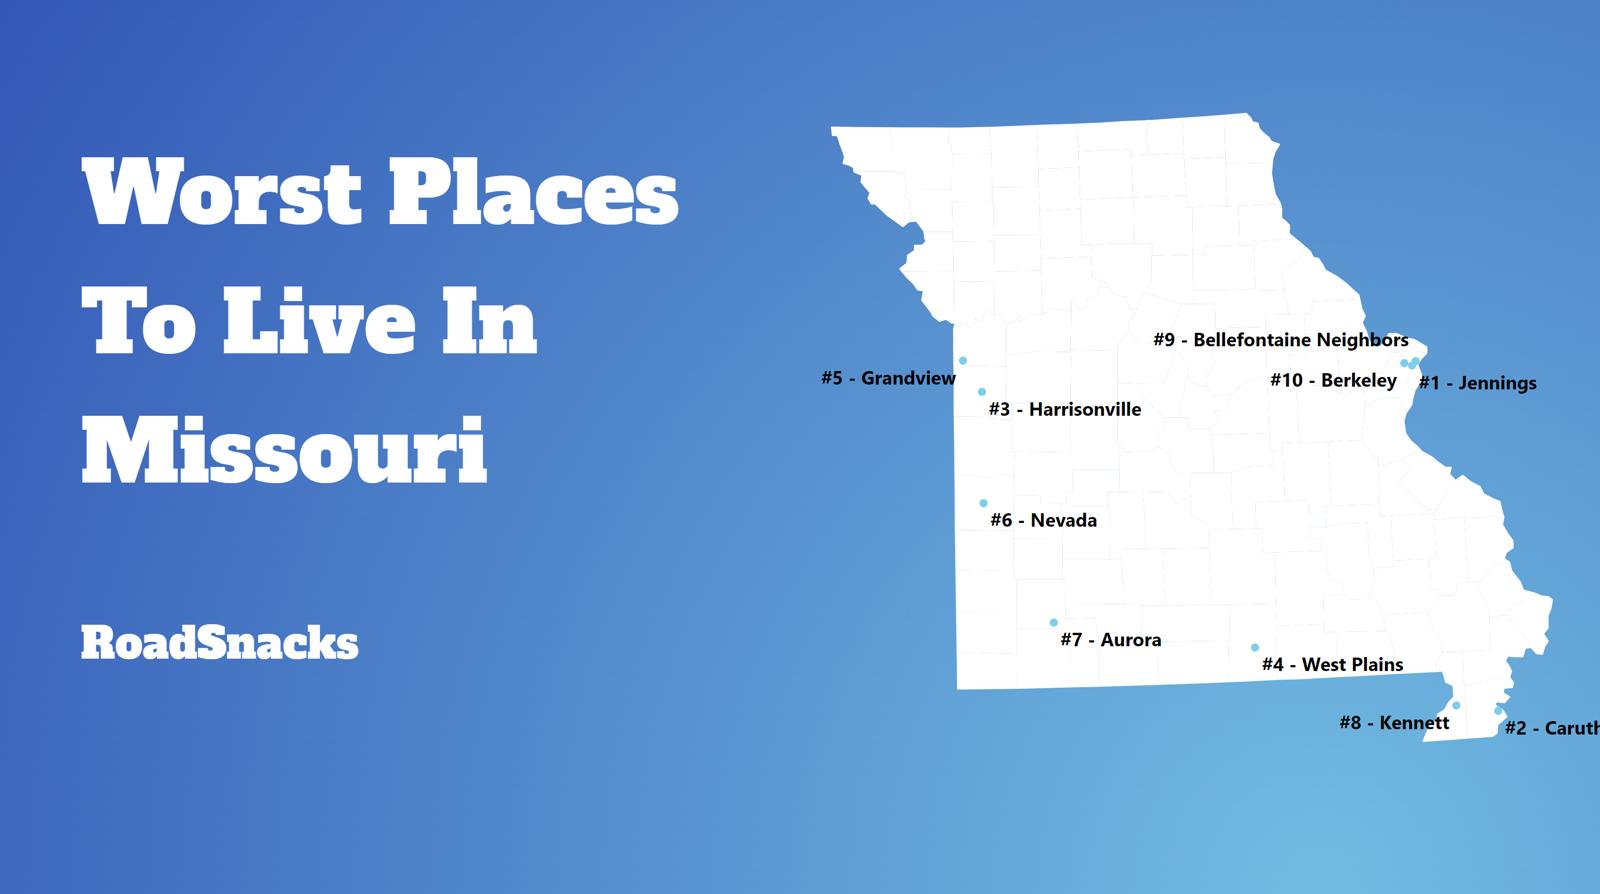
Where are these places, you wonder? And before you get all riled up and say we’re picking on small towns in Missouri, that’s not the case.
We understand there’s a lot of good in every place. For example, the best place to live in Missouri is Glendale.
However, according to data (which doesn’t measure things like beauty and ‘friendly people’), the state has far better options for making a place home. And the worst place to live in Missouri? The worst place to live in Missouri is Jennings.
Read below to see how we crunched the numbers and how your city fared in 2024.
If you’re looking for something more national, check out the worst cities in America or the worst states in America.
For more Missouri reading, check out:
- Best Places To Live In Missouri
- Cheapest Places To Live In Missouri
- Most Dangerous Cities in Missouri
The 10 Worst Places To Live In Missouri For 2024

/10
Population: 12,996
Average Home Price: $58,011
Median Income: $32,462
Unemployment Rate: 10.1%
Crime Per Capita: 0.3215
More on Jennings: Data | Cost Of Living | Real Estate
Welcome to Jennings, where criminals go to make a living. Jennings has the 2nd highest crime rate in the state. When you’re within Jennings city limits, you have a 1 in 3.8 chance of being the victim of a property crime such as a car break in or home invasion robbery every year.
Plus, there were 80 violent crimes here in 2024. For a city of 12,996 people, that’s absolutely off the charts high. You have a 1 in 17 chance of being raped, attacked or killed when you’re in Jennings every year as well.
Jennings is a northern suburb of St. Louis.

/10
Population: 5,504
Average Home Price: $95,548
Median Income: $35,585
Unemployment Rate: 5.3%
Crime Per Capita: 0.0563
More on Caruthersville: Data | Crime | Cost Of Living | Real Estate
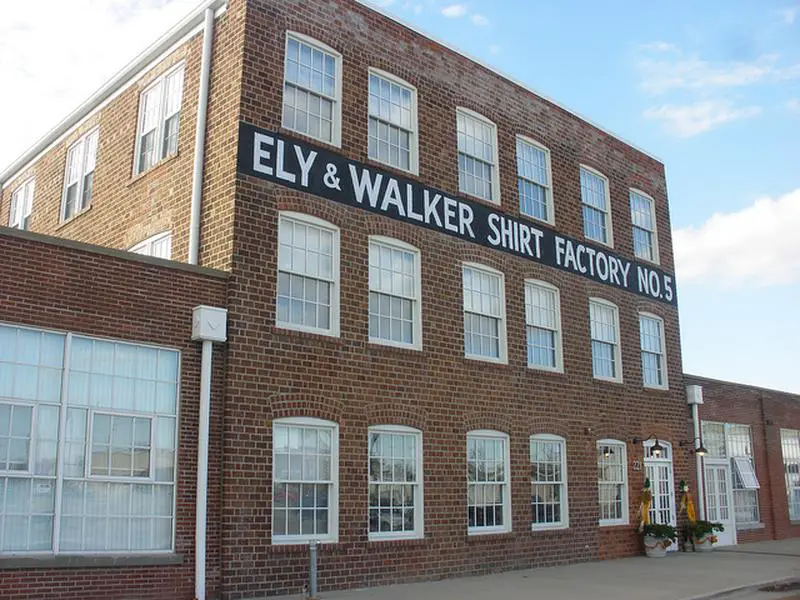
Built along the Mississippi River, across the water from Tennessee, Caruthersville is famous for two main reasons. First, the town hosted an early iteration of the “steel cage” professional wrestling match in 1936. Second, the community provides a crucial transportation spot: I-155 runs through town, toward the only bridge across the Mississippi for the more than 150 miles between Cairo, Illinois, and Memphis, Tennessee.
Unfortunately, neither of these distinctions provides a significant boost to the town’s economy. The median income sits at $35,585 and the unemployment rate stands at 5.3%.
Caruthersville also suffers a major safety problem, with a crime rate more than 110% above the national standard. In addition, the 5,504 residents struggle with housing issues and weak schools.

/10
Population: 10,024
Average Home Price: $253,584
Median Income: $57,607
Unemployment Rate: 7.9%
Crime Per Capita: 0.0247
More on Harrisonville: Data | Crime | Cost Of Living | Real Estate

/10
Population: 12,250
Average Home Price: $200,891
Median Income: $38,676
Unemployment Rate: 4.7%
Crime Per Capita: 0.0367
More on West Plains: Data | Crime | Cost Of Living | Real Estate
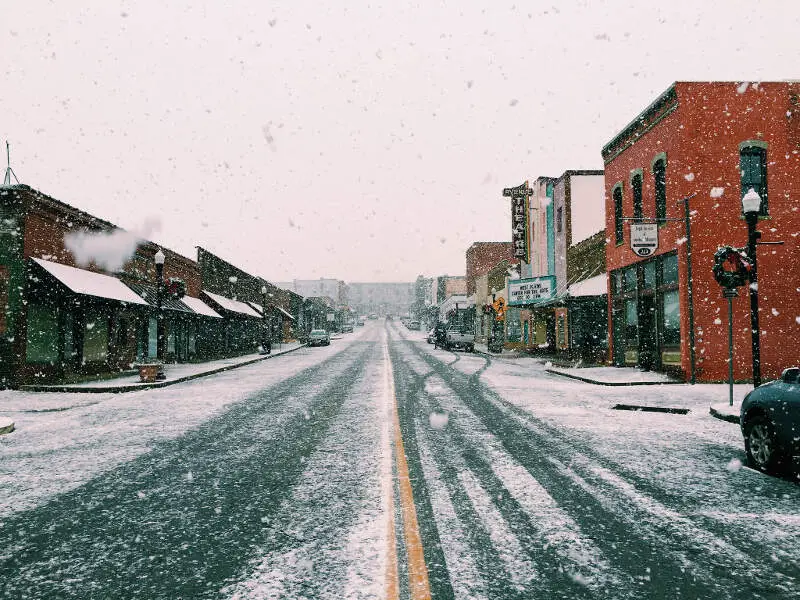
Nestled in Howell County, Missouri, West Plains has unfortunately earned a reputation as one of the worst places to live in the state. With a population of 12,250 and a median income of just $38,676, this city faces numerous challenges. One of the main concerns is its high crime rate, with an alarming 51 violent crimes reported in 2021 alone. This includes 1 murders, 9.0 rapes, and 40.0 aggravated assaults, making it a dangerous place to call home.
In addition to safety concerns, West Plains struggles with economic hardships. The poverty level ranks at a disheartening 83.0, highlighting the financial difficulties that many residents face. The median home value stands at $200,891, reflecting the limited real estate opportunities available in the area. However, despite these challenges, there is hope for improvement through community efforts. By addressing crime prevention and investing in economic development initiatives, West Plains can work towards becoming a safer and more prosperous city for its residents to thrive in.

/10
Population: 25,921
Average Home Price: $203,316
Median Income: $51,048
Unemployment Rate: 6.4%
Crime Per Capita: 0.0421
More on Grandview: Data | Crime | Cost Of Living | Real Estate

/10
Population: 8,128
Average Home Price: $137,667
Median Income: $44,318
Unemployment Rate: 4.7%
Crime Per Capita: 0.0636
More on Nevada: Data | Crime | Cost Of Living | Real Estate

/10
Population: 7,290
Average Home Price: $150,015
Median Income: $44,728
Unemployment Rate: 8.6%
Crime Per Capita: 0.0309
More on Aurora: Data | Crime | Cost Of Living | Real Estate
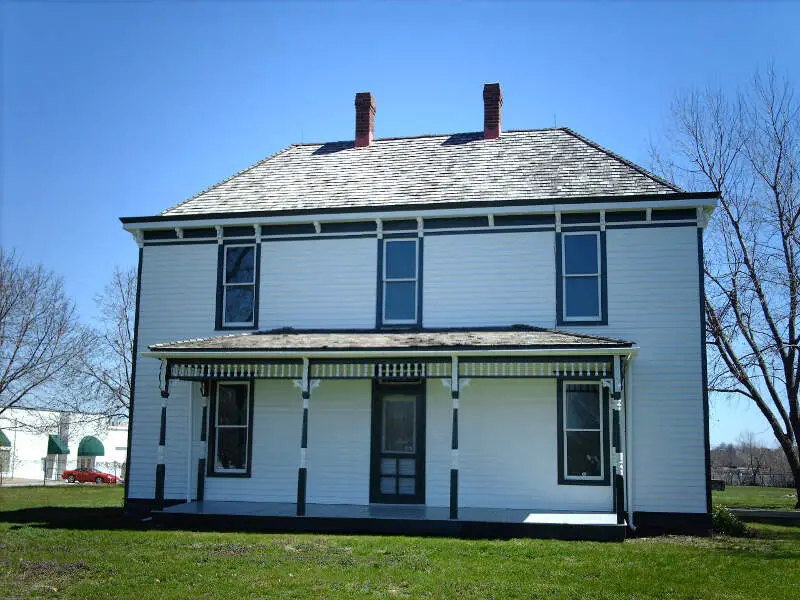
Fun fact: the area around Aurora was founded by an ancestor of Brad Pitt. In the 19th century, the area became prominent thanks to a booming mining industry. Unfortunately, the economy has turned sour in the 21st century. High unemployment and low wages earn the town the title of number 7 worst location in Missouri.
You’ll have trouble finding a good-paying job in Aurora. The unemployment rate sits at 8.6% and the median income tracks at $44,728. Aurora has other issues as well. The crime rate runs 120% above the U.S. norm. In addition, the area struggles with housing, diversity, and education.
This town in the southwestern part of Missouri has its charms. For instance, locals can check out Baldwin Park.

/10
Population: 10,383
Average Home Price: $100,009
Median Income: $52,907
Unemployment Rate: 7.3%
Crime Per Capita: 0.0419
More on Kennett: Data | Crime | Cost Of Living | Real Estate
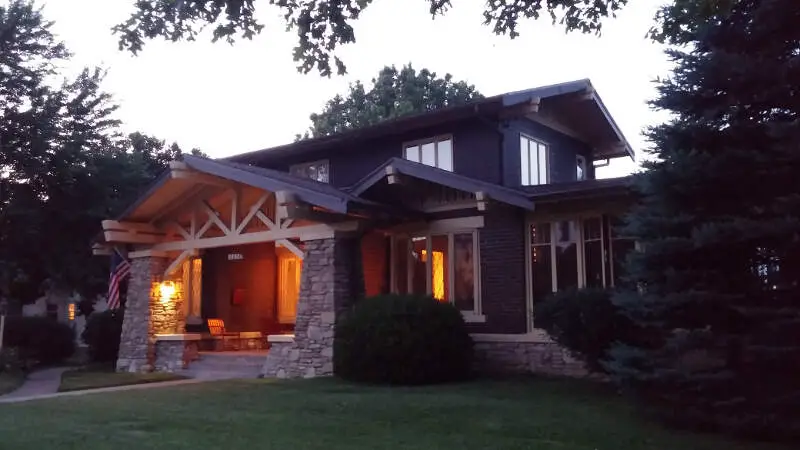
Kennett is located in the Missouri boot heel down near the Arkansas/Tennessee state line. Not only are there few pure entertainment options here, the economy here is lacking. More than 7.3% of Kennett residents are out of work, and households bring in less than $52,907 a year. Schools are also way underfunded.
Crime is way higher than the state average in Kennett. Residents have a 1 in 26.6 chance of being the victim of a property crime when within Kennett city limits every year.

/10
Population: 10,637
Average Home Price: $92,443
Median Income: $46,115
Unemployment Rate: 6.2%
Crime Per Capita: 0.0463
More on Bellefontaine Neighbors: Data | Crime | Cost Of Living | Real Estate

/10
Population: 8,232
Average Home Price: $76,521
Median Income: $37,757
Unemployment Rate: 4.1%
Crime Per Capita: 0.1036
More on Berkeley: Data | Crime | Cost Of Living | Real Estate
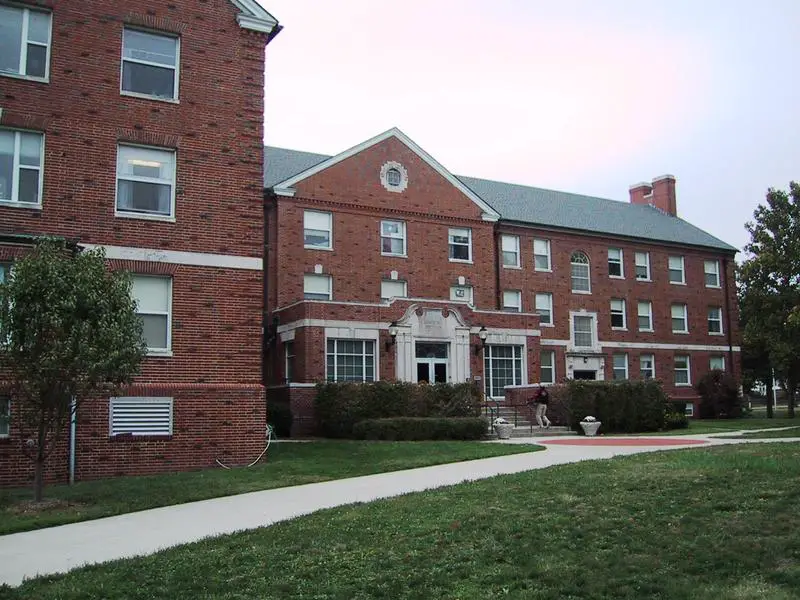
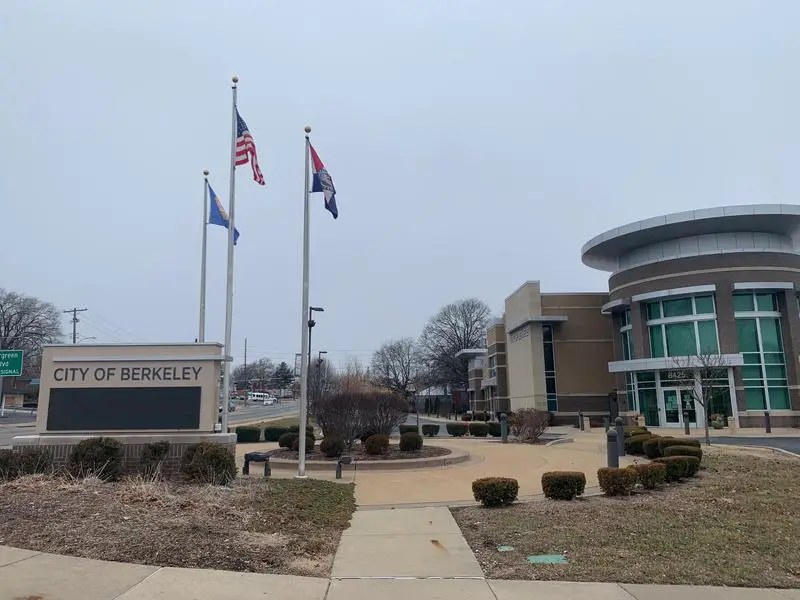
A suburb of St. Louis, Berkeley sits about 20 minutes from the city center. It also contains part of theSt. Louis Lambert International Airport. Even with these key economic advantages, the 8,232 residents of Berkeley struggle, leaving the area at number 10 on the list of Missouri’s worst hometowns.
Jobs are scarce in Berkeley. The unemployment rate stands at 4.1%. In addition, wages in the area are low, with a median income of $37,757. Crime, education, and housing are concerns as well.
There are benefits to life in Berkeley. The aerospace company Boeing has a large presence in town (its by an airport, after all).
Methodology: How we determined the worst places to live in Missouri for 2024
To figure out the worst places to live in Missouri, we used Saturday Night Science to idenift what kinds of things people like and then decide what cities have the least amount of those things.
We don’t think it’s a stretch to assume that people like the following things:
- Good education
- Lots of jobs
- Low crime
- Low poverty
- Nice homes
- High incomes
- High population density (Lots of things to do)
- Short work commutes
- Health insurance
The data comes from the Census’s most recent American Community Survey and the FBI Uniform Crime Report.
We broke crime down into violent crime and property crime to give violent crime a more significant weight. If you did a simple calculation of all crimes per capita, property crimes are typically 7x more common and bias that ranking.
Furthermore, only cities with at least 5,000 people were considered — leaving 124 cities.
We then ranked each city from 1 to 124 for all the criteria, with a #1 ranking being the worst for the particular criteria.
Next, we averaged the rankings into one “Worst Place To Live Score.”
Finally, we ranked every city on the “Worst Place To Live Score,” with the lowest score being the worst city in Missouri — Jennings. Read on for a detailed look at the ten worst cities in Missouri. This article is an opinion based on facts meant as infotainment. We updated this article for 2024. This list is our tenth time ranking the worst places to live in Missouri.
Summary: Wrapping Up The Worst In Missouri
If you’re looking at areas in Missouri with the worst economic situations, where there’s higher than average crime and little to do, this is an accurate list.
And in the end, Jennings ranks as the worst city to live in Missouri for 2024.
The worst cities in Missouri are .
If you’re curious enough, here are the best cities to live in Missouri:
- Ladue (Pop. 8,934)
- Clayton (Pop. 17,212)
- Glendale (Pop. 6,131)
For more Missouri reading, check out:
Worst Places To Live In Missouri
| Rank | City | Population | Unemployment Rate | Home Price | Median Income | Crime Per Capita |
|---|---|---|---|---|---|---|
| 1 | Jennings | 12,996 | 10.1% | $58,011 | $32,462 | 0.3215 |
| 2 | Caruthersville | 5,504 | 5.3% | $95,548 | $35,585 | 0.0563 |
| 3 | Harrisonville | 10,024 | 7.9% | $253,584 | $57,607 | 0.0247 |
| 4 | West Plains | 12,250 | 4.7% | $200,891 | $38,676 | 0.0367 |
| 5 | Grandview | 25,921 | 6.4% | $203,316 | $51,048 | 0.0421 |
| 6 | Nevada | 8,128 | 4.7% | $137,667 | $44,318 | 0.0636 |
| 7 | Aurora | 7,290 | 8.6% | $150,015 | $44,728 | 0.0309 |
| 8 | Kennett | 10,383 | 7.3% | $100,009 | $52,907 | 0.0419 |
| 9 | Bellefontaine Neighbors | 10,637 | 6.2% | $92,443 | $46,115 | 0.0463 |
| 10 | Berkeley | 8,232 | 4.1% | $76,521 | $37,757 | 0.1036 |
| 11 | Lebanon | 15,023 | 8.0% | $204,244 | $45,634 | 0.0316 |
| 12 | Black Jack | 6,632 | 10.8% | $192,665 | $63,617 | 0.3215 |
| 13 | Branson | 12,651 | 4.0% | $261,481 | $49,790 | 0.0689 |
| 14 | Richmond | 5,975 | 3.3% | $203,328 | $61,694 | 0.0430 |
| 15 | Warrenton | 8,648 | 5.2% | $257,840 | $62,096 | 0.0306 |
| 16 | Overland | 15,838 | 8.0% | $130,030 | $51,749 | 0.0395 |
| 17 | Park Hills | 8,653 | 5.7% | $132,005 | $50,628 | 0.0254 |
| 18 | Independence | 122,218 | 6.2% | $189,173 | $57,415 | 0.0381 |
| 19 | Sullivan | 6,441 | 4.4% | $172,940 | $59,243 | 0.0612 |
| 20 | Ferguson | 18,546 | 5.3% | $104,371 | $47,410 | 0.0469 |
| 21 | Hazelwood | 25,345 | 9.6% | $150,689 | $55,111 | 0.0378 |
| 22 | Union | 12,341 | 5.6% | $230,739 | $68,864 | 0.0426 |
| 23 | Valley Park | 6,848 | 8.0% | $260,081 | $63,478 | 0.3215 |
| 24 | Mexico | 11,502 | 5.7% | $144,899 | $47,585 | 0.0257 |
| 25 | Clinton | 8,908 | 9.9% | $156,179 | $48,116 | 0.0374 |
| 26 | Sedalia | 21,767 | 5.4% | $166,522 | $48,518 | 0.0333 |
| 27 | Bridgeton | 11,422 | 4.1% | $250,506 | $69,982 | 0.0658 |
| 28 | Neosho | 12,670 | 4.2% | $196,630 | $49,301 | 0.0295 |
| 29 | Sikeston | 16,146 | 2.9% | $144,611 | $47,464 | 0.0499 |
| 30 | Springfield | 168,873 | 4.8% | $222,322 | $43,450 | 0.0636 |
| 31 | Carthage | 15,491 | 4.4% | $165,262 | $43,526 | 0.0238 |
| 32 | Monett | 9,632 | 4.6% | $159,794 | $42,635 | 0.0257 |
| 33 | Bonne Terre | 6,863 | 3.7% | $188,714 | $34,409 | 0.0112 |
| 34 | St. Louis | 298,018 | 5.4% | $168,569 | $52,941 | 0.0838 |
| 35 | Bolivar | 10,780 | 5.0% | $232,364 | $40,530 | 0.0282 |
| 36 | Moberly | 13,708 | 7.5% | $113,331 | $39,332 | 0.0184 |
| 37 | Farmington | 17,859 | 4.3% | $230,433 | $49,317 | 0.0445 |
| 38 | Joplin | 51,848 | 4.9% | $183,710 | $50,996 | 0.0661 |
| 39 | Fulton | 12,648 | 10.5% | $205,135 | $59,544 | 0.0214 |
| 40 | St. John | 6,583 | 6.0% | $117,212 | $52,000 | 0.0305 |
| 41 | Excelsior Springs | 10,546 | 4.0% | $202,892 | $74,196 | 0.0261 |
| 42 | St. Joseph | 72,198 | 5.1% | $145,631 | $54,515 | 0.0499 |
| 43 | Boonville | 7,725 | 7.1% | $176,207 | $50,932 | 0.0254 |
| 44 | Kirksville | 17,533 | 5.8% | $141,459 | $41,089 | 0.0513 |
| 45 | De Soto | 6,430 | 4.5% | $206,200 | $44,788 | 0.0185 |
| 46 | Raytown | 29,772 | 5.2% | $191,914 | $64,542 | 0.0421 |
| 47 | St. Robert | 5,242 | 2.7% | $204,458 | $52,627 | 0.0475 |
| 48 | Perryville | 8,536 | 6.4% | $201,535 | $52,500 | 0.0169 |
| 49 | Hannibal | 17,003 | 3.9% | $141,434 | $52,746 | 0.0382 |
| 50 | Pacific | 7,239 | 1.5% | $210,666 | $52,155 | 0.0171 |
| 51 | Trenton | 5,527 | 5.4% | $80,691 | $48,909 | 0.0163 |
| 52 | Marshfield | 7,501 | 5.4% | $238,760 | $63,842 | 0.0291 |
| 53 | Belton | 24,241 | 5.4% | $236,726 | $68,030 | 0.0285 |
| 54 | Cameron | 9,101 | 8.1% | $211,143 | $50,206 | 0.0118 |
| 55 | Rolla | 20,025 | 5.0% | $198,371 | $37,685 | 0.0396 |
| 56 | Oak Grove | 8,304 | 5.3% | $271,763 | $71,006 | 0.0135 |
| 57 | Poplar Bluff | 16,313 | 5.9% | $154,670 | $37,448 | 0.0047 |
| 58 | Festus | 12,772 | 5.4% | $259,258 | $65,942 | 0.0177 |
| 59 | Peculiar | 5,675 | 4.3% | $329,307 | $91,783 | 0.0206 |
| 60 | Wildwood | 35,276 | 2.7% | $513,120 | $147,508 | 0.3215 |
| 61 | Pevely | 6,012 | 4.7% | $238,053 | $68,141 | 0.0258 |
| 62 | Cape Girardeau | 39,795 | 3.4% | $198,696 | $51,671 | 0.0308 |
| 63 | Florissant | 52,167 | 6.4% | $176,193 | $64,178 | 0.0257 |
| 64 | Waynesville | 5,372 | 5.2% | $218,372 | $47,193 | 0.0168 |
| 65 | Willard | 6,342 | 2.9% | $252,650 | $76,500 | 0.0093 |
| 66 | Liberty | 30,299 | 3.7% | $303,673 | $91,512 | 0.0381 |
| 67 | Pleasant Hill | 8,822 | 5.8% | $320,437 | $88,408 | 0.0054 |
| 68 | Dexter | 7,910 | 0.9% | $149,823 | $45,617 | 0.0230 |
| 69 | St. Ann | 12,917 | 3.0% | $136,175 | $48,081 | 0.0234 |
| 70 | Warrensburg | 19,317 | 6.8% | $250,017 | $54,535 | 0.0294 |
| 71 | Gladstone | 26,964 | 4.4% | $246,002 | $68,633 | 0.0305 |
| 72 | Macon | 5,452 | 2.7% | $155,350 | $50,101 | 0.0163 |
| 73 | Troy | 12,964 | 1.8% | $278,307 | $74,463 | 0.0235 |
| 74 | Marshall | 13,687 | 2.8% | $157,575 | $52,171 | 0.0175 |
| 75 | Washington | 14,769 | 4.1% | $276,502 | $75,127 | 0.0251 |
| 76 | Columbia | 126,172 | 4.0% | $280,111 | $60,455 | 0.0313 |
| 77 | Weldon Spring | 5,320 | 6.3% | $549,244 | $143,389 | 0.0387 |
| 78 | Chillicothe | 9,091 | 3.5% | $153,392 | $54,119 | 0.0121 |
| 79 | Blue Springs | 58,720 | 4.0% | $283,645 | $82,965 | 0.0244 |
| 80 | Ozark | 21,459 | 3.6% | $290,499 | $66,631 | 0.0147 |
| 81 | Arnold | 20,840 | 3.5% | $241,114 | $72,317 | 0.0156 |
| 82 | Republic | 18,824 | 3.8% | $249,783 | $63,102 | 0.0086 |
| 83 | Maryland Heights | 28,099 | 2.9% | $234,669 | $82,232 | 0.0295 |
| 84 | Raymore | 23,232 | 2.8% | $328,747 | $96,536 | 0.0171 |
| 85 | Maplewood | 8,205 | 1.8% | $243,461 | $58,448 | 0.0552 |
| 86 | Eureka | 12,008 | 5.4% | $364,147 | $104,697 | 0.0132 |
| 87 | Kearney | 10,491 | 1.4% | $379,573 | $99,969 | 0.0158 |
| 88 | Lee’s Summit | 101,728 | 3.8% | $347,310 | $103,447 | 0.0229 |
| 89 | Wentzville | 44,584 | 3.3% | $364,171 | $109,158 | 0.0158 |
| 90 | Smithville | 10,416 | 0.7% | $354,373 | $95,122 | 0.0070 |
| 91 | Sunset Hills | 9,121 | 5.3% | $538,666 | $126,199 | 0.0227 |
| 92 | Ellisville | 9,914 | 5.2% | $360,277 | $104,360 | 0.0136 |
| 93 | Nixa | 23,523 | 4.1% | $297,518 | $74,814 | 0.0097 |
| 94 | Maryville | 10,691 | 2.4% | $207,346 | $49,144 | 0.0214 |
| 95 | St. Peters | 57,692 | 2.9% | $289,759 | $88,708 | 0.0180 |
| 96 | Odessa | 5,554 | 0.0% | $225,800 | $86,125 | 0.0095 |
| 97 | Parkville | 7,669 | 3.6% | $574,364 | $166,563 | 0.0171 |
| 98 | Jackson | 15,394 | 3.8% | $245,343 | $72,500 | 0.0109 |
| 99 | Grain Valley | 15,688 | 2.7% | $323,497 | $82,364 | 0.0161 |
| 100 | Richmond Heights | 9,186 | 1.7% | $353,272 | $94,384 | 0.0720 |
1) This author does not live in Missouri. I highly doubt he has been to the towns he sits in judgement of. Numbers on paper do not depict actual quality of life issues in any town or city. The community of Charleston is filled with people who would give you anything you truly needed to survive or make your life better if you were in NEED.
2) This author does not understand statistical data. He failed to take into account the FACT that Charleston has a state pen population within its statistical data. Of course those folks are largely broke, unemployed, and uneducated. SKEWED DATA does NOT make an accurate picture.
3) This author spews forth negativity under the guise of it being “infotainment”. Who would tear down people and their communities for “infotainment”. He obviously is in severe need of guidance and direction.
You need to add Ferguson to that list.
The problem with the variables used to rank cities is that they are all symptoms of one another. Low employment = Low income = high crime = low housing cost.
At the same time, if you take a look at some cities, the housing costs are very low compared to other areas and that is a negative, even though it shouldn’t be. If I can get a 3000 SQFT, newly built home in a small town in Southeast Missouri for half the price, why is that immediately a bad thing?
It would have been nice to measure assets of a city like cultural institutions and arts venues; especially those that are free and open to the public. The City of St. Louis has a world class symphony orchestra, art museum, history museum, national monument (the Arch) the Cathedral Basilica among many others that make living in St. Louis delightful!
Centralia was the site of an infamous massacre in 1919 and now it has massacred the competition when it comes to being the worst place to live in Washington. The mix of extremely high unemployment and crime is a winning combination to end up high on our list of worst places to live.
Id take small town crime… car break spousal fights etc rather than rapes and murders any day!.All in the same catagory.? Murders are rare.plus a town like Park Hills is almost a suburb of Farmington a town with growing number of restaurants a movie A college is in Park Hlls so olays and music and car race track nearby so there is entertainment Maybe not BIG CITY but ok except for GOOD JOBS needed… as everywhere
I grew up South of Farmington. Haven’t lived there for many years now. I notice the author just HAD to use that picture of the abandoned lead mine WITHOUT mentioning it’s now a state historical site. My uncle worked there until it was shut down, worked there and farmed too!
As far as I’m concerned, Farmington, Fredericktown, Park Hills, Bonne Terre, Desloge, and all those places are still God’s country. Park hills will always be Flat River to me.
Not to mention PARK HILLS is in the” PARKLAND “named because many large well known parks within close driving distance for horse back riding canoeing dirt bike or bike riding swimning walking camping fishing among other things. AND GENEROUS giving corteous people here too.NOTHING TO DO? maybe by NY standards
park hills mo should be a hick town
Lamar Missouri should have made the list. There’s no work if you’re not in the right click it could be a snooty place to live. We have a chief of police you can’t get in to see you can’t talk to on the phone. They’re more concerned about making the town look nice then making it be a nice town to live in. What drug issues all over the place. Yet the fight somebody for having a decent-looking car in their driveway with no tags because it needs work taxes paid on it no less and is insured. Butt we’ll let the guy up the street have rusted-out novas his front yard. The dog pound lady harasses people giving out these uncalled for tickets. But at 10 o’clock at night when you have a pitbull in your yard growling at you and your puppy you call and they say you have to talk to her 9 to 5 Monday through Friday there’s nothing they can do. The one thing Lamar does have is an excellent Athletics program. But the town is going to hell in a handbasket and all they want to do is make sure it looks nice as it goes down.
Not sure how long you have lived here but this city is not beholding to anyone new. This city does not like changes made to anything and how dare anyone questions anyone of authority. The state rep does not handle criticism and bamblaststs anyone who questions him and he has been in this job for 8 years and has still not brought any busineses to this city? Now his wife is running due to term limits and we will see the name again for another 8 years and everyone thinks he is God. All the young kids are leaving as soon as they graduate because there is nothing here for them especially jobs.. This city does not want changes or new people. They want the same old thing they have had for years and nothing changed and due to that everything has to close down. We have no grocery store? What county seat has no grocery store so that forces everyone to go to Wal Mart for everything? Unemployment rate is the highest it has ever been here in Lamar at an all time high and more people are unemployed in this town than ever before. We moved here from another state and small city and they were wonderful but we were never welcomed by anyone in this town. We were never given a map, a phone book and never approached by anyone in this town for a welcone to Lamar. For any town to treat someone who moved in the way we were treat is apprehensible. We are both politically savvy but how dare we question the state rep or everyone in town bamblasts me when we know more than he does. We knew we had made a mistake by moving here within a year after we moved but we are now stuck with a house we can get nothng out of so ther is nothng we can do for now unless we just take a “dive” on our home. We want out because everything her costs extra money. Every single little thing costs money. This city cannot sem to combine anything together into one bill but they want everything separate so everything here cost more than it did where we came fron in Texas and there we had no taxes on groceries. People including the county commissioners do not want changes here. The doctors are horrible and that is all of southwest Missouri and not just here. The sheriffs dept? The animal control? This town is not accepting of new people who move in and they never will unless atitudes change and new ideas come forth and it never will change and with the same people in charge of the city and county I am not looking for that to happen. Lamar Missouri should have been in the top 5 on this list of worst places to live in the State of Missouri.
I live in Nevada Mo. I don’t disagree
Stop giving my city a bad name some evil. Wants to destroy the country don’t forget St.Louis started with the Indians. We see others from. Other places all are welcome. But. Our women. Men and children will countine. In the footsteps. Of peace education. And living. Happy I. St.Louis leave our people alone. Leave our beautiful city alone. Am a happy Indian and half black. Native born. In the 1960s. Am young and am standing up for St.Louis. and my country .have you ate spegetti.
The good. People. Want to survive we are not giving up hope and our dreams to keep St.Louis our beautiful. City. Alive.we love our city we. Love our citizens. The bad. Will not destroy. St.Louis.wake up St.Louis look at all the good things that were built. By people in Missouri. So that we all can have a beautiful. Place to live. Stand up for good people. Love you St.Louis
You need to add the city of St. Louis to the list. Not everywhere in St. Louis is bad, but the city does actually get bad once you cross kingshighway and when you’re north of delmar blvd. It’s where crime peaks at its worst in the St. Louis area.
They are number 12 on the list.
Interesting that Missouri’s largest city (Kansas City) did not get listed.
Nope, but they did include most of KC’s suburbs (Parkville & Lee’s Summit are 2 that I can only think of offhand) & nearest surrounding cities (Lexington, Higginsville, Platte City are 3 that I can only think of offhand).
Spot on! Aurora deserves it number “2” ranking. Its a turd. All of southwest Mo is horrible. I advise anybody thinking about moving here to go elsewhere. This aint little house on the prairie.
Lived in Springfield since the 1990s. This town has a lot of issues, Crime and drugs are bad but the police chief and city council are only worried about speeding. So kill some one just don’t speed. Jobs are hard to find with good pay. The town is split in half, south side gets the money and business and the north side gets what’s left, which isn’t much. Oh the city council is just a big wheel, same people different term. And this city is ran by the City Utilities. So you pay the rate for your electric or gas or go with out. The schools are in bad shape expect for the were all the big money kids go. And they raise your taxes when ever they feel they need a pay raise. The teachers are horribly unpaid.