
Cities with highest divorce rate in New Jersey research summary. We used Saturday Night Science to analyze New Jersey’s most recent Census data to determine the divorce rate for each city in New Jersey based on the percentage of currently divorced residents. Here are the results of our analysis:
-
The city with the highest divorce rate in New Jersey is South Amboy based on the most recent Census data.
-
South Amboy is 10.0% Divorced.
-
The city with the lowest divorce rate in New Jersey is Woodcliff Lake.
-
Woodcliff Lake is 0.0% Divorced.
-
New Jersey is 4.0% Divorced.
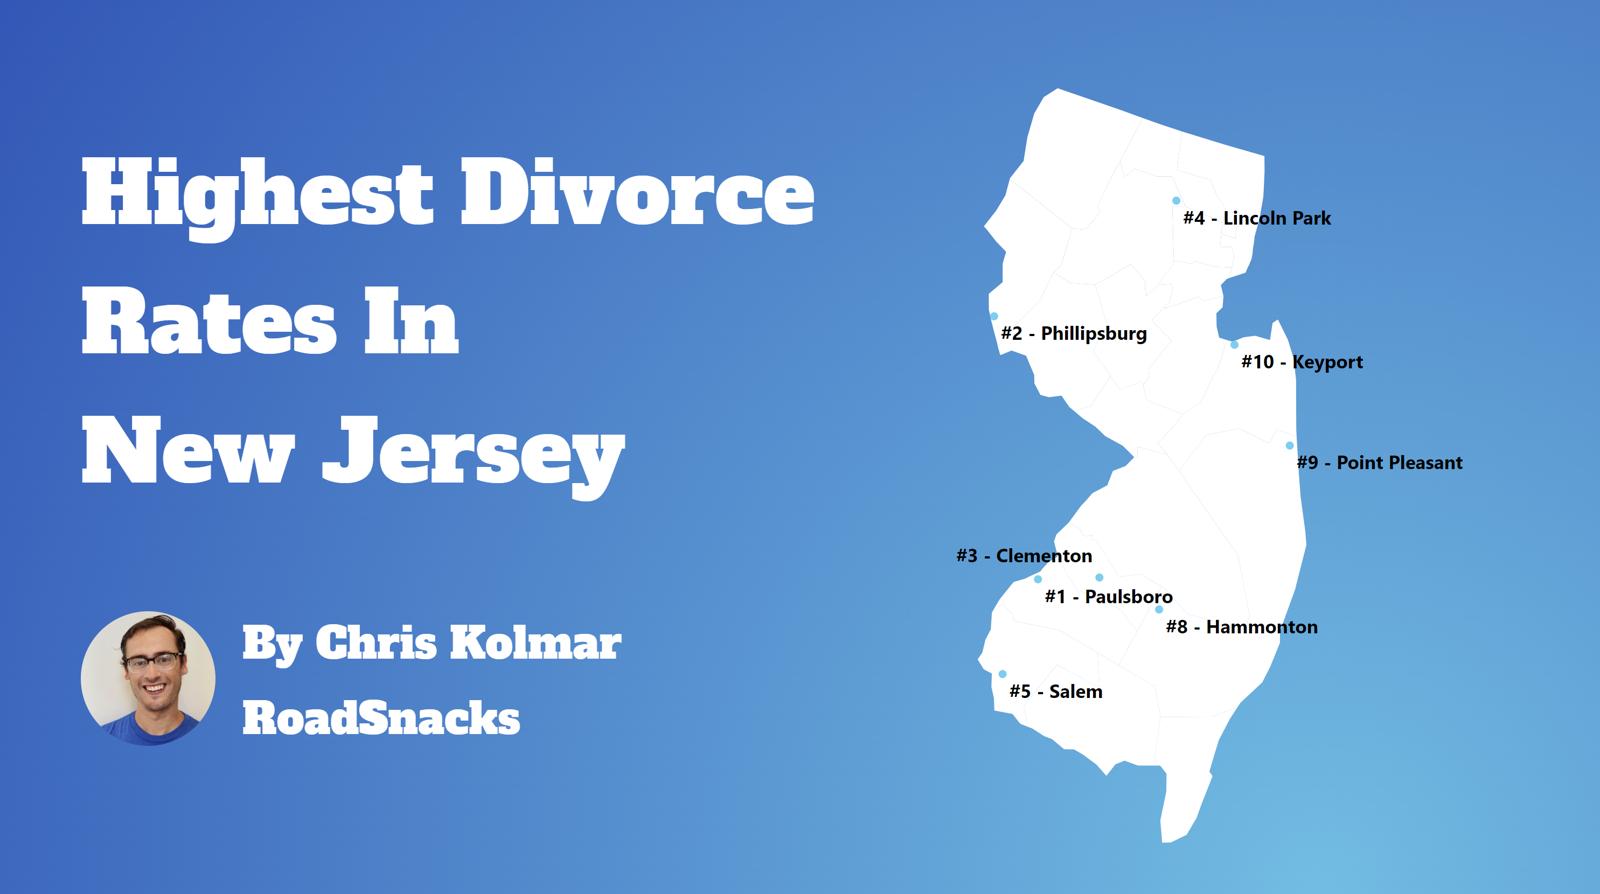
Table Of Contents: Top Ten | Methodology | Summary | Table
There are some 299,001 people living in New Jersey over fifteen years of age who are divorced. You can compare that to the 28,339,199 Americans who are currently divorced in 2026.
Many people decide to run away – or split up – across the Garden State.
Isn’t the divorce rate in America close to 50%? Yes indeed. But we’re measuring something else; we are looking at counts and percentages of people over 15 years old who are currently divorced. That 50% statistic is for the percentage of people who have ever been divorced.
For today’s analysis, the focus will be on the number of currently divorced people.
So now that we have you biting your nails, rethinking your worldview, and pulling out your hair, let’s look at the places in New Jersey with the highest rates of divorcees.
The 10 Cities In New Jersey With The Highest Divorce Rates
Let’s quickly recap before we dive into the Saturday Night Science behind the data.
What is the city in New Jersey with the highest divorce rate? That would be South Amboy, with 10.0% of people over 15 years of age being divorced, per the most recent census data.
What is the overall New Jersey divorce rate? According to the 2020-2024 Community Survey, the overall divorce rate in New Jersey is 4.0%, which compares to the US divorce rate of 10.9%.
Alrighty, on to how we calculated the places with the highest divorce rates in New Jersey.
For more New Jersey reading, check out:
The 10 Places With The Highest Divorce Rate In New Jersey For 2026

/10
Population: 9,989
Divorce Rate: 10.0%
Divorcees: 799
Median Income: $91,997
More on South Amboy: Data | Crime | Cost Of Living | Movers

/10
Population: 7,059
Divorce Rate: 10.0%
Divorcees: 564
Median Income: $140,960
More on Mil: Data | Movers

/10
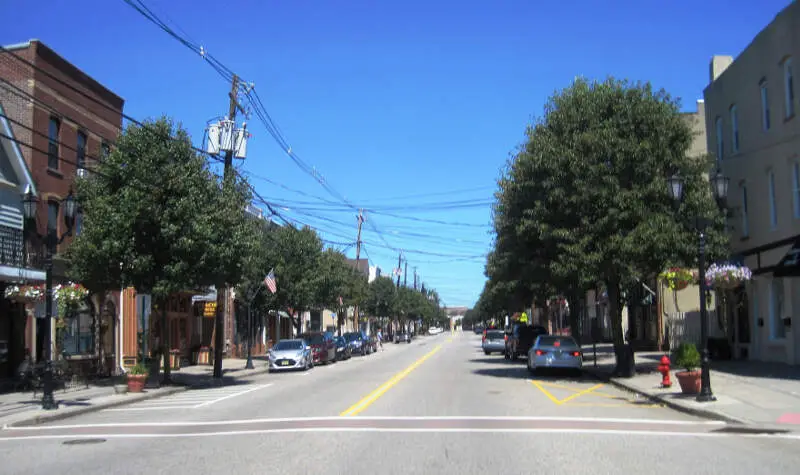
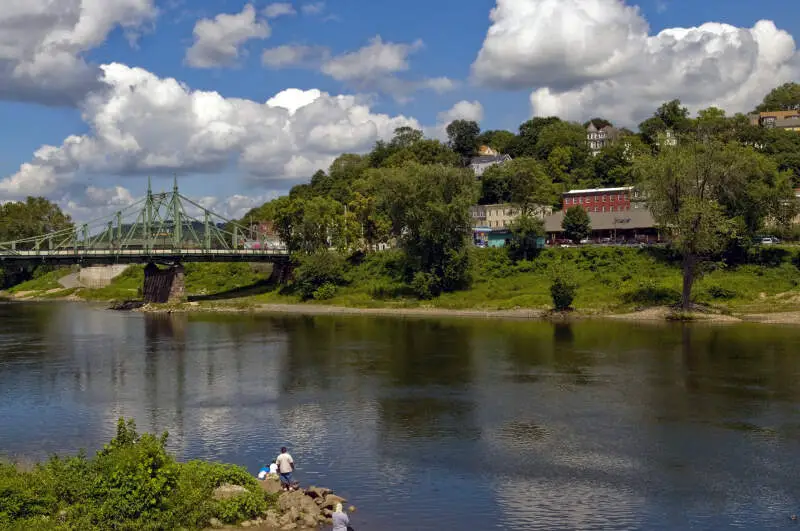
Population: 15,299
Divorce Rate: 9.0%
Divorcees: 1,101
Median Income: $68,324
More on Phillipsburg: Data | Crime | Cost Of Living | Movers

/10
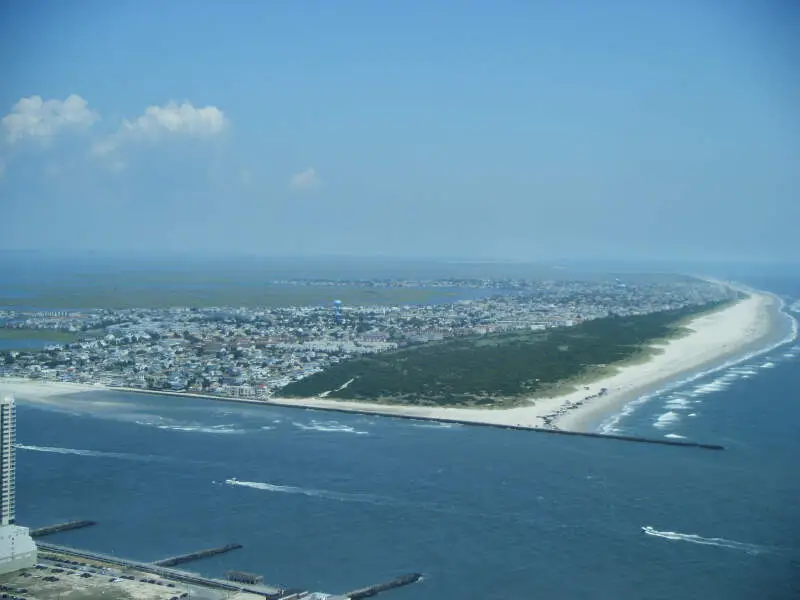
Population: 7,674
Divorce Rate: 8.0%
Divorcees: 491
Median Income: $97,250
More on Brigantine: Data | Crime | Cost Of Living | Movers

/10
Population: 8,854
Divorce Rate: 8.0%
Divorcees: 566
Median Income: $114,302
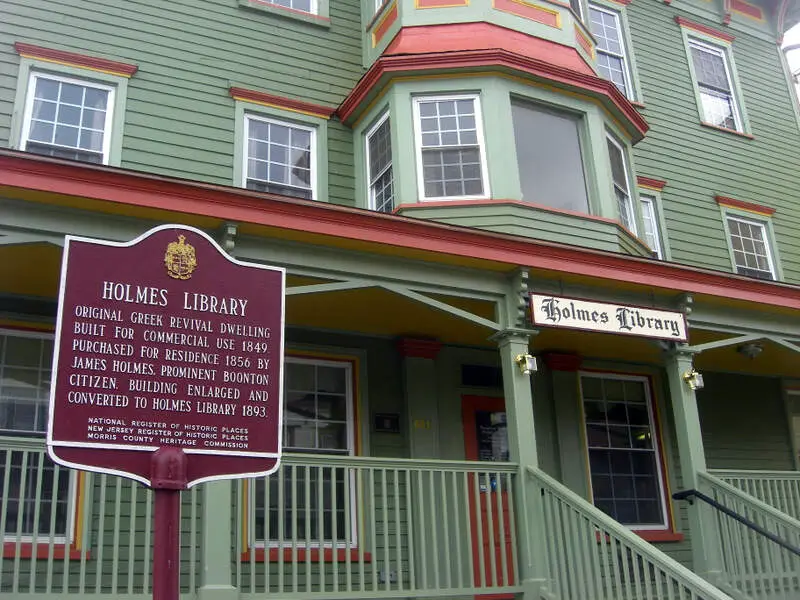
More on Boonton: Data | Crime | Cost Of Living | Movers

/10
Population: 11,737
Divorce Rate: 8.0%
Divorcees: 751
Median Income: $76,654
More on Bellmawr: Data | Crime | Cost Of Living | Movers

/10
Population: 8,456
Divorce Rate: 8.0%
Divorcees: 541
Median Income: $111,599
More on Northfield: Data | Crime | Cost Of Living | Movers

/10
Population: 19,334
Divorce Rate: 8.0%
Divorcees: 1,237
Median Income: $115,625
More on Point Pleasant: Data | Crime | Cost Of Living | Movers

/10
Population: 14,840
Divorce Rate: 8.0%
Divorcees: 949
Median Income: $78,087
More on Hammonton: Data | Crime | Cost Of Living | Movers

/10
Population: 10,921
Divorce Rate: 8.0%
Divorcees: 698
Median Income: $93,333
More on Manville: Data | Crime | Cost Of Living | Movers
How We Determined The Places In New Jersey That Get Un-Hitched The Most
Since this is the 58th category of rankings we are compiling for the site, we had a pretty good idea of where to find data on marriage and divorce in America. We used Saturday Night Science to look at the U.S. Census Bureau on divorce rates. Because who likes tracking misery more than the U.S. government?
Specifically, we looked at the 2020-2024 American Community Survey table S1201 — Marital Status.
Pretty straightforward on that front — we just had to extract the following column of data:
- Population 15 Years and Over -> Divorced
There are some interesting/fun/sad data like .1% of female Americans aged 15-19 are divorced, but 0% of males (That’s probably a rounding issue, but still).
But the national data is for another day. Today, the analysis focuses on the 189 places in New Jersey with a population of over 5,000.
We ranked each place by the percentage of divorcees over 15 years of age from highest to lowest. We crowned the divorce capital of New Jersey the place with the highest incidence of divorcees, South Amboy.
And if you’re trying to avoid divorce, check out Woodcliff Lake, the city with the lowest divorce rate in New Jersey.
We updated this article for 2026 and this list is our fifth time ranking the cities in New Jersey with the highest divorce rates.
Getting Some Closure In New Jersey After Untying The Know
Besides just coming up with what we thought would be a great new blog/book title, “Untying the Knot In New Jersey: Life After Divorce,” we now have a sense of what places in the Garden State don’t pay much attention to the whole “’til death do we part” phrase.
The cities with the highest divorce rate in New Jersey are South Amboy, Mil, Phillipsburg, Brigantine, Boonton, Bellmawr, Northfield, Point Pleasant, Hammonton, and Manville.
Try to keep in mind that the reason cities rank where they do in New Jersey could be because of the age, education, and income distribution, as all of those things impact the rate of divorce.
And that’s probably for the best. Getting out of a toxic relationship is much better than staying in it.
Just make sure you have your running shoes ready to go.
For more New Jersey reading, check out:
Cities With The Highest Divorce Rates In New Jersey
| Rank | City | Population | Divorcees | Divorce Rate |
|---|---|---|---|---|
| 1 | South Amboy, NJ | 9,989 | 799 | 10.0% |
| 2 | Mil, NJ | 7,059 | 564 | 10.0% |
| 3 | Phillipsburg, NJ | 15,299 | 1,101 | 9.0% |
| 4 | Brigantine, NJ | 7,674 | 491 | 8.0% |
| 5 | Boonton, NJ | 8,854 | 566 | 8.0% |
| 6 | Bellmawr, NJ | 11,737 | 751 | 8.0% |
| 7 | Northfield, NJ | 8,456 | 541 | 8.0% |
| 8 | Point Pleasant, NJ | 19,334 | 1,237 | 8.0% |
| 9 | Hammonton, NJ | 14,840 | 949 | 8.0% |
| 10 | Manville, NJ | 10,921 | 698 | 8.0% |
| 11 | Paulsboro, NJ | 6,248 | 399 | 8.0% |
| 12 | Clementon, NJ | 5,410 | 346 | 8.0% |
| 13 | Butler, NJ | 8,133 | 455 | 7.0% |
| 14 | Keansburg, NJ | 9,719 | 544 | 7.0% |
| 15 | Pitman, NJ | 8,856 | 495 | 7.0% |
| 16 | Mount Arlington, NJ | 5,935 | 332 | 7.0% |
| 17 | Gloucester City, NJ | 11,509 | 644 | 7.0% |
| 18 | Burlington, NJ | 9,993 | 559 | 7.0% |
| 19 | Newton, NJ | 8,369 | 468 | 7.0% |
| 20 | Pine Hill, NJ | 10,802 | 604 | 7.0% |
| 21 | Millville, NJ | 27,511 | 1,540 | 7.0% |
| 22 | Kenilworth, NJ | 8,401 | 470 | 7.0% |
| 23 | Belmar, NJ | 5,869 | 328 | 7.0% |
| 24 | Caldwell, NJ | 9,003 | 432 | 6.0% |
| 25 | Lindenwold, NJ | 21,719 | 1,042 | 6.0% |
| 26 | Lincoln Park, NJ | 10,957 | 525 | 6.0% |
| 27 | Audubon, NJ | 8,730 | 419 | 6.0% |
| 28 | Rumson, NJ | 7,241 | 347 | 6.0% |
| 29 | Hawthorne, NJ | 19,628 | 942 | 6.0% |
| 30 | Long Branch, NJ | 32,530 | 1,561 | 6.0% |
| 31 | Watchung, NJ | 6,485 | 311 | 6.0% |
| 32 | Beachwood, NJ | 11,088 | 532 | 6.0% |
| 33 | Dunellen, NJ | 7,911 | 379 | 6.0% |
| 34 | Manasquan, NJ | 5,922 | 284 | 6.0% |
| 35 | Middlesex, NJ | 14,645 | 702 | 6.0% |
| 36 | Spotswood, NJ | 8,171 | 392 | 6.0% |
| 37 | Washington, NJ | 7,334 | 352 | 6.0% |
| 38 | Keyport, NJ | 7,171 | 344 | 6.0% |
| 39 | Salem, NJ | 5,322 | 255 | 6.0% |
| 40 | Barrington, NJ | 7,076 | 283 | 5.0% |
| 41 | East Rutherford, NJ | 10,313 | 412 | 5.0% |
| 42 | Rockaway, NJ | 6,613 | 264 | 5.0% |
| 43 | Absecon, NJ | 9,170 | 366 | 5.0% |
| 44 | Runnemede, NJ | 8,355 | 334 | 5.0% |
| 45 | Red Bank, NJ | 12,862 | 514 | 5.0% |
| 46 | Rahway, NJ | 30,109 | 1,204 | 5.0% |
| 47 | Sayreville, NJ | 45,838 | 1,833 | 5.0% |
| 48 | Midland Park, NJ | 7,019 | 280 | 5.0% |
| 49 | Hopatcong, NJ | 14,565 | 582 | 5.0% |
| 50 | Tinton Falls, NJ | 19,361 | 774 | 5.0% |
| 51 | Clayton, NJ | 8,921 | 356 | 5.0% |
| 52 | Woodbury, NJ | 10,042 | 401 | 5.0% |
| 53 | Matawan, NJ | 9,710 | 388 | 5.0% |
| 54 | Oceanport, NJ | 6,195 | 247 | 5.0% |
| 55 | Somers Point, NJ | 10,515 | 420 | 5.0% |
| 56 | Linwood, NJ | 6,992 | 279 | 5.0% |
| 57 | Hackett, NJ | 10,140 | 405 | 5.0% |
| 58 | Eato, NJ | 13,575 | 543 | 5.0% |
| 59 | Bound Brook, NJ | 12,219 | 391 | 4.0% |
| 60 | Camden, NJ | 71,496 | 2,287 | 4.0% |
| 61 | Vineland, NJ | 61,006 | 1,952 | 4.0% |
| 62 | Wood-Ridge, NJ | 10,218 | 326 | 4.0% |
| 63 | Atlantic City, NJ | 38,632 | 1,236 | 4.0% |
| 64 | Cliffside Park, NJ | 25,781 | 824 | 4.0% |
| 65 | Elmwood Park, NJ | 21,412 | 685 | 4.0% |
| 66 | Little Ferry, NJ | 10,996 | 351 | 4.0% |
| 67 | Pompton Lakes, NJ | 11,047 | 353 | 4.0% |
| 68 | Trenton, NJ | 90,338 | 2,890 | 4.0% |
| 69 | Dumont, NJ | 18,279 | 584 | 4.0% |
| 70 | Ventnor City, NJ | 9,265 | 296 | 4.0% |
| 71 | Somerville, NJ | 13,410 | 429 | 4.0% |
| 72 | Asbury Park, NJ | 15,295 | 489 | 4.0% |
| 73 | Bloomingdale, NJ | 7,716 | 246 | 4.0% |
| 74 | Bernardsville, NJ | 7,916 | 253 | 4.0% |
| 75 | New Milford, NJ | 16,995 | 543 | 4.0% |
| 76 | South Plainfield, NJ | 24,473 | 783 | 4.0% |
| 77 | South River, NJ | 16,124 | 515 | 4.0% |
| 78 | Carlstadt, NJ | 6,378 | 204 | 4.0% |
| 79 | Wanaque, NJ | 11,206 | 358 | 4.0% |
| 80 | Palmyra, NJ | 7,485 | 239 | 4.0% |
| 81 | New Providence, NJ | 13,727 | 439 | 4.0% |
| 82 | Stratford, NJ | 7,018 | 224 | 4.0% |
| 83 | Oakland, NJ | 12,768 | 408 | 4.0% |
| 84 | Lodi, NJ | 26,082 | 834 | 4.0% |
| 85 | Totowa, NJ | 10,959 | 350 | 4.0% |
| 86 | Bayonne, NJ | 71,553 | 2,289 | 4.0% |
| 87 | Ringwood, NJ | 11,657 | 373 | 4.0% |
| 88 | Ridgefield Park, NJ | 13,235 | 423 | 4.0% |
| 89 | Somerdale, NJ | 5,581 | 178 | 4.0% |
| 90 | Madison, NJ | 16,447 | 526 | 4.0% |
| 91 | Little Silver, NJ | 6,105 | 146 | 3.0% |
| 92 | Ocean City, NJ | 11,261 | 270 | 3.0% |
| 93 | Carteret, NJ | 25,496 | 611 | 3.0% |
| 94 | Jamesburg, NJ | 5,770 | 138 | 3.0% |
| 95 | Paramus, NJ | 26,568 | 637 | 3.0% |
| 96 | West Long Branch, NJ | 8,586 | 206 | 3.0% |
| 97 | Union Beach, NJ | 5,707 | 136 | 3.0% |
| 98 | Morristown, NJ | 20,453 | 490 | 3.0% |
| 99 | Mountainside, NJ | 7,049 | 169 | 3.0% |
| 100 | Fair Lawn, NJ | 35,610 | 854 | 3.0% |