
Cities with highest divorce rate in Pennsylvania research summary. We used Saturday Night Science to analyze Pennsylvania’s most recent Census data to determine the divorce rate for each city in Pennsylvania based on the percentage of currently divorced residents. Here are the results of our analysis:
-
The city with the highest divorce rate in Pennsylvania is Lewi based on the most recent Census data.
-
Lewi is 18.0% Divorced.
-
The city with the lowest divorce rate in Pennsylvania is New Freedom.
-
New Freedom is 0.0% Divorced.
-
Pennsylvania is 7.0% Divorced.
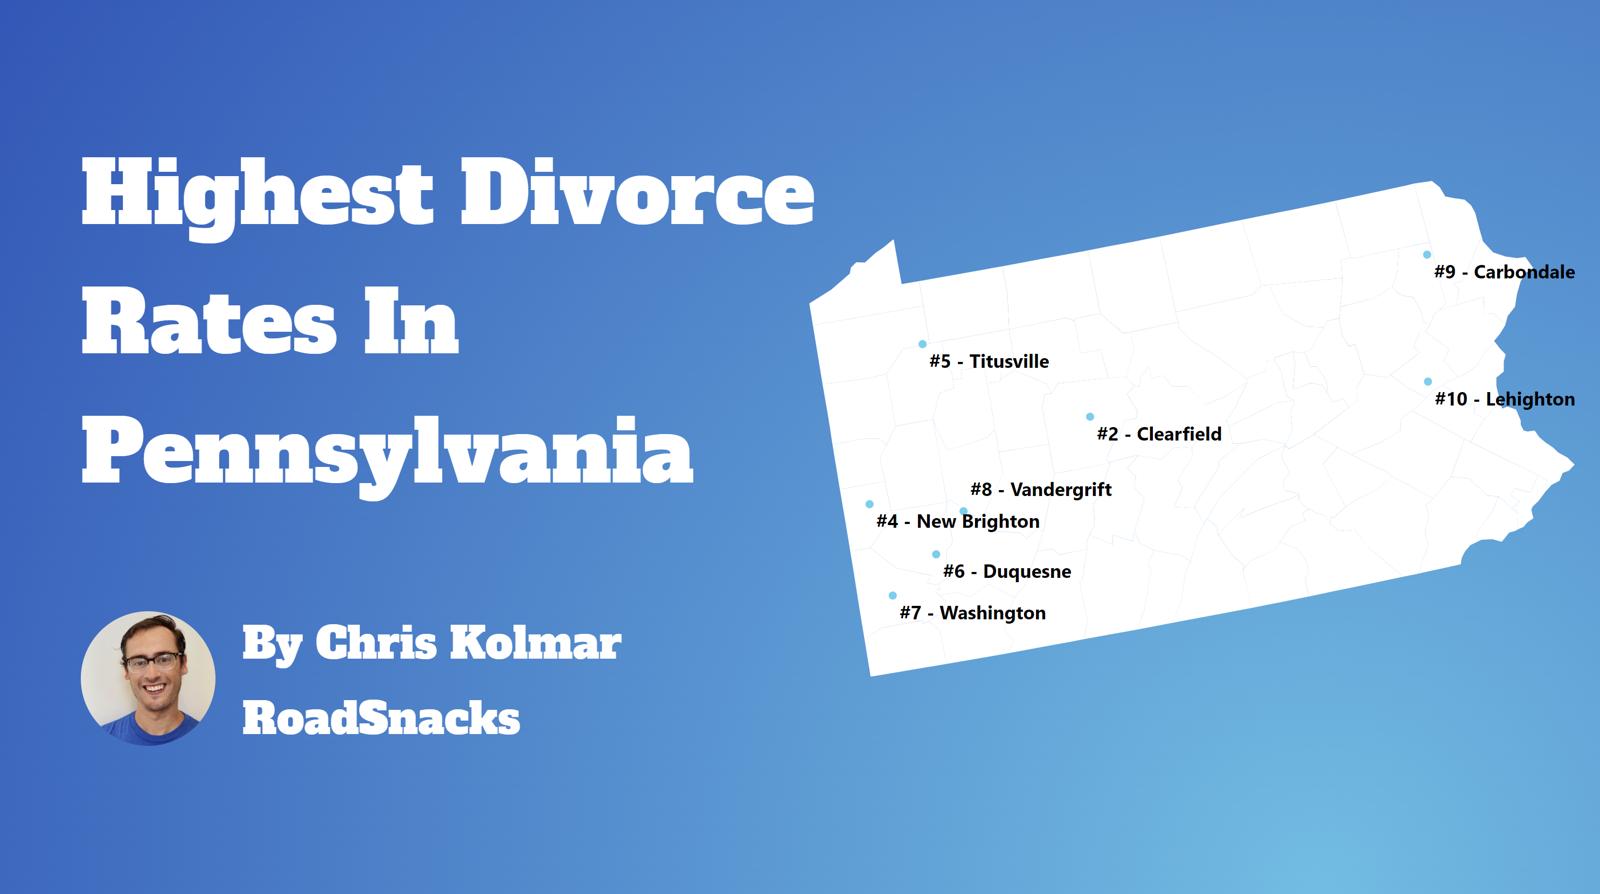
Table Of Contents: Top Ten | Methodology | Summary | Table
There are some 727,245 people living in Pennsylvania over fifteen years of age who are divorced. You can compare that to the 28,339,199 Americans who are currently divorced in 2025.
Many people decide to run away – or split up – across the Keystone State.
Isn’t the divorce rate in America close to 50%? Yes indeed. But we’re measuring something else; we are looking at counts and percentages of people over 15 years old who are currently divorced. That 50% statistic is for the percentage of people who have ever been divorced.
For today’s analysis, the focus will be on the number of currently divorced people.
So now that we have you biting your nails, rethinking your worldview, and pulling out your hair, let’s look at the places in Pennsylvania with the highest rates of divorcees.
The 10 Cities In Pennsylvania With The Highest Divorce Rates
Let’s quickly recap before we dive into the Saturday Night Science behind the data.
What is the city in Pennsylvania with the highest divorce rate? That would be Lewi, with 18.0% of people over 15 years of age being divorced, per the most recent census data.
What is the overall Pennsylvania divorce rate? According to the 2019-2023 Community Survey, the overall divorce rate in Pennsylvania is 7.0%, which compares to the US divorce rate of 10.9%.
Alrighty, on to how we calculated the places with the highest divorce rates in Pennsylvania.
For more Pennsylvania reading, check out:
- Cheapest Places To Live In Pennsylvania
- Worst Places To Live In Pennsylvania
- Best Places To Raise A Family In Pennsylvania
The 10 Places With The Highest Divorce Rate In Pennsylvania For 2025

/10
Population: 8,505
Divorce Rate: 18.0%
Divorcees: 1,224
Median Income: $40,179
More on Lewi: Data

/10
Population: 5,918
Divorce Rate: 16.0%
Divorcees: 757
Median Income: $51,190
More on Clearfield: Data

/10
Population: 6,267
Divorce Rate: 16.0%
Divorcees: 802
Median Income: $55,963
More on Steelton: Data

/10
Population: 5,230
Divorce Rate: 16.0%
Divorcees: 669
Median Income: $36,055
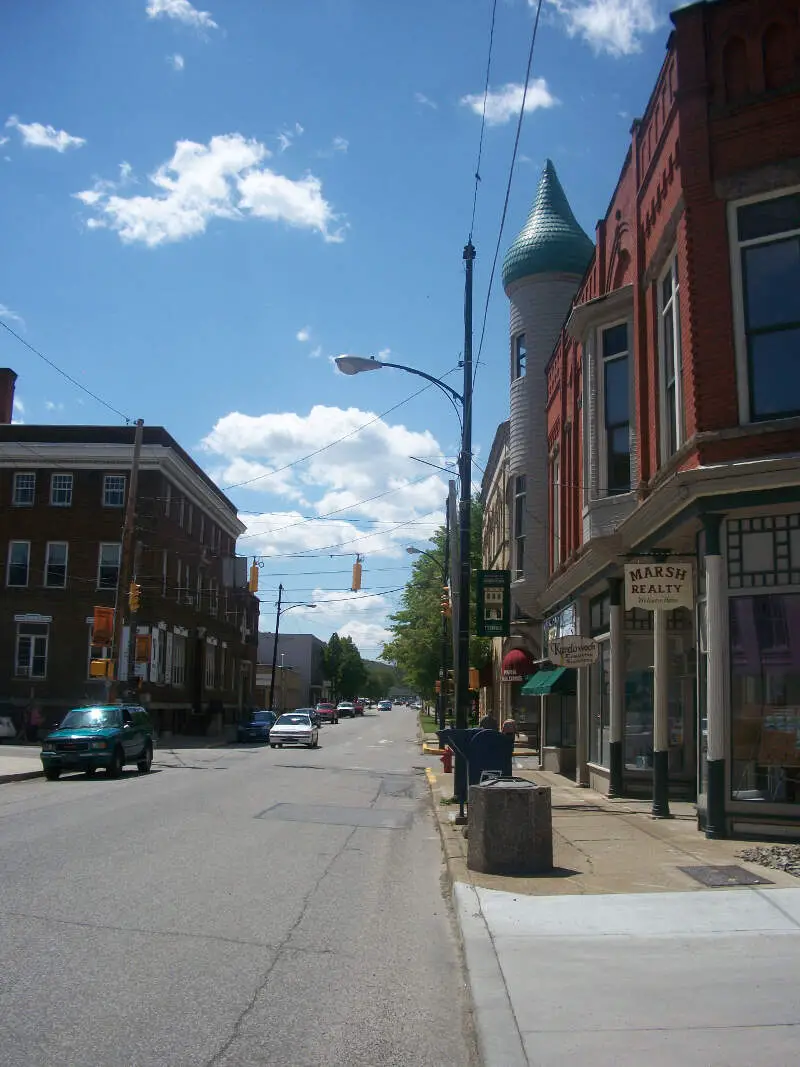
More on Titusville: Data

/10
Population: 13,374
Divorce Rate: 15.0%
Divorcees: 1,604
Median Income: $53,465
More on Pottsville: Data
/10
Population: 9,517
Divorce Rate: 15.0%
Divorcees: 1,142
Median Income: $52,688
More on Oil City: Data

/10
Population: 5,600
Divorce Rate: 15.0%
Divorcees: 672
Median Income: $50,426
More on New Brighton: Data

/10
Population: 13,361
Divorce Rate: 14.0%
Divorcees: 1,496
Median Income: $52,350
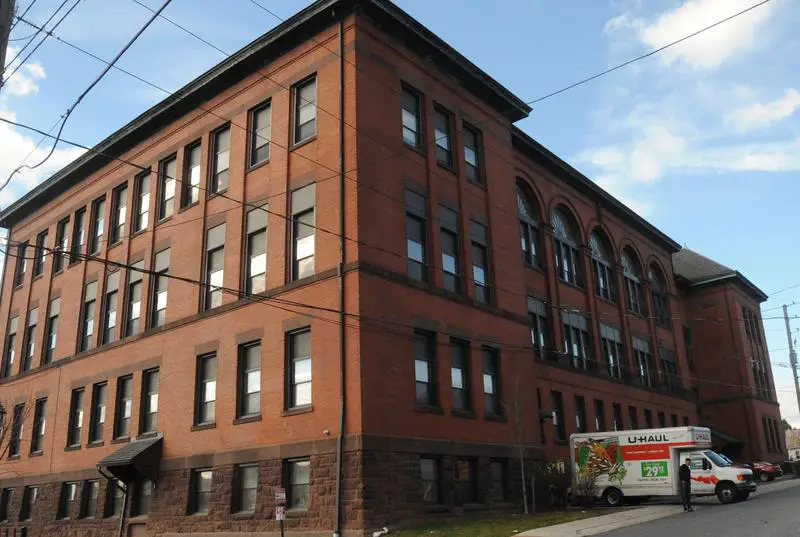
More on Washington: Data

/10
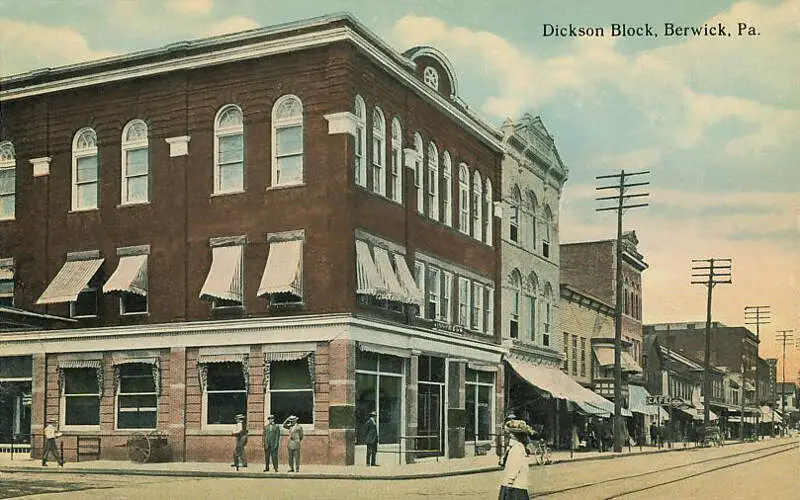
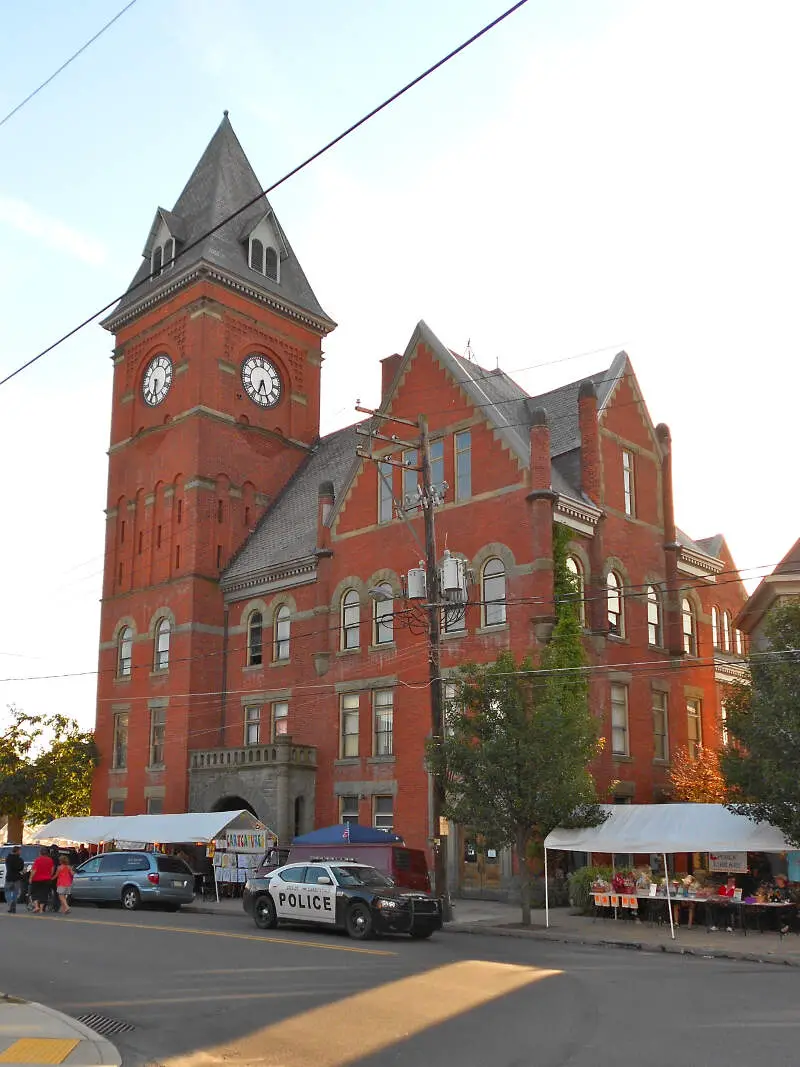
Population: 10,291
Divorce Rate: 14.0%
Divorcees: 1,152
Median Income: $45,338
More on Berwick: Data

/10
Population: 8,820
Divorce Rate: 14.0%
Divorcees: 987
Median Income: $48,592
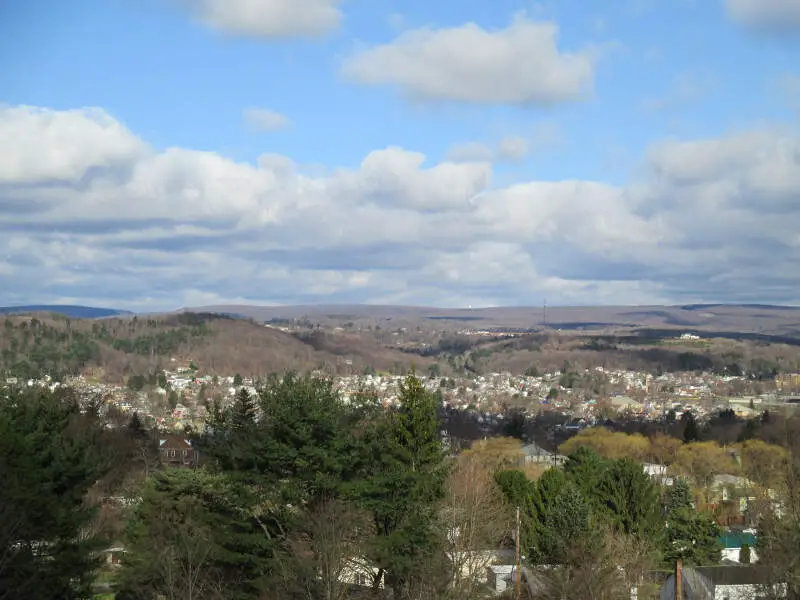
More on Carbondale: Data
How We Determined The Places In Pennsylvania That Get Un-Hitched The Most
Since this is the 58th category of rankings we are compiling for the site, we had a pretty good idea of where to find data on marriage and divorce in America. We used Saturday Night Science to look at the U.S. Census Bureau on divorce rates. Because who likes tracking misery more than the U.S. government?
Specifically, we looked at the 2019-2023 American Community Survey table S1201 — Marital Status.
Pretty straightforward on that front — we just had to extract the following column of data:
- Population 15 Years and Over -> Divorced
There are some interesting/fun/sad data like .1% of female Americans aged 15-19 are divorced, but 0% of males (That’s probably a rounding issue, but still).
But the national data is for another day. Today, the analysis focuses on the 192 places in Pennsylvania with a population of over 5,000.
We ranked each place by the percentage of divorcees over 15 years of age from highest to lowest. We crowned the divorce capital of Pennsylvania the place with the highest incidence of divorcees, Lewi.
And if you’re trying to avoid divorce, check out New Freedom, the city with the lowest divorce rate in Pennsylvania.
We updated this article for 2025 and this list is our fifth time ranking the cities in Pennsylvania with the highest divorce rates.
Getting Some Closure In Pennsylvania After Untying The Know
Besides just coming up with what we thought would be a great new blog/book title, “Untying the Knot In Pennsylvania: Life After Divorce,” we now have a sense of what places in the Keystone State don’t pay much attention to the whole “’til death do we part” phrase.
The cities with the highest divorce rate in Pennsylvania are Lewi, Clearfield, Steelton, Titusville, Pottsville, Oil City, New Brighton, Washington, Berwick, and Carbondale.
Try to keep in mind that the reason cities rank where they do in Pennsylvania could be because of the age, education, and income distribution, as all of those things impact the rate of divorce.
And that’s probably for the best. Getting out of a toxic relationship is much better than staying in it.
Just make sure you have your running shoes ready to go.
For more Pennsylvania reading, check out:
- Cheapest Places To Live In Pennsylvania
- Worst Places To Live In Pennsylvania
- Best Places To Raise A Family In Pennsylvania
Cities With The Highest Divorce Rates In Pennsylvania
| Rank | City | Population | Divorcees | Divorce Rate |
|---|---|---|---|---|
| 1 | Lewi, PA | 8,505 | 1,224 | 18.0% |
| 2 | Clearfield, PA | 5,918 | 757 | 16.0% |
| 3 | Steelton, PA | 6,267 | 802 | 16.0% |
| 4 | Titusville, PA | 5,230 | 669 | 16.0% |
| 5 | Pottsville, PA | 13,374 | 1,604 | 15.0% |
| 6 | Oil City, PA | 9,517 | 1,142 | 15.0% |
| 7 | New Brighton, PA | 5,600 | 672 | 15.0% |
| 8 | Washington, PA | 13,361 | 1,496 | 14.0% |
| 9 | Berwick, PA | 10,291 | 1,152 | 14.0% |
| 10 | Carbondale, PA | 8,820 | 987 | 14.0% |
| 11 | Duquesne, PA | 5,186 | 580 | 14.0% |
| 12 | Vandergrift, PA | 5,028 | 563 | 14.0% |
| 13 | Palmerton, PA | 5,624 | 584 | 13.0% |
| 14 | Shillington, PA | 5,462 | 568 | 13.0% |
| 15 | Turtle Creek, PA | 5,046 | 524 | 13.0% |
| 16 | Butler, PA | 13,306 | 1,383 | 13.0% |
| 17 | Coraopolis, PA | 5,464 | 568 | 13.0% |
| 18 | Johnstown, PA | 18,245 | 1,897 | 13.0% |
| 19 | Monaca, PA | 5,557 | 577 | 13.0% |
| 20 | Mckeesport, PA | 17,520 | 1,822 | 13.0% |
| 21 | Ellwood City, PA | 7,575 | 727 | 12.0% |
| 22 | Meadville, PA | 12,723 | 1,221 | 12.0% |
| 23 | New Kensington, PA | 12,072 | 1,158 | 12.0% |
| 24 | Somerset, PA | 5,984 | 574 | 12.0% |
| 25 | Altoona, PA | 43,508 | 4,176 | 12.0% |
| 26 | Old Forge, PA | 8,533 | 819 | 12.0% |
| 27 | Mckees Rocks, PA | 5,827 | 559 | 12.0% |
| 28 | New Castle, PA | 21,727 | 2,085 | 12.0% |
| 29 | White Oak, PA | 7,520 | 721 | 12.0% |
| 30 | Hollidaysburg, PA | 5,581 | 535 | 12.0% |
| 31 | Middl, PA | 9,567 | 918 | 12.0% |
| 32 | Pott, PA | 23,392 | 2,245 | 12.0% |
| 33 | Dubois, PA | 7,449 | 715 | 12.0% |
| 34 | Canonsburg, PA | 9,682 | 929 | 12.0% |
| 35 | Brookhaven, PA | 8,288 | 795 | 12.0% |
| 36 | Warren, PA | 9,273 | 890 | 12.0% |
| 37 | Brentwood, PA | 9,927 | 952 | 12.0% |
| 38 | Pittston, PA | 7,618 | 670 | 11.0% |
| 39 | Schuylkill Haven, PA | 5,247 | 461 | 11.0% |
| 40 | Oakmont, PA | 6,712 | 590 | 11.0% |
| 41 | Carnegie, PA | 8,015 | 705 | 11.0% |
| 42 | Greenville, PA | 5,533 | 486 | 11.0% |
| 43 | Northampton, PA | 10,366 | 912 | 11.0% |
| 44 | St. Marys, PA | 12,612 | 1,109 | 11.0% |
| 45 | Punxsutawney, PA | 5,689 | 500 | 11.0% |
| 46 | Jeannette, PA | 8,719 | 767 | 11.0% |
| 47 | Lehighton, PA | 5,268 | 463 | 11.0% |
| 48 | Connellsville, PA | 6,914 | 608 | 11.0% |
| 49 | New Holland, PA | 5,743 | 459 | 10.0% |
| 50 | Exeter, PA | 5,514 | 441 | 10.0% |
| 51 | Monessen, PA | 6,825 | 546 | 10.0% |
| 52 | Lansdowne, PA | 11,064 | 885 | 10.0% |
| 53 | Plymouth, PA | 5,761 | 460 | 10.0% |
| 54 | Yeadon, PA | 12,091 | 967 | 10.0% |
| 55 | Milton, PA | 6,582 | 526 | 10.0% |
| 56 | Aliquippa, PA | 9,146 | 731 | 10.0% |
| 57 | Media, PA | 5,868 | 469 | 10.0% |
| 58 | Red Lion, PA | 6,494 | 519 | 10.0% |
| 59 | Sunbury, PA | 9,643 | 771 | 10.0% |
| 60 | Ambridge, PA | 6,912 | 552 | 10.0% |
| 61 | Tyrone, PA | 5,421 | 433 | 10.0% |
| 62 | West Mifflin, PA | 19,338 | 1,547 | 10.0% |
| 63 | Bellefonte, PA | 6,022 | 481 | 10.0% |
| 64 | Crafton, PA | 5,995 | 479 | 10.0% |
| 65 | Blakely, PA | 6,661 | 532 | 10.0% |
| 66 | Munhall, PA | 10,633 | 765 | 9.0% |
| 67 | Bristol, PA | 9,874 | 710 | 9.0% |
| 68 | Mount Carmel, PA | 5,695 | 410 | 9.0% |
| 69 | Moosic, PA | 5,954 | 428 | 9.0% |
| 70 | Uniontown, PA | 9,819 | 706 | 9.0% |
| 71 | Mechanicsburg, PA | 9,535 | 686 | 9.0% |
| 72 | Huntingdon, PA | 6,884 | 495 | 9.0% |
| 73 | Lewisburg, PA | 5,247 | 377 | 9.0% |
| 74 | Beaver Falls, PA | 8,885 | 639 | 9.0% |
| 75 | West York, PA | 5,081 | 365 | 9.0% |
| 76 | Manheim, PA | 5,028 | 362 | 9.0% |
| 77 | Wilkinsburg, PA | 14,165 | 1,019 | 9.0% |
| 78 | Williamsport, PA | 27,629 | 1,989 | 9.0% |
| 79 | Birdsboro, PA | 5,090 | 366 | 9.0% |
| 80 | Lebanon, PA | 26,600 | 1,915 | 9.0% |
| 81 | Dunmore, PA | 14,123 | 1,016 | 9.0% |
| 82 | Helle, PA | 6,119 | 440 | 9.0% |
| 83 | Chambersburg, PA | 22,051 | 1,587 | 9.0% |
| 84 | Clairton, PA | 6,105 | 439 | 9.0% |
| 85 | Shippensburg, PA | 5,811 | 418 | 9.0% |
| 86 | Sharon, PA | 13,019 | 937 | 9.0% |
| 87 | Columbia, PA | 10,217 | 735 | 9.0% |
| 88 | Downin, PA | 8,163 | 587 | 9.0% |
| 89 | Glenolden, PA | 7,207 | 518 | 9.0% |
| 90 | Nanticoke, PA | 10,610 | 763 | 9.0% |
| 91 | Erie, PA | 94,156 | 6,779 | 9.0% |
| 92 | Darby, PA | 10,664 | 767 | 9.0% |
| 93 | Sayre, PA | 5,444 | 348 | 8.0% |
| 94 | Phoenixville, PA | 19,062 | 1,219 | 8.0% |
| 95 | Palmyra, PA | 7,769 | 497 | 8.0% |
| 96 | Scranton, PA | 76,074 | 4,868 | 8.0% |
| 97 | Waynesboro, PA | 11,044 | 706 | 8.0% |
| 98 | Olyphant, PA | 5,370 | 343 | 8.0% |
| 99 | Selinsgrove, PA | 5,655 | 361 | 8.0% |
| 100 | Shamokin, PA | 6,890 | 440 | 8.0% |