
Cities with highest divorce rate in South Dakota research summary. We used Saturday Night Science to analyze South Dakota’s most recent Census data to determine the divorce rate for each city in South Dakota based on the percentage of currently divorced residents. Here are the results of our analysis:
-
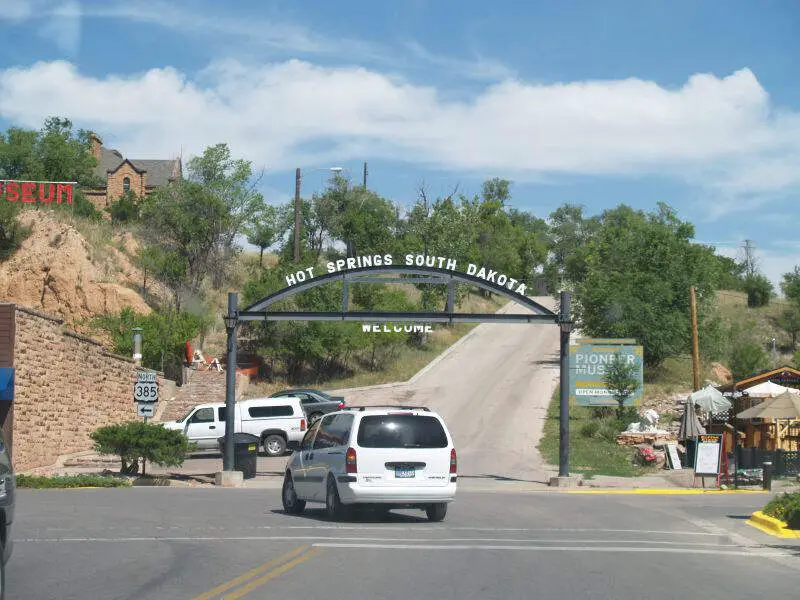
The city with the highest divorce rate in South Dakota is Hot Springs based on the most recent Census data.
-
Hot Springs is 14.0% Divorced.
-
The city with the lowest divorce rate in South Dakota is North Sioux City.
-
North Sioux City is 0.0% Divorced.
-
South Dakota is 6.0% Divorced.
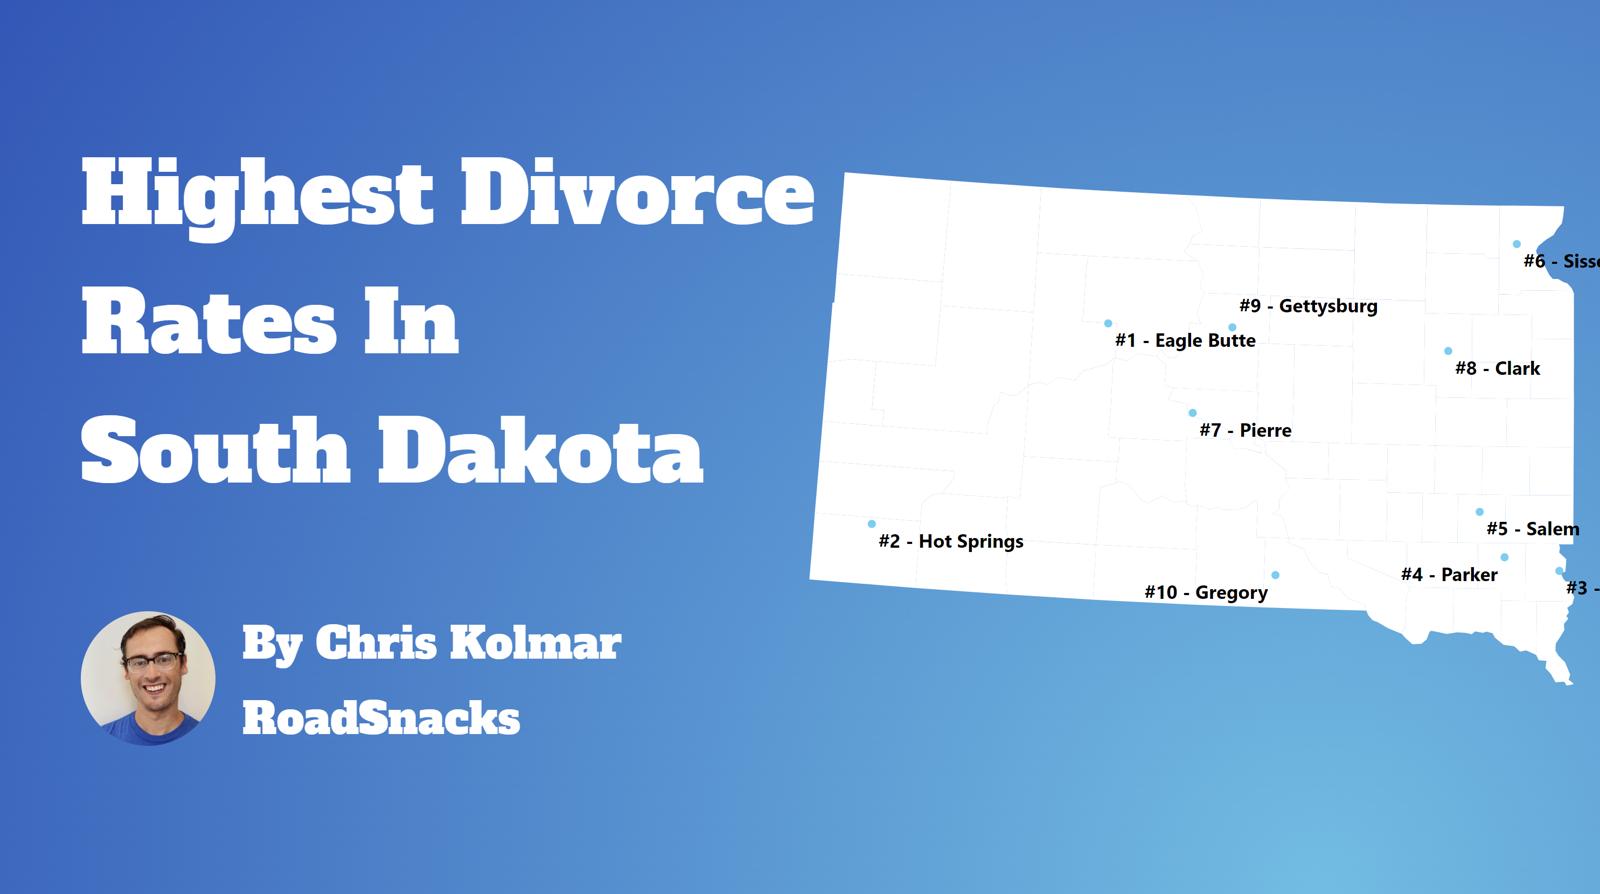
Table Of Contents: Top Ten | Methodology | Summary | Table
There are some 43,161 people living in South Dakota over fifteen years of age who are divorced. You can compare that to the 28,339,199 Americans who are currently divorced in 2025.
Many people decide to run away – or split up – across the Mount Rushmore State.
Isn’t the divorce rate in America close to 50%? Yes indeed. But we’re measuring something else; we are looking at counts and percentages of people over 15 years old who are currently divorced. That 50% statistic is for the percentage of people who have ever been divorced.
For today’s analysis, the focus will be on the number of currently divorced people.
So now that we have you biting your nails, rethinking your worldview, and pulling out your hair, let’s look at the places in South Dakota with the highest rates of divorcees.
The 10 Cities In South Dakota With The Highest Divorce Rates
Let’s quickly recap before we dive into the Saturday Night Science behind the data.
What is the city in South Dakota with the highest divorce rate? That would be Hot Springs, with 14.0% of people over 15 years of age being divorced, per the most recent census data.
What is the overall South Dakota divorce rate? According to the 2019-2023 Community Survey, the overall divorce rate in South Dakota is 6.0%, which compares to the US divorce rate of 10.9%.
Alrighty, on to how we calculated the places with the highest divorce rates in South Dakota.
For more South Dakota reading, check out:
- Most Dangerous Cities In South Dakota
- Richest Cities In South Dakota
- Worst Places To Live In South Dakota
The 10 Places With The Highest Divorce Rate In South Dakota For 2025
1. Hot Springs
/10
Population: 3,506
Divorce Rate: 14.0%
Divorcees: 392
Median Income: $49,688
More on Hot Springs:
2. Eagle Butte
/10
Population: 1,492
Divorce Rate: 14.0%
Divorcees: 167
Median Income: $53,558
More on Eagle Butte:
3. Clark
/10
Population: 1,181
Divorce Rate: 14.0%
Divorcees: 132
Median Income: $49,464
More on Clark:
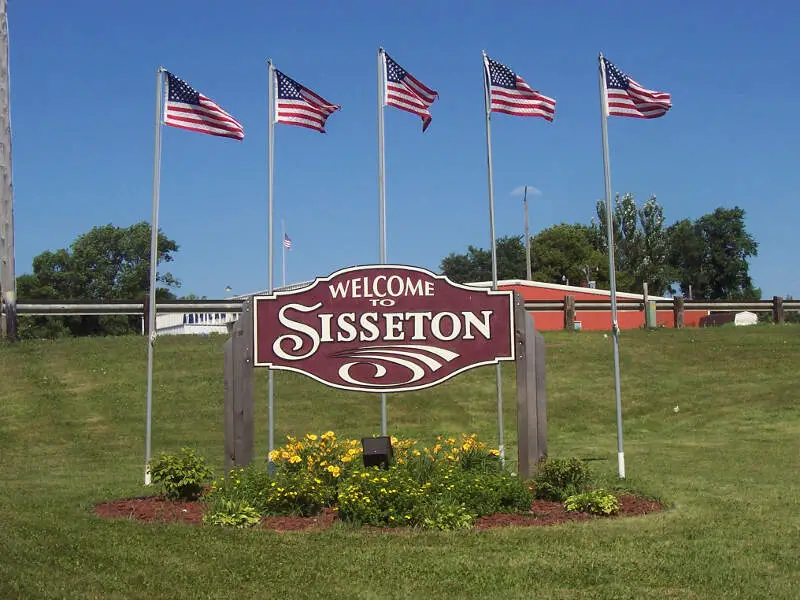
4. Sisseton
/10
Population: 2,593
Divorce Rate: 13.0%
Divorcees: 269
Median Income: $44,477
More on Sisseton:
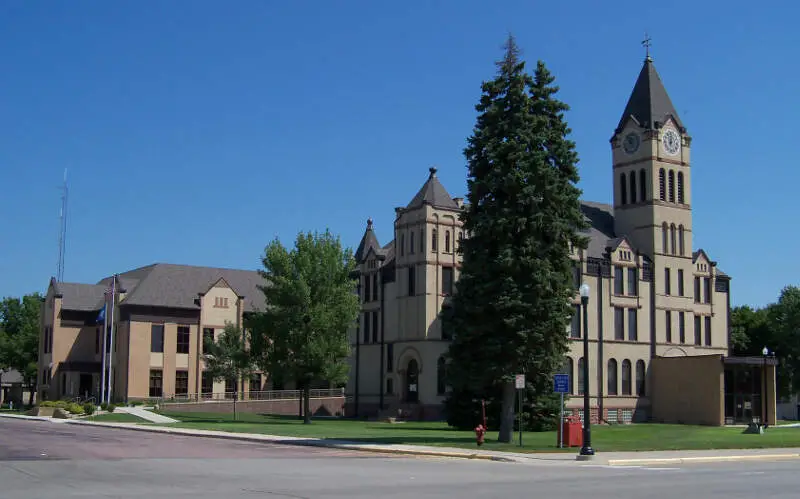
5. Canton
/10
Population: 3,060
Divorce Rate: 13.0%
Divorcees: 318
Median Income: $65,500
More on Canton:
6. Parker
Population: 1,247
Divorce Rate: 12.0%
Divorcees: 119
Median Income: $87,632
More on Parker:
7. Parkston
/10
Population: 1,981
Divorce Rate: 12.0%
Divorcees: 190
Median Income: $71,313
More on Parkston:
8. Chamberlain
/10
Population: 2,621
Divorce Rate: 10.0%
Divorcees: 209
Median Income: $75,000
More on Chamberlain:
9. Salem
/10
Population: 1,201
Divorce Rate: 10.0%
Divorcees: 96
Median Income: $71,655
More on Salem:

/10
Population: 14,008
Divorce Rate: 10.0%
Divorcees: 1,120
Median Income: $74,053
More on Pierre: Data
How We Determined The Places In South Dakota That Get Un-Hitched The Most
Since this is the 58th category of rankings we are compiling for the site, we had a pretty good idea of where to find data on marriage and divorce in America. We used Saturday Night Science to look at the U.S. Census Bureau on divorce rates. Because who likes tracking misery more than the U.S. government?
Specifically, we looked at the 2019-2023 American Community Survey table S1201 — Marital Status.
Pretty straightforward on that front — we just had to extract the following column of data:
- Population 15 Years and Over -> Divorced
There are some interesting/fun/sad data like .1% of female Americans aged 15-19 are divorced, but 0% of males (That’s probably a rounding issue, but still).
But the national data is for another day. Today, the analysis focuses on the 67 places in South Dakota with a population of over 1,000.
We ranked each place by the percentage of divorcees over 15 years of age from highest to lowest. We crowned the divorce capital of South Dakota the place with the highest incidence of divorcees, Hot Springs.
And if you’re trying to avoid divorce, check out North Sioux City, the city with the lowest divorce rate in South Dakota.
We updated this article for 2025 and this list is our fifth time ranking the cities in South Dakota with the highest divorce rates.
Getting Some Closure In South Dakota After Untying The Know
Besides just coming up with what we thought would be a great new blog/book title, “Untying the Knot In South Dakota: Life After Divorce,” we now have a sense of what places in the Mount Rushmore State don’t pay much attention to the whole “’til death do we part” phrase.
The cities with the highest divorce rate in South Dakota are Hot Springs, Eagle Butte, Clark, Sisseton, Canton, Parker, Parkston, Chamberlain, Salem, and Pierre.
Try to keep in mind that the reason cities rank where they do in South Dakota could be because of the age, education, and income distribution, as all of those things impact the rate of divorce.
And that’s probably for the best. Getting out of a toxic relationship is much better than staying in it.
Just make sure you have your running shoes ready to go.
For more South Dakota reading, check out:
- Most Dangerous Cities In South Dakota
- Richest Cities In South Dakota
- Worst Places To Live In South Dakota
Cities With The Highest Divorce Rates In South Dakota
| Rank | City | Population | Divorcees | Divorce Rate |
|---|---|---|---|---|
| 1 | Hot Springs, SD | 3,506 | 392 | 14.0% |
| 2 | Eagle Butte, SD | 1,492 | 167 | 14.0% |
| 3 | Clark, SD | 1,181 | 132 | 14.0% |
| 4 | Sisseton, SD | 2,593 | 269 | 13.0% |
| 5 | Canton, SD | 3,060 | 318 | 13.0% |
| 6 | Parker, SD | 1,247 | 119 | 12.0% |
| 7 | Parkston, SD | 1,981 | 190 | 12.0% |
| 8 | Chamberlain, SD | 2,621 | 209 | 10.0% |
| 9 | Salem, SD | 1,201 | 96 | 10.0% |
| 10 | Pierre, SD | 14,008 | 1,120 | 10.0% |
| 11 | Miller, SD | 1,346 | 107 | 10.0% |
| 12 | Gettysburg, SD | 1,344 | 96 | 9.0% |
| 13 | Colman, SD | 1,011 | 72 | 9.0% |
| 14 | Lennox, SD | 2,587 | 186 | 9.0% |
| 15 | Ipswich, SD | 1,126 | 81 | 9.0% |
| 16 | Webster, SD | 1,823 | 131 | 9.0% |
| 17 | Redfield, SD | 2,230 | 160 | 9.0% |
| 18 | Tyndall, SD | 1,206 | 86 | 9.0% |
| 19 | Wagner, SD | 1,555 | 99 | 8.0% |
| 20 | Crooks, SD | 1,216 | 77 | 8.0% |
| 21 | Rapid City, SD | 76,836 | 4,917 | 8.0% |
| 22 | Deadwood, SD | 1,319 | 84 | 8.0% |
| 23 | Flandreau, SD | 2,291 | 146 | 8.0% |
| 24 | Springfield, SD | 2,073 | 132 | 8.0% |
| 25 | Mission, SD | 1,380 | 77 | 7.0% |
| 26 | Huron, SD | 14,347 | 803 | 7.0% |
| 27 | Aberdeen, SD | 28,297 | 1,584 | 7.0% |
| 28 | Gregory, SD | 1,330 | 74 | 7.0% |
| 29 | Watertown, SD | 22,859 | 1,280 | 7.0% |
| 30 | Brandon, SD | 10,996 | 615 | 7.0% |
| 31 | Groton, SD | 1,794 | 100 | 7.0% |
| 32 | Sturgis, SD | 7,111 | 398 | 7.0% |
| 33 | Fort Pierre, SD | 2,534 | 141 | 7.0% |
| 34 | Mobridge, SD | 2,928 | 163 | 7.0% |
| 35 | Freeman, SD | 1,558 | 87 | 7.0% |
| 36 | Worthing, SD | 1,087 | 52 | 6.0% |
| 37 | Sioux Falls, SD | 197,642 | 9,486 | 6.0% |
| 38 | Marion, SD | 1,004 | 48 | 6.0% |
| 39 | Belle Fourche, SD | 5,741 | 275 | 6.0% |
| 40 | Garretson, SD | 1,166 | 55 | 6.0% |
| 41 | Mitchell, SD | 15,637 | 750 | 6.0% |
| 42 | Madison, SD | 6,158 | 295 | 6.0% |
| 43 | Summerset, SD | 2,978 | 119 | 5.0% |
| 44 | Spearfish, SD | 12,551 | 502 | 5.0% |
| 45 | Lemmon, SD | 1,214 | 48 | 5.0% |
| 46 | Yankton, SD | 15,501 | 620 | 5.0% |
| 47 | Baltic, SD | 1,512 | 60 | 5.0% |
| 48 | Harrisburg, SD | 7,790 | 311 | 5.0% |
| 49 | Britton, SD | 1,117 | 44 | 5.0% |
| 50 | Custer, SD | 2,148 | 85 | 5.0% |
| 51 | Winner, SD | 2,900 | 92 | 4.0% |
| 52 | Volga, SD | 2,246 | 71 | 4.0% |
| 53 | Box Elder, SD | 12,457 | 398 | 4.0% |
| 54 | Tea, SD | 6,339 | 202 | 4.0% |
| 55 | Brookings, SD | 23,710 | 758 | 4.0% |
| 56 | Dell Rapids, SD | 3,947 | 126 | 4.0% |
| 57 | Hartford, SD | 3,412 | 109 | 4.0% |
| 58 | Lead, SD | 2,997 | 95 | 4.0% |
| 59 | Platte, SD | 1,310 | 41 | 4.0% |
| 60 | Clear Lake, SD | 1,333 | 42 | 4.0% |
| 61 | Elk Point, SD | 2,391 | 57 | 3.0% |
| 62 | Vermillion, SD | 11,800 | 283 | 3.0% |
| 63 | Beresford, SD | 2,437 | 58 | 3.0% |
| 64 | Martin, SD | 1,054 | 25 | 3.0% |
| 65 | Milbank, SD | 3,513 | 84 | 3.0% |
| 66 | Aurora, SD | 1,407 | 22 | 2.0% |
| 67 | North Sioux City, SD | 3,018 | 0 | 0.0% |