
Most dangerous cities in Oregon research summary. We analyzed the most recent FBI crime data using Saturday Night Science to determine the most dangerous cities in Oregon.
We examined the violent and property crime per capita statistics for every place with over 5,000 residents. In total, we analyzed 71 Oregon cities. Here are the results of our analysis:
-
The most dangerous city in Oregon is Ontario based on the most recent FBI crime data.
-
The violent crime rate in Oregon is 842 per 100k people.
-
The property crime rate in Oregon is 6,006 per 100k people.
-
The safest city in Oregon is King City.
-
Oregon is the 2most dangerous state in the United States.
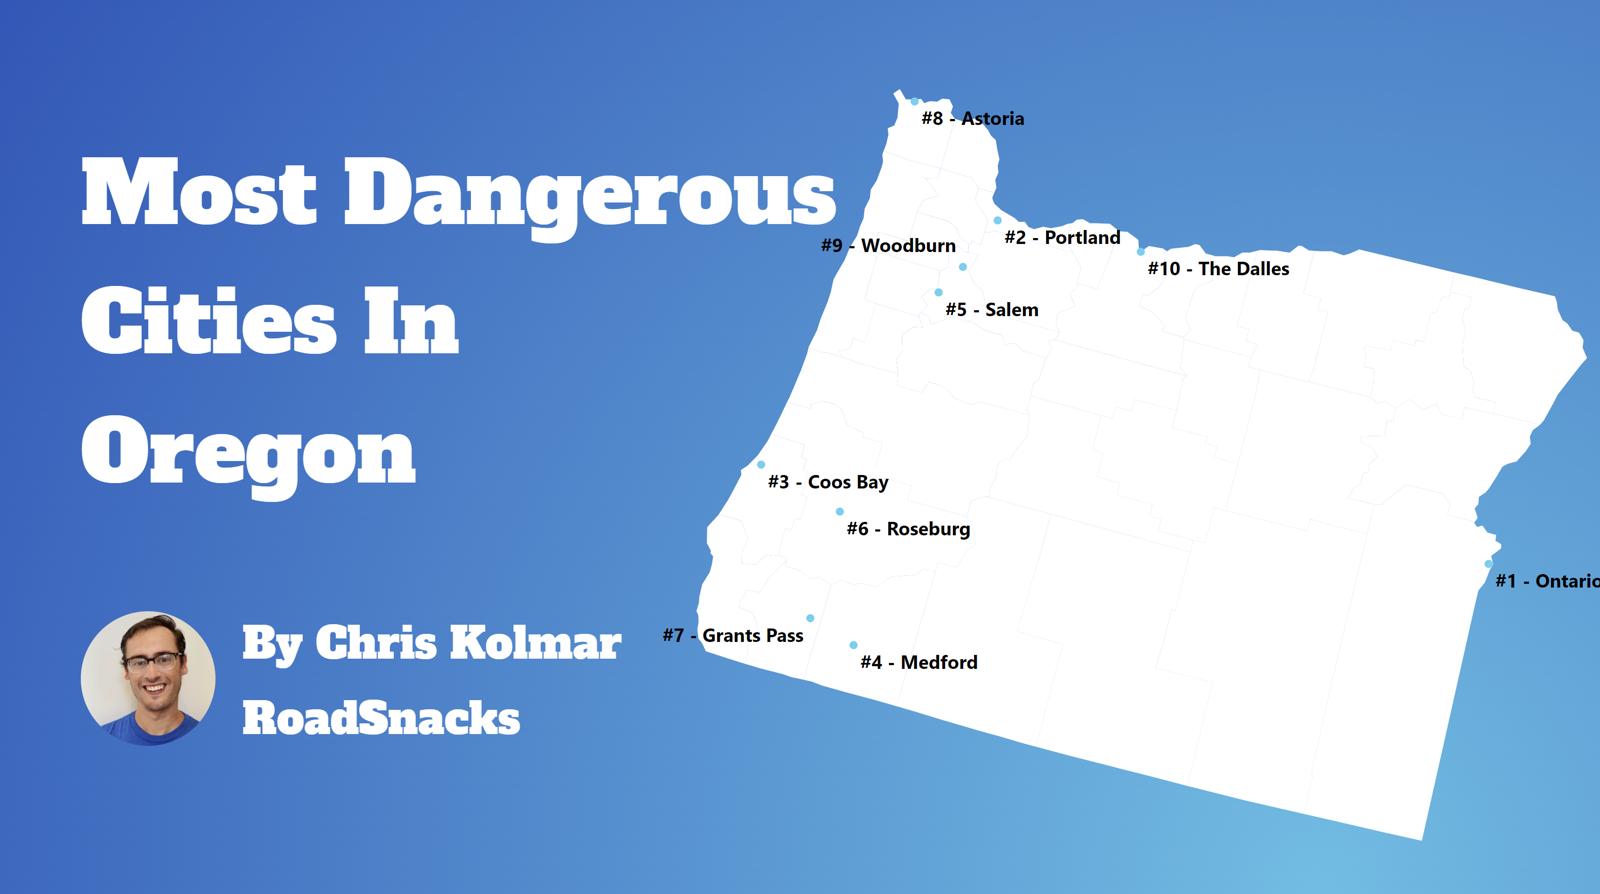
Table Of Contents: Top Ten | Table | Methodology | FAQs | References
Do you think that you live in one of the most dangerous cities in Oregon? Before you lock your doors and grab your taser, we suggest you look at our report of the most dangerous places in Oregon for 2024.
We consulted the FBI’s latest crime report for violent and property crime statistics to determine where crime rates are high in Oregon. We analyzed 71 cities with over 5,000 residents. We discovered that Oregon’s most dangerous cities’ violent and property crime numbers, while not the worst in the country, could be better.
And while Oregon might not be one of the top ten most dangerous states in the country, the state’s most dangerous places do need some work.
The Most Dangerous Cities In Oregon For 2024
Where is Oregon’s most dangerous place? The most dangerous place in Oregon is Ontario.
The state’s crime problems are centralized around most of Oregon’s largest cities, Portland and Salem. Oregon’s biggest cities can’t catch a break.
For more Oregon reading, check out:
- Most dangerous cities in the US
- Best Places To Live In Oregon
- Cheapest Places To Live In Oregon
- Best Places To Raise A Family In Oregon
The 10 Most Dangerous Places To Live In Oregon For 2024

/10
Population: 11,638
Violent Crimes Per 100k: 842 (Most dangerous)
Property Crimes Per 100k: 6,006 (Second most dangerous)
Murders: 0
More on Ontario: Data | Crime | Cost Of Living
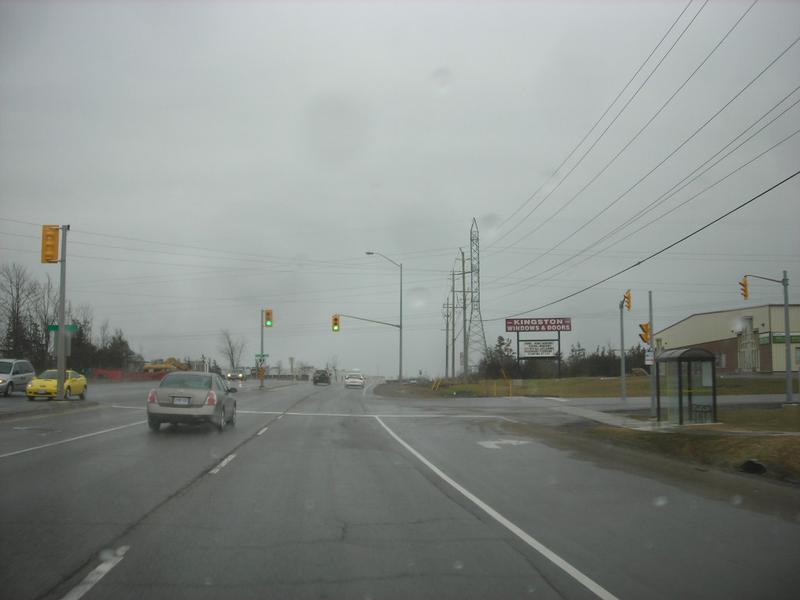
Located along Snake River on the border of Idaho, Ontario ranks as the most dangerous city in Oregon.
Ontario saw a increase in violent crime and a increase in property crime for last couple of years, which explains why it moved several spots on the list for 2024.
Ontario residents had a 1 in 118 chance of being the victim of a violent crime and a 1 in 16 chance of having their stuff stolen or vandalized over 2022.
Included in those numbers is the 47th highest murder rate, second highest rate of rape cases, and fourth highest rate of burglaries in Oregon.

/10
Population: 630,129
Violent Crimes Per 100k: 751 (Second most dangerous)
Property Crimes Per 100k: 6,324 (Most dangerous)
Murders: 94
More on Portland: Data | Crime | Cost Of Living
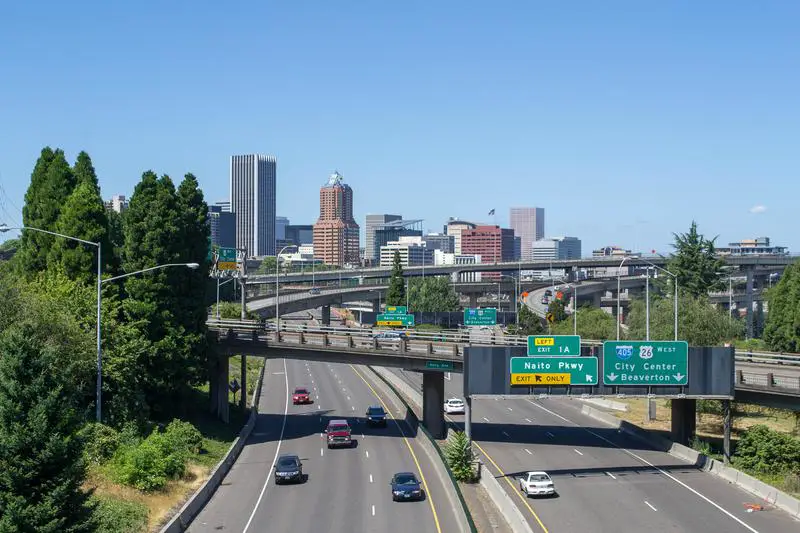
We all know Portland has a lot of avant-garde hipsters and various disciples of American counter-culture, but the biggest city in Oregon also has the second worst crime numbers in the state.
With all the gardens and parks around, you might think Portland’s a peaceful place, but anyone who watches the news knows otherwise.
Portland is the second most violent place in Oregon, with about ten violent crimes going down each day, on average. Property crime isn’t much better, considering the 10,856 stolen cars and 4,790 burglaries recorded in 2022.
All of which is definitely not cool.

/10
Population: 15,871
Violent Crimes Per 100k: 617 (Third most dangerous)
Property Crimes Per 100k: 5,847 (Third most dangerous)
Murders: 1
More on Coos Bay: Data | Crime | Cost Of Living
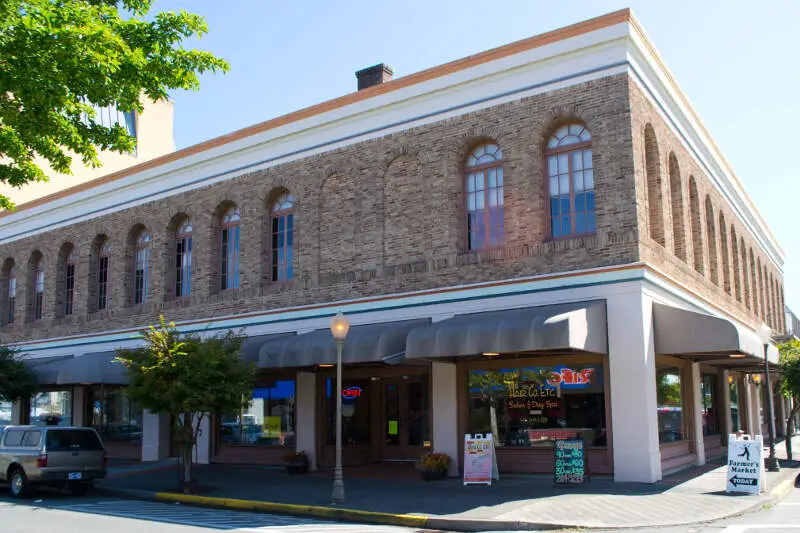
Another coastal city, Coos Bay also saw a spike in crime over the past year. The city ranked as the third highest worst in both violent and property crime rates, with some alarming numbers in each category.
Like having the fourth highest rate of rape cases in Oregon by a pretty significant margin. And recording a burglary about every other day, on average, which is enough for the highest burglary rate statewide as well.
At least residents can find a bit of sanctuary at Shore Acres State Park — just bring a friend if you think you’ll be out after dark.


/10
Population: 86,876
Violent Crimes Per 100k: 371 (14th most dangerous)
Property Crimes Per 100k: 4,104 (Seventh most dangerous)
Murders: 2
More on Medford: Data | Crime | Cost Of Living
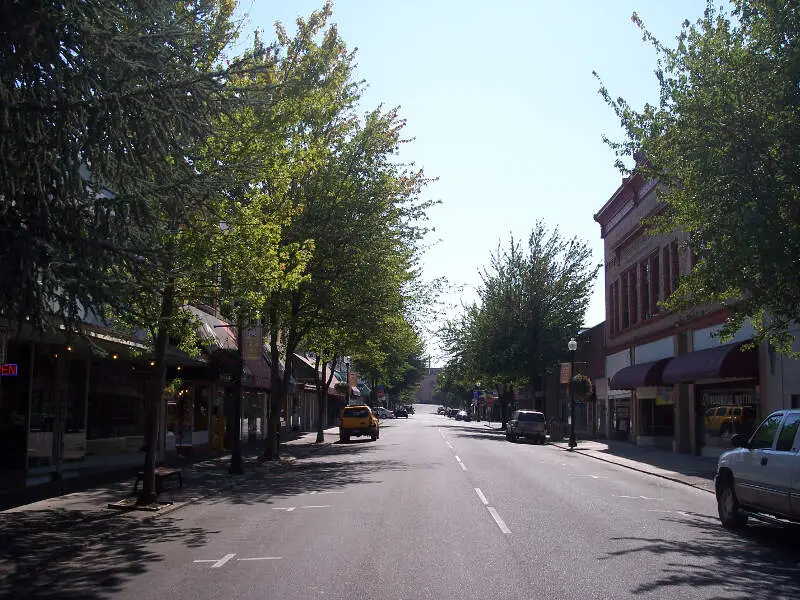
Medford gets its name from a town in Massachusetts, located about 3,000 miles across the country. Built in the southern part of the state, near the California border, this Medford sits along I-5 — the main north-south artery through the state.
The city has always been something of a stopover. It was originally a railroad town. Maybe some of that history lingers on — at least the part related to railroad bandits. The residents endure a surprisingly high crime rate, including large numbers of larcenies and robberies.


/10
Population: 179,661
Violent Crimes Per 100k: 482 (Fifth most dangerous)
Property Crimes Per 100k: 3,621 (17th most dangerous)
Murders: 7
More on Salem: Data | Crime | Cost Of Living
Turns out that Oregon’s capital city is also the fifth most dangerous place in the state.
Salem might be one place where wearing a wallet chain is actually a good idea, seeing as there were 4,568 larcenies in 2022. And while violent crime has been decreasing in Salem, property crime went up from last year.
Still, watch your back in any poorly lit areas of Salem’s parks of night — it’s still the fifth most violent place in Oregon, after all.

/10
Population: 23,973
Violent Crimes Per 100k: 354 (19th most dangerous)
Property Crimes Per 100k: 4,747 (Fifth most dangerous)
Murders: 0
More on Roseburg: Data | Crime | Cost Of Living
Located about an hour south of Eugene, Roseburg ranks as Oregon’s sixth most dangerous place to call home. Despite Roseburg’s #6 position on this list, it actually has the fifth highest overall crime rate in Oregon.
How’s that happen? Well, when property crime is such that 1 in 21 residents is the victim of a theft or vandalization over the course of a year, it inflates your overall crime numbers.
And it’s not like it’s just a few picked pockets and broken windows going down in Roseburg either. The city also reported the fifth highest rate of rape cases in Oregon.

/10
Population: 39,519
Violent Crimes Per 100k: 369 (15th most dangerous)
Property Crimes Per 100k: 3,955 (Ninth most dangerous)
Murders: 1
More on Grants Pass: Data | Crime | Cost Of Living
Grants Pass, the county seat of Josephine County in Oregon, is notably becoming one of the state’s most dangerous cities. Located northwest of Medford along the Rogue River, this city, with a population of 39,519, is experiencing an alarming rise in crime rates. Grants Pass recorded 146 violent crimes, putting it on the 15th highest position for violent crime in Oregon.

/10
Population: 10,448
Violent Crimes Per 100k: 449 (Sixth most dangerous)
Property Crimes Per 100k: 3,302 (21st most dangerous)
Murders: 0
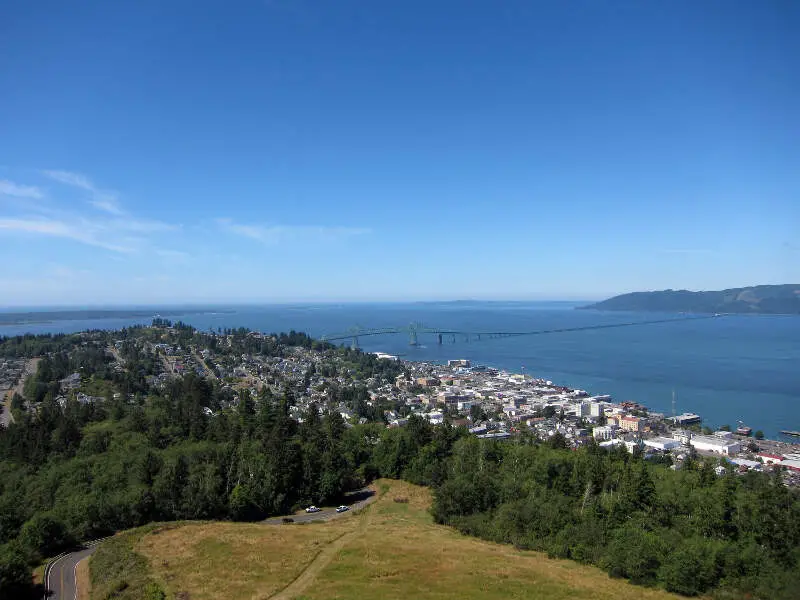
More on Astoria: Data | Crime | Cost Of Living
Welcome to Astoria, Oregon’s hub of violent crime. A port city located just east of Warrenton, Astoria recorded the sixth highest violent crime rate in Oregon for data year 2022.
Residents had a 1 in 222 shot of being the victim of a violent attack. So look out for criminals when you’re moseying down the Astoria Riverwalk, or you could join that unfortunate group.
Astoria also had the highest rate of rape cases and 11th highest burglary rate statewide — not statistics you want to be associated with your city.

/10
Population: 26,117
Violent Crimes Per 100k: 382 (Tenth most dangerous)
Property Crimes Per 100k: 3,595 (18th most dangerous)
Murders: 0
More on Woodburn: Data | Crime | Cost Of Living
Located between Portland and Salem, Woodburn is slightly safer than either of the big cities. While property crime in Woodburn stayed steady from last year, violent crime fell a bit. At this rate, Woodburn may be off this list by next year.
Still, folks had a 1 in 27 chance of being the victim of a property crime over 2022, so that’s not great.
At least Woodburn residents get to enjoy the local Tulip Festival every year. Just be careful nobody snatches your flowers.

/10
Population: 16,100
Violent Crimes Per 100k: 360 (17th most dangerous)
Property Crimes Per 100k: 3,788 (13th most dangerous)
Murders: 0
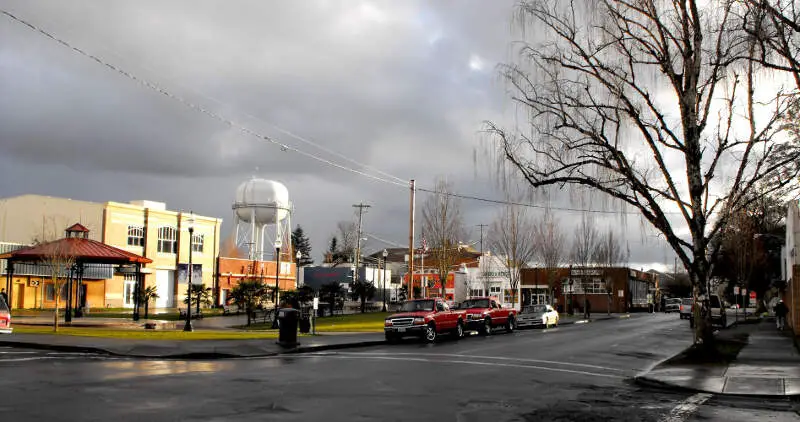
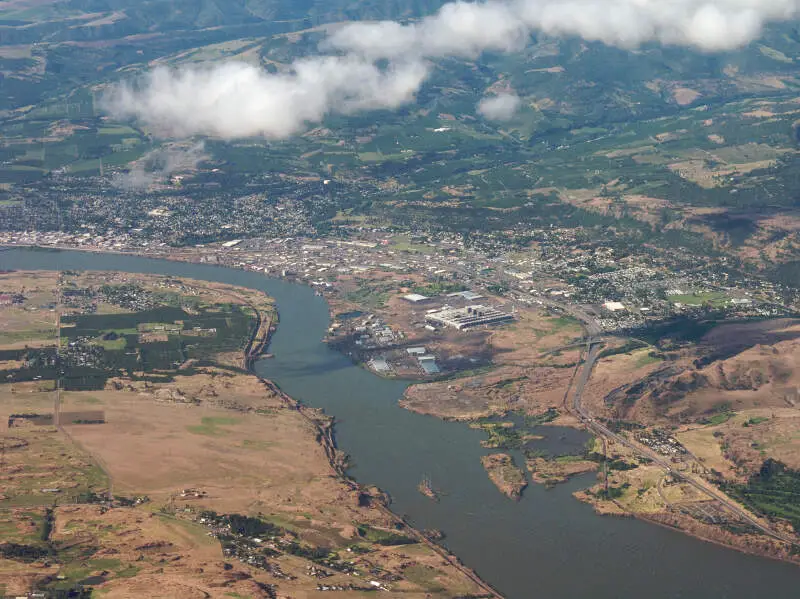
More on The Dalles: Data | Crime | Cost Of Living
Located in Wasco County, Oregon, The Dalles is the largest city outside the Portland Metropolitan Area along the Columbia River. With a population of 16,100, this inland port has been a trading center for Native Americans as long as 10,000 years ago. However, it has recently been ranked the tenth most dangerous place to live in the state for the year 2024.
The city recorded 58 violent crimes, which include 5 rapes, 19 robberies, and 34 aggravated assaults. Although the city reported no murders, the property crime total stands at a staggering 610, making The Dalles have the 17th highest violent crime rate and 13 in property crime rank in Oregon.
Crime By City In Oregon
| Rank | City | Population | Total Crimes Per 100K | Violent Crimes Per 100K | Property Crimes Per 100K | Murders |
|---|---|---|---|---|---|---|
| 1 | Ontario | 11,638 | 6,848 | 842 | 6,006 | 0 |
| 2 | Portland | 630,129 | 7,075 | 751 | 6,324 | 94 |
| 3 | Coos Bay | 15,871 | 6,464 | 617 | 5,847 | 1 |
| 4 | Medford | 86,876 | 4,476 | 371 | 4,104 | 2 |
| 5 | Salem | 179,661 | 4,103 | 482 | 3,621 | 7 |
| 6 | Roseburg | 23,973 | 5,101 | 354 | 4,747 | 0 |
| 7 | Grants Pass | 39,519 | 4,324 | 369 | 3,955 | 1 |
| 8 | Astoria | 10,448 | 3,751 | 449 | 3,302 | 0 |
| 9 | Woodburn | 26,117 | 3,978 | 382 | 3,595 | 0 |
| 10 | The Dalles | 16,100 | 4,149 | 360 | 3,788 | 0 |
| 11 | Gresham | 111,590 | 3,380 | 434 | 2,945 | 10 |
| 12 | Eugene | 175,390 | 3,792 | 377 | 3,414 | 3 |
| 13 | Warrenton | 6,537 | 6,103 | 290 | 5,813 | 0 |
| 14 | Tigard | 56,550 | 4,035 | 357 | 3,678 | 3 |
| 15 | Klamath Falls | 23,078 | 3,093 | 511 | 2,582 | 0 |
| 16 | Newport | 10,667 | 3,309 | 374 | 2,934 | 0 |
| 17 | Springfield | 62,217 | 3,603 | 323 | 3,280 | 4 |
| 18 | Tualatin | 27,195 | 4,202 | 261 | 3,941 | 0 |
| 19 | Lincoln City | 10,110 | 2,818 | 375 | 2,443 | 2 |
| 20 | Pendleton | 16,780 | 4,082 | 250 | 3,831 | 0 |
| 21 | Hermiston | 19,438 | 3,405 | 293 | 3,112 | 0 |
| 22 | Milton-Freewater | 7,119 | 2,584 | 421 | 2,163 | 0 |
| 23 | Cornelius | 14,107 | 2,537 | 432 | 2,105 | 1 |
| 24 | Beaverton | 98,991 | 3,040 | 306 | 2,734 | 3 |
| 25 | Sweet Home | 10,055 | 3,948 | 218 | 3,729 | 0 |
| 26 | Oregon City | 37,192 | 2,581 | 365 | 2,215 | 0 |
| 27 | Hillsboro | 106,345 | 2,863 | 296 | 2,567 | 4 |
| 28 | Tillamook | 5,314 | 3,726 | 225 | 3,500 | 0 |
| 29 | Corvallis | 60,031 | 3,866 | 206 | 3,659 | 0 |
| 30 | McMinnville | 34,912 | 2,597 | 297 | 2,300 | 0 |
| 31 | La Grande | 13,174 | 2,755 | 280 | 2,474 | 0 |
| 32 | Madras | 7,140 | 4,243 | 140 | 4,103 | 0 |
| 33 | Seaside | 6,938 | 2,320 | 331 | 1,989 | 0 |
| 34 | Forest Grove | 26,016 | 2,202 | 342 | 1,860 | 1 |
| 35 | North Bend | 10,256 | 4,231 | 126 | 4,104 | 0 |
| 36 | Gladstone | 11,946 | 3,047 | 200 | 2,846 | 0 |
| 37 | Sutherlin | 8,662 | 2,562 | 277 | 2,285 | 0 |
| 38 | Baker City | 10,259 | 2,612 | 263 | 2,349 | 1 |
| 39 | Albany | 57,058 | 2,951 | 187 | 2,763 | 2 |
| 40 | Keizer | 38,958 | 2,764 | 195 | 2,569 | 1 |
| 41 | Stayton | 8,162 | 2,499 | 245 | 2,254 | 0 |
| 42 | Dallas | 17,622 | 2,241 | 278 | 1,963 | 0 |
| 43 | Hood River | 8,396 | 4,001 | 83 | 3,918 | 0 |
| 44 | Brookings | 6,880 | 2,020 | 276 | 1,744 | 1 |
| 45 | Sherwood | 20,102 | 2,422 | 198 | 2,223 | 0 |
| 46 | Ashland | 21,797 | 2,601 | 165 | 2,436 | 0 |
| 47 | Florence | 9,514 | 2,879 | 136 | 2,743 | 1 |
| 48 | Redmond | 37,472 | 2,303 | 165 | 2,137 | 0 |
| 49 | St. Helens | 14,356 | 1,421 | 278 | 1,142 | 0 |
| 50 | Cottage Grove | 10,622 | 1,233 | 291 | 941 | 0 |
Methodology: How we determined the most dangerous cities in Oregon for 2024?
Every year the FBI release two crime datasets on cities in Oregon. First a preliminary dataset limited to the biggest cities in Oregon, followed by a more detailed release at the end of the year.
For our analysis, we focused on the 2022 data, specifically the 2022 Crime In The United States Report for Oregon.
So what criteria did we use? Have a look:
- Violent Crimes Per Capita
- Property Crimes Per Capita
In order to make the analysis as apples to apples as possible, we only considered Oregon cities over 5,000 in population. That left us with 71 cities in Oregon.
We then ranked each city from 1 to 71 for the two criteria with a #1 ranking being the most dangerous for the particular criteria.
Next, we averaged the two rankings into one “Dangerous Index”.
Finally, we ranked every city on the “Dangerous Index” with the lowest index being the most dangerous in Oregon — Ontario. Any ties went to the smaller city.
This article is an opinion based on facts and is meant as infotainment. It is our tenth time ranking the most dangerous places to live in Oregon and is updated for 2024.
Most Dangerous Places To Live In Oregon FAQs
No, Oregon is not a dangerous state as it ranks as the #30 safest state in the United States based on our analysis of the latest FBI Crime Data. The violent crime rate in Oregon ranks 36th most dangerous in the United States — 21.07% better than US average violent crime rate. The property crime rate in the Beaver State ranks seventh most dangerous in the United States — 36.05% worse than US average property crime rate. The latest reporting year from the FBI was 2022.
Yes, Portland is a dangerous city. Portland ranks as the #9 most dangerous out of 328 major cities over 100,000 people in the United States based on our analysis of the latest FBI Crime Data. Keep in mind that are always safe and dangerous parts of any city, so even though Portland might be considered dangerous you still need to be aware of where you are. For example, Alameda is the safest in Portland, while Sunderland is considered dangerous by many based on recent crime stats.
Compared to other big cities, the violent crime rate in Portland ranks 79th highest in America — 35.7% worse than US average violent crime rate. The property crime rate in the ranks eighth highest in the United States — 131.77% worse than US average property crime rate. Note the latest reporting year from the FBI was 2022 and that no city in America is ‘dangerous’. Despite the uptick in murders, it’s nothing like you’d see in Tijuana or Caracas where the murder rate is 2x any American city.
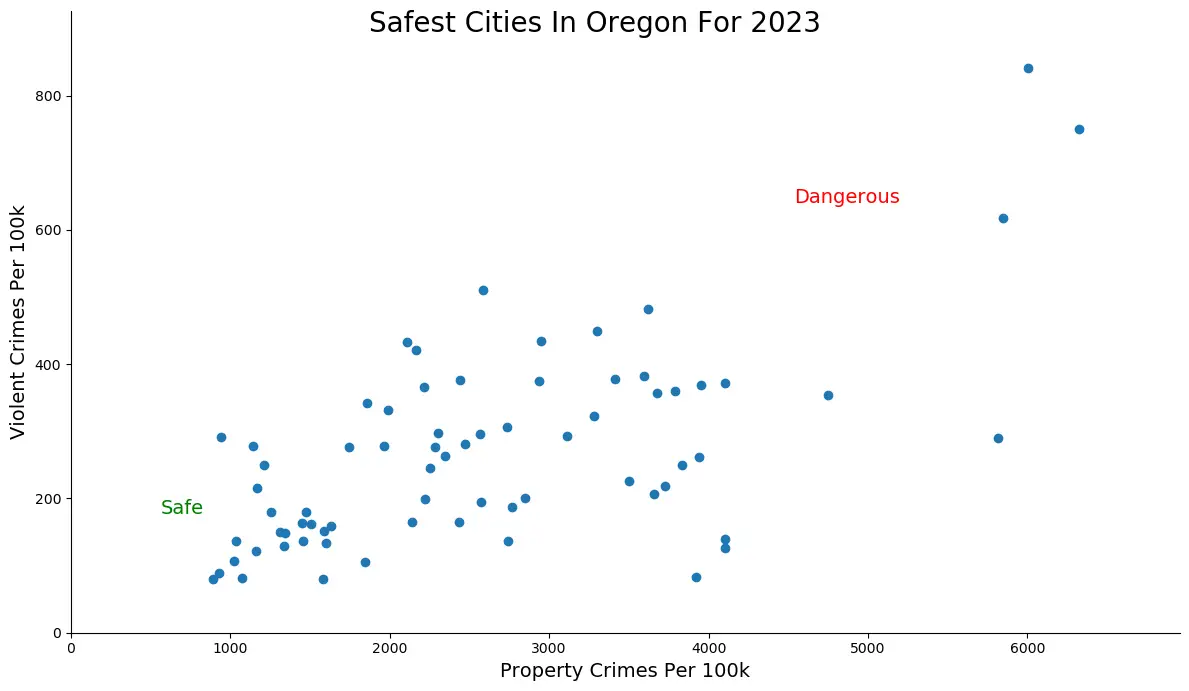
Graphing The Most Dangerous And Safest Places In Oregon
Summary: Locking It All Up In Oregon
So what is the most dangerous city in Oregon? After analyzing 71 cities in Oregon, Ontario takes the top spot as the most dangerous city in Oregon based on the most recently reported FBI data — 2022.
The latest FBI crime data shows that Ontario ranks as the most dangerous city in Oregon for 2024.
The most dangerous cities in Oregon are .
We want to point out again that there’s still safes places in Ontario and that this isn’t a comment on the people that live there. So please don’t beat us up.
Where is Oregon’s most dangerous place? The most dangerous place in Oregon is Ontario.
The state’s crime problems are centralized around most of Oregon’s largest cities, Portland and Salem. Oregon’s biggest cities can’t catch a break.
Learn more about the safest places in Oregon.
If you’re looking for something more national, check out the most dangerous cities in America or the most dangerous states in America.
Here are the safest cities in Oregon:
- Central Point (Pop. 19,670)
- Silverton (Pop. 10,622)
- Milwaukie (Pop. 20,784)
- Lake Oswego (Pop. 40,044)
- Philomath (Pop. 5,881)
- Canby (Pop. 18,101)
- Umatilla (Pop. 7,513)
- West Linn (Pop. 26,842)
- Talent (Pop. 6,767)
- King City (Pop. 5,043)
For more Oregon reading, check out:
- Best Places To Live In Oregon
- Cheapest Places To Live In Oregon
- Best Places To Raise A Family In Oregon
- Safest Places In Oregon
- Worst Places To Live In Oregon
Lincoln city oregon needs to …..take care of our own community meaning there’s too many empty houses here and too many locals living off the bottom wasting their lives I see it every day it is terrible there’s also nothing to offer them one shelter here and people complain like things are getting robbed there is barely any jobs here unless you want to be a maid or work at the casino . I don’t have enough time to do that because I’m too busy cleaning my house …with 7 0thers that get to care for there. I don’t like casinos excuse me !! that’s just my opinion. We need to have some more places by private donations that are here and without judgment to help people get on with a new outlook as you know the rain does depressed people…and so can drinking . we can make it sunny when its raining!! with helping each other email me at 97367br@ gmail.com for more information* Thanks for reading ! Have awesome day!!
Sorry Brandy…NO ONE owes you or others a soft place to land. You make your way the same as we did in 1940 and you don’t rely on the government or the community. You rely on family if you have any and if not you stop with the “poor me” attitude and get up and MOVE……no we didn’t have an Oregon Trail card or WIC or anything free. We worked at any job that was available & made sure our priority was shelter-food & clothing —not wifi, phones & TV or cars. Strap on your adult pants and make it happen
It was stated on the link to Lincoln City (on this site) that Lincoln City is the county seat, of Lincoln County. That would be news to Newport, which has been the county seat since February 20, 1893, and still is.
Lincoln City didn’t exist as a city before March, 1965, when it was incorporated. It is made up of the former strip of towns running along U.S. 101 ( Wecoma Beach, Oceanlake, Delake, Nelscott, Taft, and Cutler City, now considered “neighborhoods” of Lincoln City.)
Someone isn’t doing their research. How are we supposed to believe anything here, when such a stupid “fact” is stated. (That, and the statement that you can “go south from Tillamook” and visit Astoria!)
Lots of junkies in Seaside and Astoria half the town is strung out, and how do they pay for their habits…….with your stuff they steal. But will locking them up help, No only good treatment facilities and treatment plans will help and their D.A doesn’t go from that hes all about locking them up so crime will continue sorry clatsop county thank your D.A.
That’s why there should be working prisons.
If I break into someone’s house and steal their 1000 dollar laptop. Get caught, then go to jail. Serve time, then get released.
This is what happens—-
The victim just lost a 1000 dollar laptop. The victim also gets victimized again by paying for the cops to find me with their tax money. The victim is victimized a third time by now having their tax money go to pay for me to be in jail which is around 100 a day in Oregon. I get released and now am shunned by the state making it nearly impossible for me to become a contributing member of society, which I made a bad choice, but even though I served my time, it will be impossible for me to survive, so I steal or sell drugs again.
If there were working prisons …I would go to prison. I was a mechanic, so am put to work in that field. I have to work to pay off the laptop, the cost of the police to catch me, pay for my time in prison by working It off. Then when I have paid everyone back I get released. I also have a purpose again and now want to be a contributing member of society again and don’t have a felony on my record so can do so.
Great Idea. I think some criminals could be rehabilitated in all ways by feeling positive too.
Helpful information as a new Oregon resident. Some were a surprise like Seaside. Just like Socal. the homeless are getting the beachfront property.
So far, I’m liking where I am, in Oregon City. Near all the freeways so able to get to many nearby cities in 30-40 minutes.
I moved to Medford 15 years ago and what a gem of place to move to coming from a big city of gangs and crime (I thought I found where I would stay forever) Now this town has turned into a heroin and meth users UTOPIA with the courts and probation departments in this city letting these addicts & thieves out of jail right after being arrested to go back out and steal and hurt the law abiding citizens its sick. Since 2008 this city has made being on the wrong side of the law acceptable and now a part of life in this Valley. I am now searching for my next destination to live that doesn’t pander to addicts and thieves. If you have young children or teenagers avoid at any cost moving or transferring to this city.