
Do you live in one of the most miserable places in Iowa?
Only a third of Iowans say they are truly happy. That’s too bad, considering that folks in Iowa don’t really have it too bad in the grand scheme of things.
But, we were curious – which Iowa cities might be the most miserable? We’re about to find out, using Saturday Night Science and data.
After analyzing the 83 largest cities, we sadly present the most miserable cities in the Hawkeye State.
Table Of Contents: Top Ten | Methodology | Summary | Table
The 10 Most Miserable Places In Iowa
Read on below to see how we crunched the numbers and how your town ranked. If you have a smile on your face, you probably don’t live in one of these cities.
Oh, and by the way, Cedar Falls is the happiest place in Iowa.
For more Iowa reading, check out:
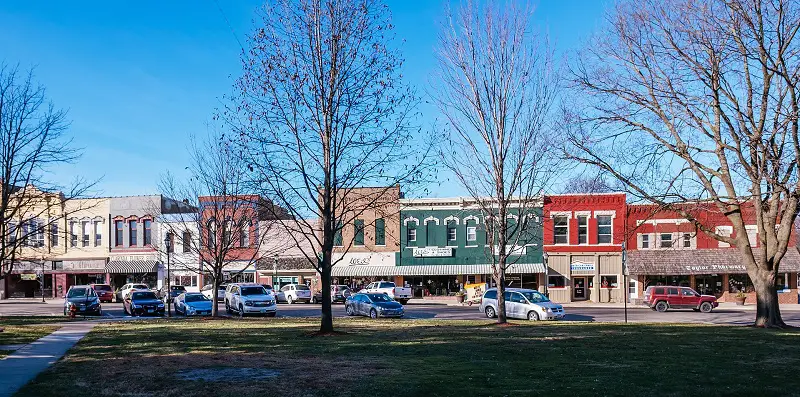
The 10 Most Miserable Places In Iowa For 2023
/10
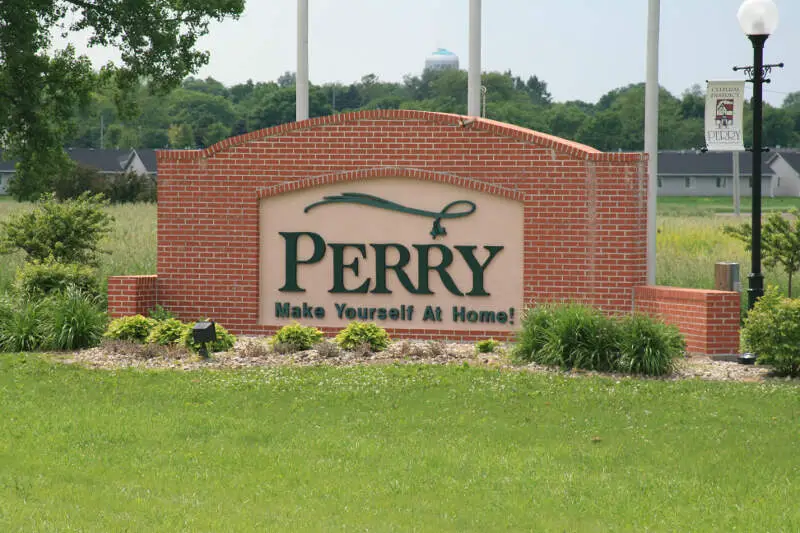
Population: 7,836
Poverty Level: 17.5%
Median Home Price $100,900
Married Households 19.0%
Households With Kids 29.69%
More on Perry: Data | Crime | Cost Of Living
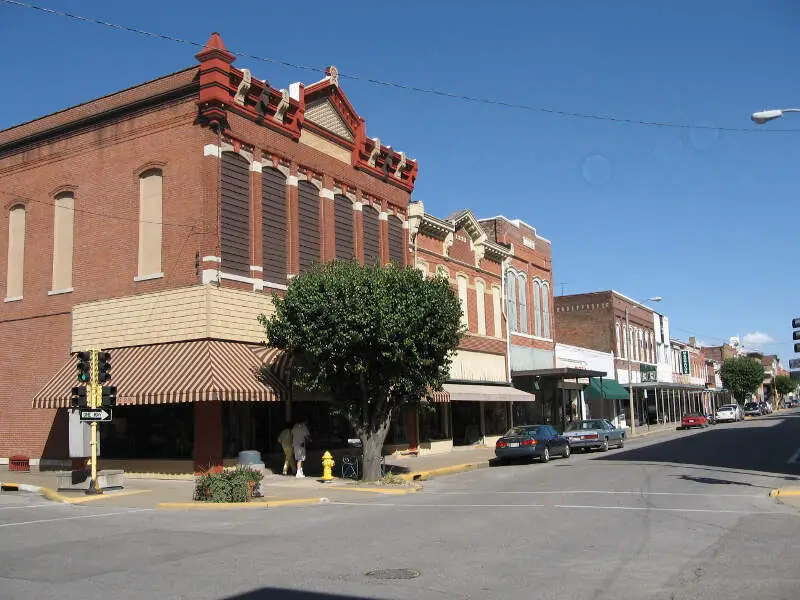
/10
Population: 5,332
Poverty Level: 17.1%
Median Home Price $138,000
Married Households 22.0%
Households With Kids 31.16%
More on Anamosa: Data | Cost Of Living
/10
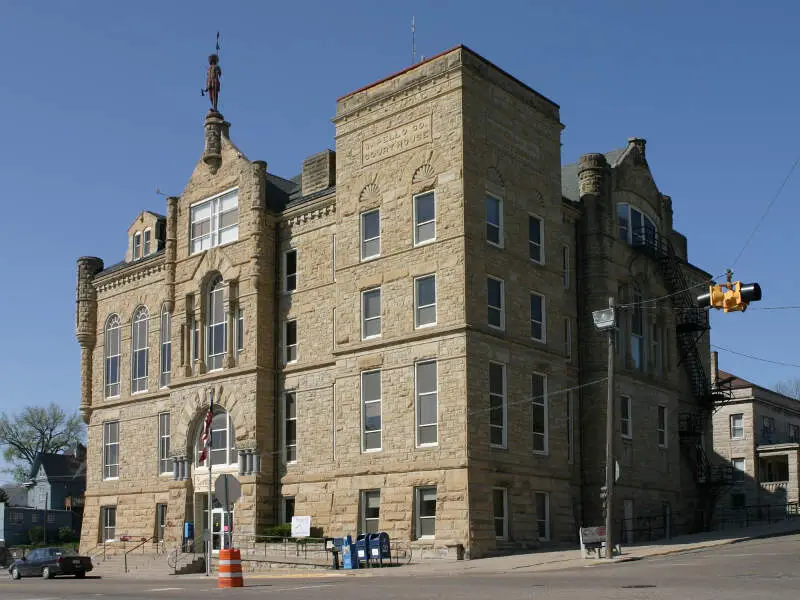
Population: 27,570
Poverty Level: 14.6%
Median Home Price $94,300
Married Households 24.0%
Households With Kids 36.62%
More on Marshalltown: Data | Crime | Cost Of Living
/10
Population: 8,323
Poverty Level: 25.2%
Median Home Price $91,000
Married Households 18.0%
Households With Kids 44.99%
More on Denison: Data | Crime | Cost Of Living
/10
Population: 5,498
Poverty Level: 11.7%
Median Home Price $95,100
Married Households 25.0%
Households With Kids 27.1%
More on Clarinda: Data | Crime | Cost Of Living
/10
Population: 6,123
Poverty Level: 18.9%
Median Home Price $92,800
Married Households 35.0%
Households With Kids 33.22%
More on Maquoketa: Data | Crime | Cost Of Living
/10
Population: 10,340
Poverty Level: 14.9%
Median Home Price $81,400
Married Households 30.0%
Households With Kids 25.93%
More on Fort Madison: Data | Crime | Cost Of Living
/10
Population: 25,379
Poverty Level: 16.0%
Median Home Price $77,000
Married Households 28.0%
Households With Kids 32.13%
More on Ottumwa: Data | Crime | Cost Of Living
/10
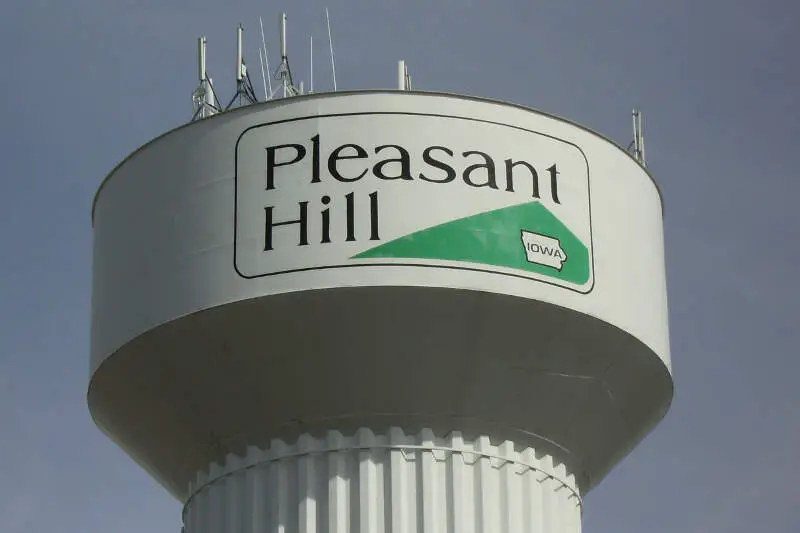
Population: 10,203
Poverty Level: 6.8%
Median Home Price $230,200
Married Households 37.0%
Households With Kids 38.61%
More on Pleasant Hill: Data | Crime | Cost Of Living
/10
Population: 62,617
Poverty Level: 12.7%
Median Home Price $131,000
Married Households 21.0%
Households With Kids 27.2%
More on Council Bluffs: Data | Crime | Cost Of Living
Methodology: How We Measured The Most Miserable Cities In The Hawkeye State
To rank the unhappiest places in Iowa, we had to determine what criteria make people happy. It isn’t a stretch to assume that happy people earn great salaries, are relatively stress-free, and have a stable home life.
So we went to the Census’s American Community Survey 2017-2021 report for the happy criteria, flipped the list with Saturday Night Science, and it spit out the answer.
Like magic.
Here are the criteria we used to measure misery:
- Percentage of residents with a college degree
- Average commute times
- Unemployment rates
- Cost of living
- % of married couples
- % of families with kids
- Poverty rate
After we decided on the criteria, we gathered the data for the 83 places in Iowa with over 5,000 people.
We then ranked each place from one to 83 for each of the seven criteria, with a score of one being the most miserable (Any ties were given to the larger place).
Next, we averaged the seven rankings into a Miserable Index for each place with the lowest overall Miserable Index “earning” the title “Most Miserable City In Iowa.”
If you’d like to see the complete list of states, most miserable to happiest, scroll to the bottom of this post to see the unabridged chart.
We updated this article for 2023, and it’s our tenth time ranking the most miserable cities in Iowa.
There You Have It – The Least Happy Cities In Iowa
As we said earlier, trying to determine the most miserable cities in Iowa is usually a subjective matter.
But if you’re analyzing cities where people are not stable, where you’re stuck in traffic, and no one spent the time to go to college, then this is an accurate list.
If you’re curious enough, here are the happiest cities in Iowa, according to science:
- Cedar Falls
- Atlantic
- Spirit Lake
For more Iowa reading, check out:
- Best Places To Live In Iowa
- Cheapest Places To Live In Iowa
- Most Dangerous Cities In Iowa
- Richest Cities In Iowa
- Safest Places In Iowa
- Worst Places To Live In Iowa
- Most Expensive Places To Live In Iowa
Miserable Cities In Iowa For 2023
| Rank | City | Population | Poverty Level | Median Home Value | % Married | % Kids |
|---|---|---|---|---|---|---|
| 1 | Perry, IA | 7,836 | 17.5% | $100,900 | 19.0% | 29.69% |
| 2 | Anamosa, IA | 5,332 | 17.1% | $138,000 | 22.0% | 31.16% |
| 3 | Marshalltown, IA | 27,570 | 14.6% | $94,300 | 24.0% | 36.62% |
| 4 | Denison, IA | 8,323 | 25.2% | $91,000 | 18.0% | 44.99% |
| 5 | Clarinda, IA | 5,498 | 11.7% | $95,100 | 25.0% | 27.1% |
| 6 | Maquoketa, IA | 6,123 | 18.9% | $92,800 | 35.0% | 33.22% |
| 7 | Fort Madison, IA | 10,340 | 14.9% | $81,400 | 30.0% | 25.93% |
| 8 | Ottumwa, IA | 25,379 | 16.0% | $77,000 | 28.0% | 32.13% |
| 9 | Pleasant Hill, IA | 10,203 | 6.8% | $230,200 | 37.0% | 38.61% |
| 10 | Council Bluffs, IA | 62,617 | 12.7% | $131,000 | 21.0% | 27.2% |
| 11 | Newton, IA | 15,688 | 12.4% | $126,300 | 39.0% | 31.06% |
| 12 | Keokuk, IA | 9,977 | 20.4% | $79,500 | 24.0% | 28.91% |
| 13 | Storm Lake, IA | 11,166 | 11.2% | $141,900 | 16.0% | 31.26% |
| 14 | Sioux City, IA | 85,081 | 14.7% | $130,500 | 24.0% | 34.54% |
| 15 | Muscatine, IA | 23,759 | 15.7% | $114,900 | 28.0% | 35.34% |
| 16 | Altoona, IA | 19,345 | 6.1% | $212,300 | 38.0% | 37.2% |
| 17 | Red Oak, IA | 5,576 | 15.8% | $80,500 | 33.0% | 27.73% |
| 18 | Glenwood, IA | 5,224 | 11.1% | $161,900 | 21.0% | 24.88% |
| 19 | Oelwein, IA | 5,961 | 17.0% | $86,900 | 31.0% | 25.62% |
| 20 | Des Moines, IA | 213,545 | 15.3% | $149,700 | 22.0% | 30.27% |
| 21 | Centerville, IA | 5,353 | 27.4% | $75,200 | 28.0% | 21.81% |
| 22 | Webster City, IA | 7,825 | 10.1% | $89,500 | 33.0% | 27.92% |
| 23 | Osceola, IA | 5,412 | 20.3% | $101,800 | 36.0% | 29.36% |
| 24 | Grimes, IA | 14,842 | 6.8% | $238,600 | 36.0% | 39.56% |
| 25 | Clinton, IA | 24,651 | 17.8% | $103,800 | 27.0% | 25.1% |
| 26 | Waterloo, IA | 67,695 | 16.4% | $122,300 | 28.0% | 28.66% |
| 27 | North Liberty, IA | 19,976 | 4.5% | $252,900 | 29.0% | 46.15% |
| 28 | Indianola, IA | 15,544 | 9.3% | $179,000 | 34.0% | 34.65% |
| 29 | Norwalk, IA | 12,592 | 4.0% | $236,600 | 42.0% | 40.14% |
| 30 | Davenport, IA | 101,725 | 15.8% | $138,000 | 23.0% | 25.5% |
| 31 | Oskaloosa, IA | 11,552 | 19.0% | $99,500 | 31.0% | 31.22% |
| 32 | Bettendorf, IA | 38,631 | 7.2% | $244,300 | 25.0% | 36.31% |
| 33 | Marion, IA | 41,023 | 7.1% | $181,200 | 38.0% | 32.52% |
| 34 | Burlington, IA | 24,160 | 18.0% | $95,300 | 29.0% | 28.27% |
| 35 | Adel, IA | 5,867 | 7.9% | $230,000 | 45.0% | 38.0% |
| 36 | Boone, IA | 12,509 | 6.9% | $118,100 | 37.0% | 31.23% |
| 37 | Knoxville, IA | 7,537 | 12.0% | $106,700 | 40.0% | 30.42% |
| 38 | Estherville, IA | 5,904 | 15.7% | $85,200 | 26.0% | 20.48% |
| 39 | Cedar Rapids, IA | 136,512 | 11.2% | $149,000 | 29.0% | 28.19% |
| 40 | Washington, IA | 7,314 | 11.0% | $125,900 | 31.0% | 27.3% |
| 41 | Bondurant, IA | 7,163 | 6.0% | $235,800 | 35.0% | 57.76% |
| 42 | Polk City, IA | 5,386 | 4.0% | $326,400 | 59.0% | 47.22% |
| 43 | Spencer, IA | 11,292 | 14.5% | $139,100 | 34.0% | 26.58% |
| 44 | Fort Dodge, IA | 24,826 | 18.3% | $100,200 | 25.0% | 23.05% |
| 45 | Winterset, IA | 5,309 | 11.5% | $162,100 | 35.0% | 33.98% |
| 46 | Ankeny, IA | 66,346 | 4.2% | $248,400 | 36.0% | 35.97% |
| 47 | Mount Pleasant, IA | 8,996 | 12.1% | $130,400 | 25.0% | 28.78% |
| 48 | Independence, IA | 6,088 | 10.1% | $133,300 | 40.0% | 30.12% |
| 49 | Creston, IA | 7,594 | 14.7% | $103,400 | 29.0% | 26.66% |
| 50 | Grinnell, IA | 9,481 | 12.5% | $151,000 | 22.0% | 23.1% |
| 51 | Hiawatha, IA | 7,184 | 12.5% | $170,700 | 33.0% | 27.73% |
| 52 | Waukee, IA | 23,441 | 4.8% | $264,400 | 36.0% | 41.41% |
| 53 | Mason City, IA | 27,385 | 10.9% | $114,800 | 36.0% | 23.44% |
| 54 | Urbandale, IA | 45,037 | 5.9% | $260,000 | 36.0% | 37.94% |
| 55 | Charles City, IA | 7,399 | 19.0% | $99,200 | 31.0% | 23.17% |
| 56 | Eldridge, IA | 6,634 | 1.6% | $267,800 | 37.0% | 47.66% |
| 57 | Clive, IA | 18,323 | 3.2% | $309,700 | 34.0% | 35.85% |
| 58 | Fairfield, IA | 9,653 | 16.5% | $106,900 | 16.0% | 23.66% |
| 59 | Nevada, IA | 7,017 | 10.5% | $149,600 | 35.0% | 30.72% |
| 60 | Cherokee, IA | 5,141 | 19.7% | $98,300 | 35.0% | 26.54% |
| 61 | Iowa Falls, IA | 5,154 | 9.3% | $94,900 | 42.0% | 20.08% |
| 62 | Algona, IA | 5,407 | 11.0% | $134,800 | 35.0% | 23.15% |
| 63 | Coralville, IA | 22,226 | 9.6% | $241,200 | 18.0% | 27.55% |
| 64 | West Des Moines, IA | 67,640 | 6.6% | $239,200 | 26.0% | 27.52% |
| 65 | Asbury, IA | 5,795 | 2.9% | $269,000 | 43.0% | 47.84% |
| 66 | Dubuque, IA | 59,379 | 12.3% | $155,700 | 32.0% | 25.73% |
| 67 | Le Mars, IA | 10,462 | 7.7% | $168,400 | 39.0% | 31.91% |
| 68 | Johnston, IA | 23,418 | 9.8% | $289,600 | 33.0% | 36.91% |
| 69 | Waverly, IA | 10,278 | 10.4% | $187,200 | 36.0% | 29.66% |
| 70 | Clear Lake, IA | 7,673 | 6.0% | $191,000 | 39.0% | 20.69% |
| 71 | Windsor Heights, IA | 5,208 | 7.6% | $202,200 | 37.0% | 30.09% |
| 72 | Sioux Center, IA | 8,090 | 5.3% | $233,700 | 33.0% | 37.15% |
| 73 | Carroll, IA | 10,261 | 9.7% | $148,500 | 36.0% | 25.19% |
| 74 | Ames, IA | 65,522 | 26.4% | $222,900 | 14.0% | 16.64% |
| 75 | Decorah, IA | 7,767 | 9.3% | $203,300 | 24.0% | 21.71% |
| 76 | Pella, IA | 10,414 | 2.8% | $215,100 | 37.0% | 30.73% |
| 77 | Iowa City, IA | 74,240 | 26.8% | $230,700 | 16.0% | 18.2% |
| 78 | Orange City, IA | 6,214 | 7.1% | $198,100 | 39.0% | 27.3% |
| 79 | Sheldon, IA | 5,475 | 16.0% | $152,900 | 42.0% | 30.15% |
| 80 | Manchester, IA | 5,077 | 13.1% | $114,100 | 51.0% | 21.53% |
| 81 | Spirit Lake, IA | 5,301 | 8.5% | $169,600 | 33.0% | 21.26% |
| 82 | Atlantic, IA | 6,795 | 18.9% | $122,400 | 31.0% | 24.61% |
| 83 | Cedar Falls, IA | 40,500 | 17.1% | $211,000 | 28.0% | 23.14% |
I was once banished to Dead Groins , Iowa. Survived for two years…. then I fled. Groins at the time (1982) had the highest divorce rate in the U.S. — 53%.
It can only be compared to Russia’s Siberia….