
Do you live in one of the most miserable places in Kansas?
Only a third of Kansans say they are truly happy. That’s too bad, considering that folks in Kansas don’t really have it too bad in the grand scheme of things.
But, we were curious – which Kansas cities might be the most miserable? We’re about to find out, using Saturday Night Science and data.
After analyzing the 62 largest cities, we sadly present the most miserable cities in the Sunflower State.
Table Of Contents: Top Ten | Methodology | Summary | Table
The 10 Most Miserable Places In Kansas
Read on below to see how we crunched the numbers and how your town ranked. If you have a smile on your face, you probably don’t live in one of these cities.
Oh, and by the way, Hays is the happiest place in Kansas.
For more Kansas reading, check out:
The 10 Most Miserable Places In Kansas For 2023
/10
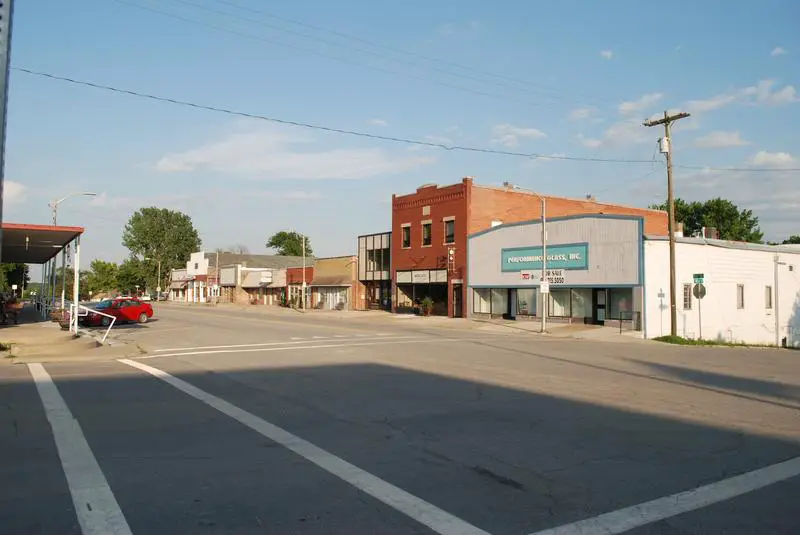
Population: 5,812
Poverty Level: 9.2%
Median Home Price $126,600
Married Households 19.0%
Households With Kids 41.98%
More on Ulysses: Data | Crime | Cost Of Living
/10
Population: 10,887
Poverty Level: 11.0%
Median Home Price $125,800
Married Households 31.0%
Households With Kids 39.43%
More on Haysville: Data | Crime | Cost Of Living
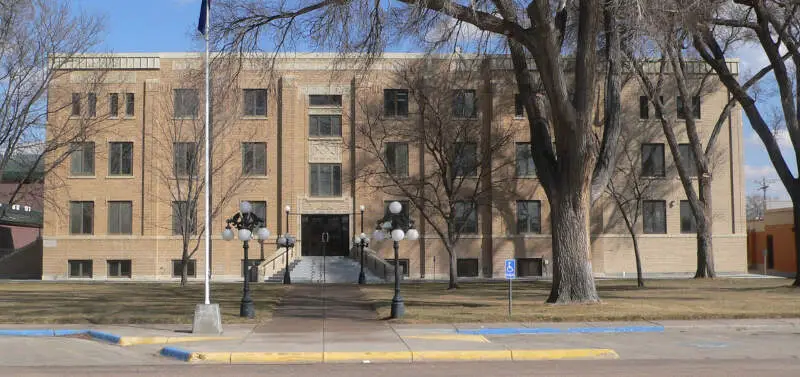
/10
Population: 6,160
Poverty Level: 7.0%
Median Home Price $279,900
Married Households 19.0%
Households With Kids 46.92%
More on De Soto: Data | Cost Of Living
/10
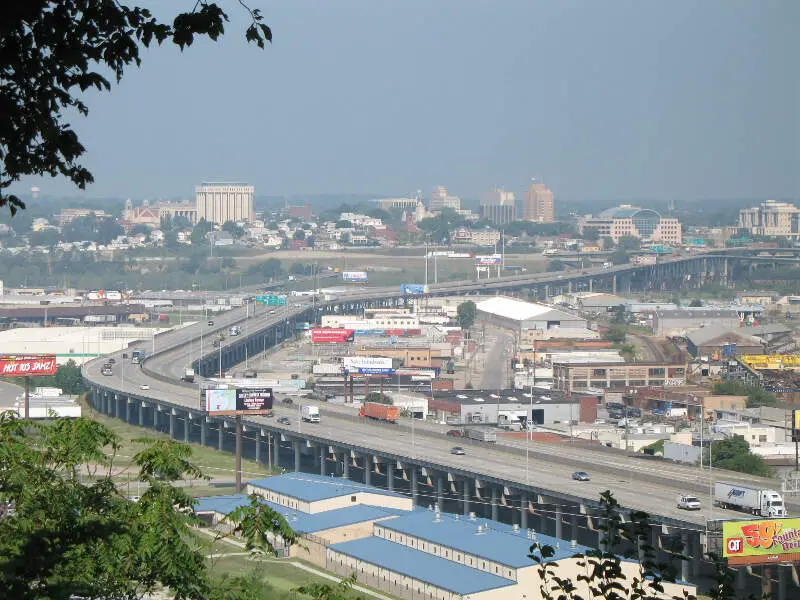
Population: 155,745
Poverty Level: 18.4%
Median Home Price $112,500
Married Households 16.0%
Households With Kids 33.96%
More on Kansas City: Data | Cost Of Living
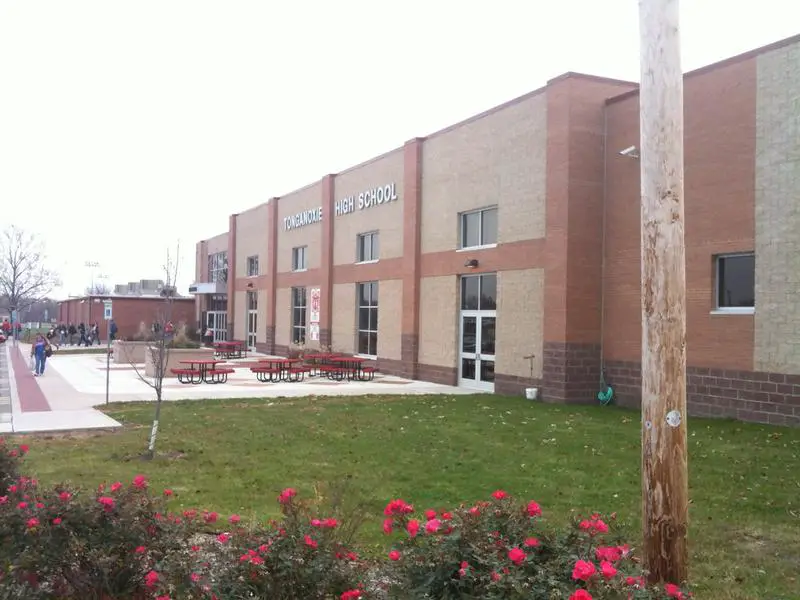
/10
Population: 5,383
Poverty Level: 8.9%
Median Home Price $168,800
Married Households 23.0%
Households With Kids 41.2%
More on Tonganoxie: Data | Crime | Cost Of Living
/10
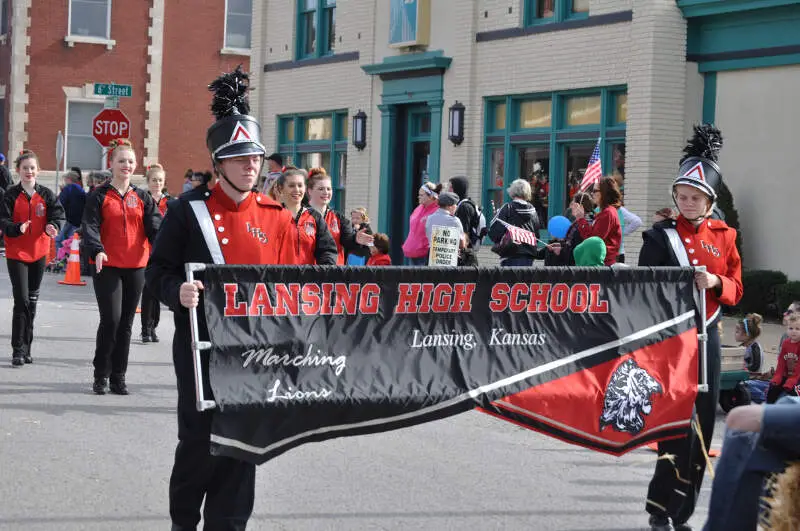
Population: 11,321
Poverty Level: 1.0%
Median Home Price $193,100
Married Households 15.0%
Households With Kids 43.94%
More on Lansing: Data | Crime | Cost Of Living
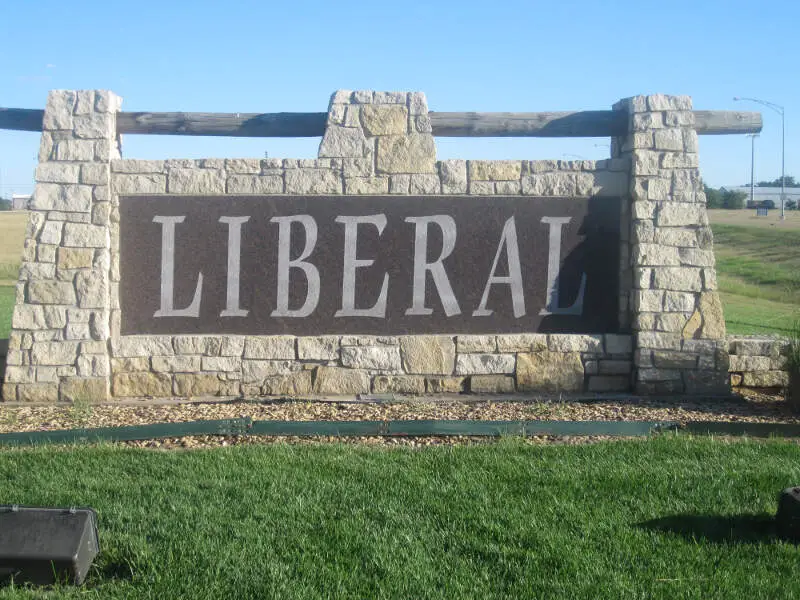
/10
Population: 19,340
Poverty Level: 13.9%
Median Home Price $107,800
Married Households 11.0%
Households With Kids 41.93%
More on Liberal: Data | Crime | Cost Of Living
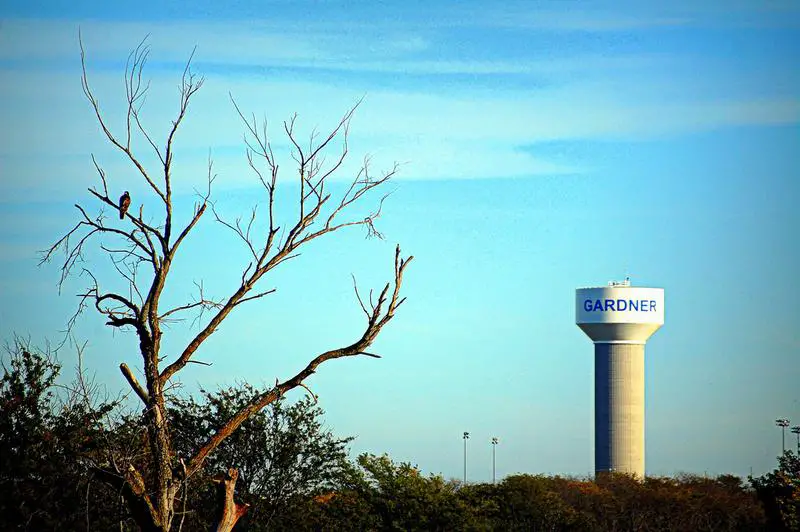
/10
Population: 23,065
Poverty Level: 5.9%
Median Home Price $213,800
Married Households 22.0%
Households With Kids 45.42%
More on Gardner: Data | Crime | Cost Of Living
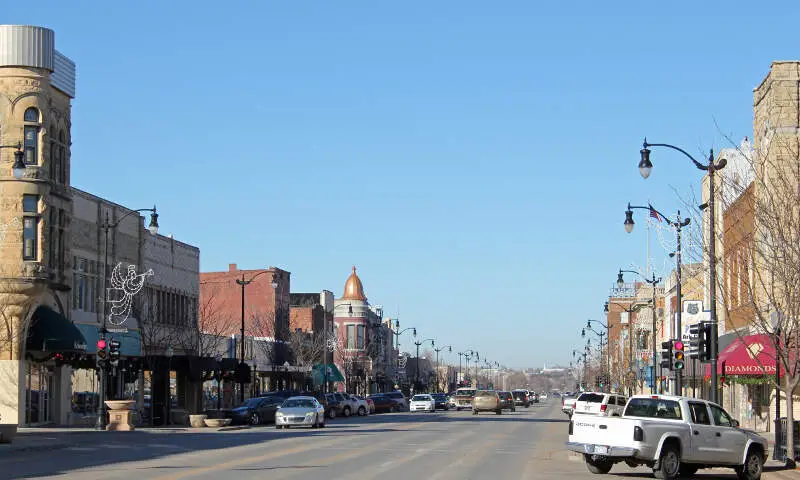
/10
Population: 12,028
Poverty Level: 13.7%
Median Home Price $71,600
Married Households 28.0%
Households With Kids 28.93%
More on Arkansas City: Data | Crime | Cost Of Living
/10
Population: 8,365
Poverty Level: 1.5%
Median Home Price $166,300
Married Households 47.0%
Households With Kids 40.69%
More on Valley Center: Data | Crime | Cost Of Living
Methodology: How We Measured The Most Miserable Cities In The Sunflower State
To rank the unhappiest places in Kansas, we had to determine what criteria make people happy. It isn’t a stretch to assume that happy people earn great salaries, are relatively stress-free, and have a stable home life.
So we went to the Census’s American Community Survey 2017-2021 report for the happy criteria, flipped the list with Saturday Night Science, and it spit out the answer.
Like magic.
Here are the criteria we used to measure misery:
- Percentage of residents with a college degree
- Average commute times
- Unemployment rates
- Cost of living
- % of married couples
- % of families with kids
- Poverty rate
After we decided on the criteria, we gathered the data for the 62 places in Kansas with over 5,000 people.
We then ranked each place from one to 62 for each of the seven criteria, with a score of one being the most miserable (Any ties were given to the larger place).
Next, we averaged the seven rankings into a Miserable Index for each place with the lowest overall Miserable Index “earning” the title “Most Miserable City In Kansas.”
If you’d like to see the complete list of states, most miserable to happiest, scroll to the bottom of this post to see the unabridged chart.
We updated this article for 2023, and it’s our tenth time ranking the most miserable cities in Kansas.
There You Have It – The Least Happy Cities In Kansas
As we said earlier, trying to determine the most miserable cities in Kansas is usually a subjective matter.
But if you’re analyzing cities where people are not stable, where you’re stuck in traffic, and no one spent the time to go to college, then this is an accurate list.
If you’re curious enough, here are the happiest cities in Kansas, according to science:
- Hays
- McPherson
- Manhattan
For more Kansas reading, check out:
- Best Places To Live In Kansas
- Cheapest Places To Live In Kansas
- Most Dangerous Places In Kansas
- Richest Cities In Kansas
- Safest Places In Kansas
- Worst Places To Live In Kansas
Miserable Cities In Kansas For 2023
| Rank | City | Population | Poverty Level | Median Home Value | % Married | % Kids |
|---|---|---|---|---|---|---|
| 1 | Ulysses, KS | 5,812 | 9.2% | $126,600 | 19.0% | 41.98% |
| 2 | Haysville, KS | 10,887 | 11.0% | $125,800 | 31.0% | 39.43% |
| 3 | De Soto, KS | 6,160 | 7.0% | $279,900 | 19.0% | 46.92% |
| 4 | Kansas City, KS | 155,745 | 18.4% | $112,500 | 16.0% | 33.96% |
| 5 | Tonganoxie, KS | 5,383 | 8.9% | $168,800 | 23.0% | 41.2% |
| 6 | Lansing, KS | 11,321 | 1.0% | $193,100 | 15.0% | 43.94% |
| 7 | Liberal, KS | 19,340 | 13.9% | $107,800 | 11.0% | 41.93% |
| 8 | Gardner, KS | 23,065 | 5.9% | $213,800 | 22.0% | 45.42% |
| 9 | Arkansas City, KS | 12,028 | 13.7% | $71,600 | 28.0% | 28.93% |
| 10 | Valley Center, KS | 8,365 | 1.5% | $166,300 | 47.0% | 40.69% |
| 11 | Dodge City, KS | 27,899 | 14.0% | $101,800 | 16.0% | 46.3% |
| 12 | Junction City, KS | 23,033 | 16.5% | $140,400 | 12.0% | 40.49% |
| 13 | Wellington, KS | 7,745 | 12.7% | $79,500 | 31.0% | 35.84% |
| 14 | Maize, KS | 5,469 | 4.4% | $184,100 | 30.0% | 35.98% |
| 15 | Chanute, KS | 8,737 | 18.8% | $80,300 | 32.0% | 37.86% |
| 16 | Garden City, KS | 28,022 | 13.7% | $158,500 | 16.0% | 34.42% |
| 17 | Atchison, KS | 10,773 | 16.2% | $100,000 | 25.0% | 32.75% |
| 18 | Park City, KS | 7,817 | 7.7% | $132,500 | 30.0% | 36.73% |
| 19 | Coffeyville, KS | 9,032 | 26.0% | $52,300 | 20.0% | 22.02% |
| 20 | Newton, KS | 18,576 | 10.7% | $107,500 | 30.0% | 33.26% |
| 21 | Winfield, KS | 11,817 | 19.1% | $101,800 | 26.0% | 35.46% |
| 22 | Mulvane, KS | 5,676 | 10.8% | $136,400 | 31.0% | 35.59% |
| 23 | Leavenworth, KS | 37,216 | 13.1% | $142,300 | 15.0% | 31.61% |
| 24 | Augusta, KS | 9,299 | 11.4% | $139,300 | 41.0% | 31.54% |
| 25 | Basehor, KS | 6,717 | 7.9% | $261,500 | 35.0% | 32.09% |
| 26 | Concordia, KS | 5,096 | 14.8% | $82,100 | 27.0% | 26.32% |
| 27 | Olathe, KS | 140,339 | 6.0% | $273,600 | 19.0% | 39.85% |
| 28 | Iola, KS | 5,378 | 21.1% | $76,600 | 32.0% | 26.62% |
| 29 | Bonner Springs, KS | 7,858 | 10.1% | $178,200 | 33.0% | 34.11% |
| 30 | Wichita, KS | 394,574 | 15.2% | $145,300 | 23.0% | 30.07% |
| 31 | Ottawa, KS | 12,592 | 11.4% | $132,300 | 29.0% | 30.99% |
| 32 | Hutchinson, KS | 40,202 | 13.1% | $103,500 | 31.0% | 29.54% |
| 33 | Spring Hill, KS | 7,883 | 9.9% | $243,000 | 30.0% | 45.03% |
| 34 | Derby, KS | 25,365 | 7.0% | $180,600 | 32.0% | 32.92% |
| 35 | Shawnee, KS | 67,021 | 5.9% | $266,800 | 22.0% | 34.89% |
| 36 | Topeka, KS | 126,802 | 15.2% | $106,500 | 25.0% | 27.22% |
| 37 | Paola, KS | 5,733 | 6.5% | $165,300 | 28.0% | 24.63% |
| 38 | Eudora, KS | 6,457 | 7.9% | $188,500 | 37.0% | 40.63% |
| 39 | Fort Scott, KS | 7,579 | 16.7% | $69,600 | 28.0% | 25.02% |
| 40 | Pittsburg, KS | 20,667 | 29.2% | $85,600 | 17.0% | 29.15% |
| 41 | Merriam, KS | 11,110 | 7.9% | $196,100 | 18.0% | 22.38% |
| 42 | Andover, KS | 15,162 | 4.1% | $234,900 | 33.0% | 50.78% |
| 43 | Overland Park, KS | 195,249 | 4.1% | $314,500 | 13.0% | 30.01% |
| 44 | Leawood, KS | 33,748 | 2.0% | $498,900 | 15.0% | 30.81% |
| 45 | El Dorado, KS | 12,855 | 17.2% | $97,800 | 34.0% | 32.84% |
| 46 | Great Bend, KS | 14,864 | 17.0% | $99,100 | 32.0% | 30.65% |
| 47 | Prairie Village, KS | 22,812 | 4.4% | $333,300 | 15.0% | 27.8% |
| 48 | Bel Aire, KS | 8,148 | 9.3% | $168,400 | 29.0% | 41.9% |
| 49 | Parsons, KS | 9,652 | 21.3% | $59,500 | 28.0% | 28.68% |
| 50 | Lenexa, KS | 56,755 | 5.1% | $299,400 | 19.0% | 28.62% |
| 51 | Emporia, KS | 24,220 | 17.8% | $106,500 | 23.0% | 26.13% |
| 52 | Pratt, KS | 6,618 | 13.2% | $94,100 | 28.0% | 27.58% |
| 53 | Salina, KS | 46,896 | 12.1% | $138,500 | 30.0% | 26.92% |
| 54 | Mission, KS | 9,884 | 11.0% | $225,200 | 12.0% | 19.63% |
| 55 | Abilene, KS | 6,507 | 8.2% | $114,100 | 32.0% | 25.99% |
| 56 | Independence, KS | 8,584 | 17.2% | $73,600 | 30.0% | 24.53% |
| 57 | Roeland Park, KS | 6,871 | 13.3% | $211,900 | 14.0% | 22.2% |
| 58 | Colby, KS | 5,434 | 8.0% | $133,300 | 33.0% | 27.49% |
| 59 | Lawrence, KS | 94,745 | 19.1% | $216,700 | 17.0% | 21.78% |
| 60 | Manhattan, KS | 54,794 | 25.9% | $222,300 | 11.0% | 23.0% |
| 61 | Mcpherson, KS | 13,916 | 11.9% | $163,900 | 30.0% | 30.34% |
| 62 | Hays, KS | 20,870 | 17.6% | $185,700 | 34.0% | 26.83% |