
Do you live in one of the most miserable places in Minnesota?
Only a third of Minnesotans say they are truly happy. That’s too bad, considering that folks in Minnesota don’t really have it too bad in the grand scheme of things.
But, we were curious – which Minnesota cities might be the most miserable? We’re about to find out, using Saturday Night Science and data.
After analyzing the 149 largest cities, we sadly present the most miserable cities in the North Star State.
Table Of Contents: Top Ten | Methodology | Summary | Table
The 10 Most Miserable Places In Minnesota
Read on below to see how we crunched the numbers and how your town ranked. If you have a smile on your face, you probably don’t live in one of these cities.
Oh, and by the way, Mendota Heights is the happiest place in Minnesota.
For more Minnesota reading, check out:
The 10 Most Miserable Places In Minnesota For 2023
/10
Population: 33,298
Poverty Level: 12.2%
Median Home Price $203,200
Married Households 14.0%
Households With Kids 38.33%
More on Brooklyn Center: Data | Crime | Cost Of Living
/10
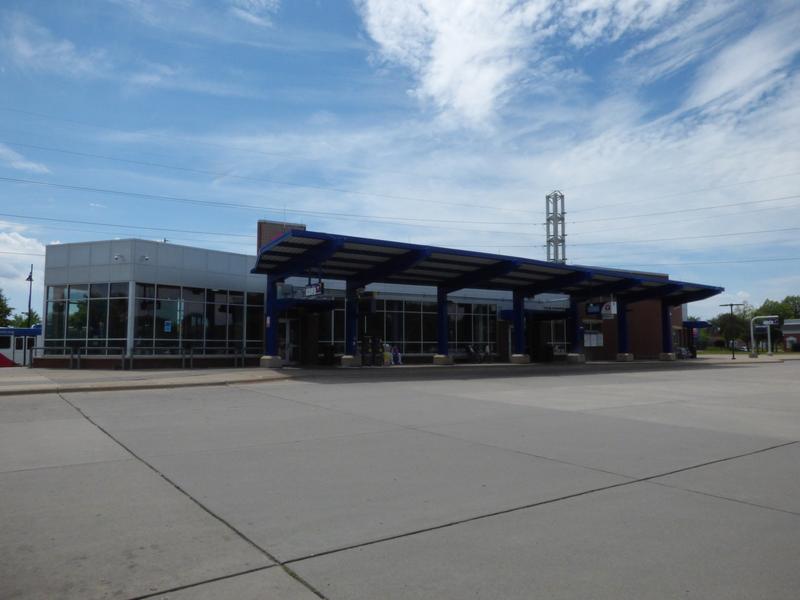
Population: 11,614
Poverty Level: 2.1%
Median Home Price $226,600
Married Households 37.0%
Households With Kids 51.22%
More on Big Lake: Data | Crime | Cost Of Living
/10
Population: 6,560
Poverty Level: 14.2%
Median Home Price $281,800
Married Households 31.0%
Households With Kids 49.64%
More on Jordan: Data | Crime | Cost Of Living
/10
/10
Population: 24,310
Poverty Level: 17.4%
Median Home Price $173,600
Married Households 23.0%
Households With Kids 30.36%
More on Faribault: Data | Crime | Cost Of Living
/10
Population: 85,247
Poverty Level: 8.7%
Median Home Price $248,900
Married Households 19.0%
Households With Kids 39.15%
More on Brooklyn Park: Data | Crime | Cost Of Living
/10
Population: 9,237
Poverty Level: 9.0%
Median Home Price $142,500
Married Households 32.0%
Households With Kids 35.82%
More on Waseca: Data | Crime | Cost Of Living
/10
Population: 63,269
Poverty Level: 6.2%
Median Home Price $228,900
Married Households 28.0%
Households With Kids 30.98%
More on Coon Rapids: Data | Crime | Cost Of Living
/10
Population: 23,253
Poverty Level: 3.1%
Median Home Price $286,400
Married Households 32.0%
Households With Kids 45.85%
More on Farmington: Data | Crime | Cost Of Living
Methodology: How We Measured The Most Miserable Cities In The North Star State
To rank the unhappiest places in Minnesota, we had to determine what criteria make people happy. It isn’t a stretch to assume that happy people earn great salaries, are relatively stress-free, and have a stable home life.
So we went to the Census’s American Community Survey 2017-2021 report for the happy criteria, flipped the list with Saturday Night Science, and it spit out the answer.
Like magic.
Here are the criteria we used to measure misery:
- Percentage of residents with a college degree
- Average commute times
- Unemployment rates
- Cost of living
- % of married couples
- % of families with kids
- Poverty rate
After we decided on the criteria, we gathered the data for the 149 places in Minnesota with over 5,000 people.
We then ranked each place from one to 149 for each of the seven criteria, with a score of one being the most miserable (Any ties were given to the larger place).
Next, we averaged the seven rankings into a Miserable Index for each place with the lowest overall Miserable Index “earning” the title “Most Miserable City In Minnesota.”
If you’d like to see the complete list of states, most miserable to happiest, scroll to the bottom of this post to see the unabridged chart.
We updated this article for 2023, and it’s our tenth time ranking the most miserable cities in Minnesota.
There You Have It – The Least Happy Cities In Minnesota
As we said earlier, trying to determine the most miserable cities in Minnesota is usually a subjective matter.
But if you’re analyzing cities where people are not stable, where you’re stuck in traffic, and no one spent the time to go to college, then this is an accurate list.
If you’re curious enough, here are the happiest cities in Minnesota, according to science:
- Mendota Heights
- Morris
- Minnetonka
For more Minnesota reading, check out:
- Best Places To Live In Minnesota
- Cheapest Places To Live In Minnesota
- Most Dangerous Cities In Minnesota
- Richest Cities In Minnesota
- Safest Places In Minnesota
- Worst Places To Live In Minnesota
- Most Expensive Places To Live In Minnesota
Miserable Cities In Minnesota For 2023
| Rank | City | Population | Poverty Level | Median Home Value | % Married | % Kids |
|---|---|---|---|---|---|---|
| 1 | Brooklyn Center, MN | 33,298 | 12.2% | $203,200 | 14.0% | 38.33% |
| 2 | Big Lake, MN | 11,614 | 2.1% | $226,600 | 37.0% | 51.22% |
| 3 | Jordan, MN | 6,560 | 14.2% | $281,800 | 31.0% | 49.64% |
| 4 | St. Paul Park, MN | 5,490 | 4.3% | $222,900 | 25.0% | 28.95% |
| 5 | Faribault, MN | 24,310 | 17.4% | $173,600 | 23.0% | 30.36% |
| 6 | Brooklyn Park, MN | 85,247 | 8.7% | $248,900 | 19.0% | 39.15% |
| 7 | Waseca, MN | 9,237 | 9.0% | $142,500 | 32.0% | 35.82% |
| 8 | Coon Rapids, MN | 63,269 | 6.2% | $228,900 | 28.0% | 30.98% |
| 9 | Farmington, MN | 23,253 | 3.1% | $286,400 | 32.0% | 45.85% |
| 10 | North St. Paul, MN | 12,395 | 9.4% | $231,000 | 26.0% | 31.92% |
| 11 | Worthington, MN | 13,782 | 15.0% | $141,400 | 16.0% | 33.33% |
| 12 | Zimmerman, MN | 6,108 | 11.8% | $216,600 | 32.0% | 42.2% |
| 13 | Ramsey, MN | 27,409 | 4.0% | $281,800 | 38.0% | 37.48% |
| 14 | Elk River, MN | 25,467 | 3.9% | $260,400 | 32.0% | 36.84% |
| 15 | East Bethel, MN | 11,818 | 2.0% | $284,300 | 49.0% | 30.28% |
| 16 | Anoka, MN | 17,749 | 8.3% | $229,400 | 29.0% | 31.5% |
| 17 | St. Francis, MN | 8,099 | 7.5% | $237,800 | 36.0% | 41.46% |
| 18 | East Grand Forks, MN | 9,140 | 12.1% | $215,400 | 19.0% | 36.11% |
| 19 | South St. Paul, MN | 20,637 | 10.5% | $220,200 | 26.0% | 30.17% |
| 20 | Glencoe, MN | 5,708 | 5.6% | $169,800 | 32.0% | 30.76% |
| 21 | Fridley, MN | 29,422 | 11.0% | $224,700 | 22.0% | 28.91% |
| 22 | Buffalo, MN | 16,121 | 6.7% | $217,800 | 39.0% | 32.17% |
| 23 | New Prague, MN | 8,060 | 4.3% | $271,400 | 45.0% | 45.81% |
| 24 | Apple Valley, MN | 55,237 | 4.7% | $291,400 | 25.0% | 35.11% |
| 25 | Isanti, MN | 6,667 | 14.8% | $199,900 | 32.0% | 36.47% |
| 26 | Brainerd, MN | 14,053 | 18.0% | $134,800 | 25.0% | 26.56% |
| 27 | Blaine, MN | 68,999 | 5.6% | $257,700 | 32.0% | 37.37% |
| 28 | Circle Pines, MN | 5,001 | 4.8% | $214,300 | 35.0% | 30.52% |
| 29 | Belle Plaine, MN | 7,293 | 2.3% | $250,600 | 38.0% | 41.87% |
| 30 | Montevideo, MN | 5,360 | 15.1% | $103,100 | 31.0% | 26.59% |
| 31 | Burnsville, MN | 63,926 | 6.9% | $275,500 | 22.0% | 29.97% |
| 32 | Spring Lake Park, MN | 6,920 | 12.1% | $224,300 | 25.0% | 29.78% |
| 33 | Albert Lea, MN | 18,433 | 13.2% | $113,900 | 31.0% | 29.09% |
| 34 | Cambridge, MN | 9,454 | 8.4% | $187,500 | 30.0% | 29.85% |
| 35 | Waite Park, MN | 8,245 | 22.9% | $181,000 | 22.0% | 24.32% |
| 36 | Oakdale, MN | 28,019 | 6.2% | $244,900 | 31.0% | 31.38% |
| 37 | Carver, MN | 5,837 | 0.7% | $342,800 | 39.0% | 50.65% |
| 38 | Cloquet, MN | 12,563 | 15.5% | $155,900 | 32.0% | 32.4% |
| 39 | St. Cloud, MN | 68,430 | 22.0% | $164,500 | 22.0% | 27.9% |
| 40 | Kasson, MN | 6,772 | 2.1% | $217,400 | 41.0% | 46.0% |
| 41 | North Branch, MN | 10,742 | 9.1% | $233,900 | 41.0% | 30.05% |
| 42 | Columbia Heights, MN | 21,612 | 11.1% | $211,100 | 20.0% | 25.7% |
| 43 | Wyoming, MN | 7,984 | 3.4% | $264,400 | 46.0% | 37.26% |
| 44 | New Hope, MN | 21,683 | 9.0% | $249,600 | 22.0% | 30.26% |
| 45 | Shakopee, MN | 43,396 | 5.4% | $295,000 | 26.0% | 43.34% |
| 46 | Robbinsdale, MN | 14,522 | 10.2% | $228,000 | 25.0% | 26.98% |
| 47 | Savage, MN | 32,092 | 5.8% | $340,300 | 30.0% | 40.77% |
| 48 | Rosemount, MN | 25,513 | 1.7% | $320,600 | 35.0% | 42.07% |
| 49 | Monticello, MN | 14,235 | 9.4% | $230,600 | 38.0% | 37.93% |
| 50 | Willmar, MN | 20,823 | 16.5% | $145,900 | 26.0% | 30.71% |
| 51 | Mounds View, MN | 13,187 | 10.9% | $236,600 | 30.0% | 31.84% |
| 52 | Victoria, MN | 10,361 | 2.0% | $478,600 | 36.0% | 44.22% |
| 53 | Otsego, MN | 19,565 | 0.9% | $307,200 | 39.0% | 49.02% |
| 54 | International Falls, MN | 5,859 | 13.5% | $99,900 | 28.0% | 20.56% |
| 55 | Austin, MN | 26,030 | 15.6% | $118,500 | 27.0% | 32.72% |
| 56 | Virginia, MN | 8,444 | 25.0% | $90,200 | 29.0% | 25.32% |
| 57 | Cottage Grove, MN | 38,582 | 3.1% | $282,000 | 37.0% | 41.18% |
| 58 | Forest Lake, MN | 20,366 | 4.6% | $299,800 | 37.0% | 29.77% |
| 59 | Albertville, MN | 7,792 | 1.2% | $243,400 | 46.0% | 40.53% |
| 60 | St. Paul, MN | 309,751 | 17.6% | $232,400 | 16.0% | 29.45% |
| 61 | Champlin, MN | 23,877 | 6.8% | $271,300 | 34.0% | 34.52% |
| 62 | St. Michael, MN | 18,148 | 3.3% | $299,800 | 42.0% | 48.71% |
| 63 | Byron, MN | 6,220 | 5.1% | $259,800 | 30.0% | 42.28% |
| 64 | Little Falls, MN | 9,049 | 16.3% | $154,400 | 38.0% | 25.34% |
| 65 | Little Canada, MN | 10,704 | 10.4% | $247,200 | 23.0% | 25.14% |
| 66 | Northfield, MN | 20,374 | 8.3% | $250,100 | 20.0% | 26.77% |
| 67 | Crystal, MN | 23,143 | 6.5% | $227,100 | 26.0% | 26.34% |
| 68 | Delano, MN | 6,386 | 3.8% | $278,700 | 38.0% | 38.9% |
| 69 | Chisago City, MN | 5,499 | 4.7% | $293,000 | 49.0% | 34.37% |
| 70 | Fergus Falls, MN | 13,969 | 11.0% | $145,200 | 27.0% | 18.54% |
| 71 | West St. Paul, MN | 20,476 | 12.1% | $232,400 | 25.0% | 25.73% |
| 72 | Richfield, MN | 36,899 | 7.3% | $259,200 | 22.0% | 23.51% |
| 73 | Lakeville, MN | 69,026 | 3.9% | $342,100 | 33.0% | 44.89% |
| 74 | White Bear Lake, MN | 24,520 | 5.9% | $256,100 | 31.0% | 26.21% |
| 75 | Vadnais Heights, MN | 12,931 | 6.5% | $269,200 | 34.0% | 28.04% |
| 76 | Maplewood, MN | 41,673 | 10.3% | $243,100 | 25.0% | 28.94% |
| 77 | Stewartville, MN | 6,620 | 6.6% | $198,300 | 36.0% | 40.89% |
| 78 | Oak Grove, MN | 8,870 | 2.1% | $334,600 | 47.0% | 29.25% |
| 79 | Red Wing, MN | 16,596 | 11.5% | $185,800 | 34.0% | 26.1% |
| 80 | Woodbury, MN | 74,014 | 4.2% | $355,200 | 28.0% | 38.25% |
| 81 | Waconia, MN | 12,773 | 3.9% | $340,400 | 37.0% | 42.46% |
| 82 | Marshall, MN | 13,728 | 16.8% | $164,800 | 28.0% | 33.54% |
| 83 | Fairmont, MN | 10,465 | 14.4% | $137,700 | 33.0% | 23.86% |
| 84 | Crookston, MN | 7,509 | 15.6% | $139,500 | 27.0% | 27.53% |
| 85 | Hastings, MN | 22,063 | 5.5% | $239,600 | 34.0% | 29.96% |
| 86 | Sartell, MN | 19,096 | 6.0% | $226,500 | 36.0% | 39.91% |
| 87 | Andover, MN | 32,471 | 3.0% | $330,800 | 42.0% | 41.01% |
| 88 | Eden Prairie, MN | 64,048 | 5.0% | $383,300 | 25.0% | 35.92% |
| 89 | Shorewood, MN | 7,779 | 4.6% | $559,800 | 33.0% | 37.62% |
| 90 | Arden Hills, MN | 9,868 | 6.9% | $326,900 | 29.0% | 35.81% |
| 91 | Owatonna, MN | 26,366 | 8.8% | $183,400 | 35.0% | 31.14% |
| 92 | Moorhead, MN | 44,129 | 17.9% | $209,200 | 20.0% | 29.75% |
| 93 | Sauk Rapids, MN | 13,830 | 7.9% | $190,900 | 34.0% | 32.38% |
| 94 | Bemidji, MN | 15,114 | 24.8% | $149,700 | 15.0% | 24.63% |
| 95 | Litchfield, MN | 6,537 | 8.3% | $154,700 | 32.0% | 26.89% |
| 96 | Rogers, MN | 13,182 | 1.9% | $361,200 | 40.0% | 49.94% |
| 97 | Hutchinson, MN | 14,504 | 9.2% | $164,000 | 36.0% | 22.53% |
| 98 | Eagan, MN | 68,205 | 5.8% | $312,100 | 27.0% | 30.64% |
| 99 | Lino Lakes, MN | 21,180 | 1.9% | $308,600 | 43.0% | 33.26% |
| 100 | Grand Rapids, MN | 11,056 | 14.1% | $165,700 | 31.0% | 24.12% |
Why isn’t St. Paul, not on this list?
That is ridiculous! Just because you may not have a college degree or own your own house your miserable? I don’t see the correlation! Happiness and Money don’t necessarily go hand in hand!
Frost Minnesota is very miserable