
Do you live in one of the most miserable places in New Jersey?
Only a third of New Jerseyans say they are truly happy. That’s too bad, considering that folks in New Jersey don’t really have it too bad in the grand scheme of things.
But, we were curious – which New Jersey cities might be the most miserable? We’re about to find out, using Saturday Night Science and data.
After analyzing the 264 largest cities, we sadly present the most miserable cities in the Garden State.
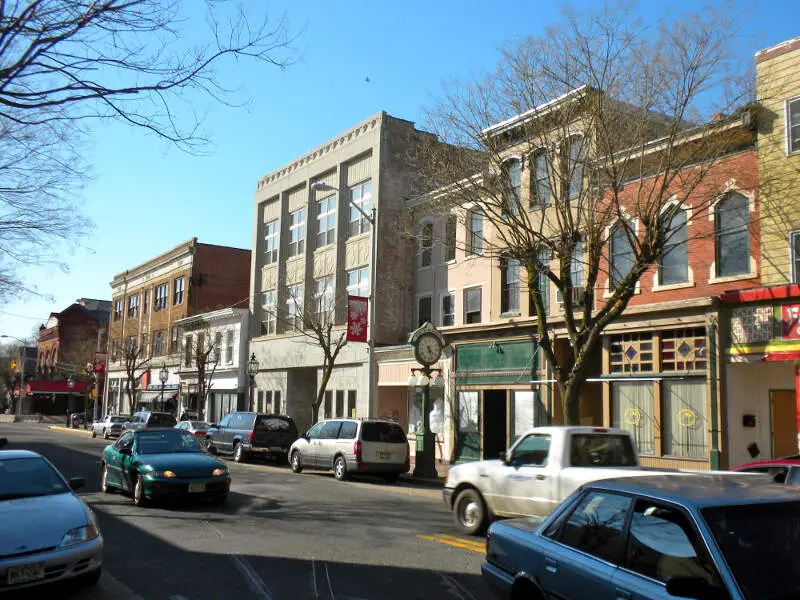
Table Of Contents: Top Ten | Methodology | Summary | Table
The 10 Most Miserable Places In New Jersey
Read on below to see how we crunched the numbers and how your town ranked. If you have a smile on your face, you probably don’t live in one of these cities.
Oh, and by the way, Ocean City is the happiest place in New Jersey.
For more New Jersey reading, check out:
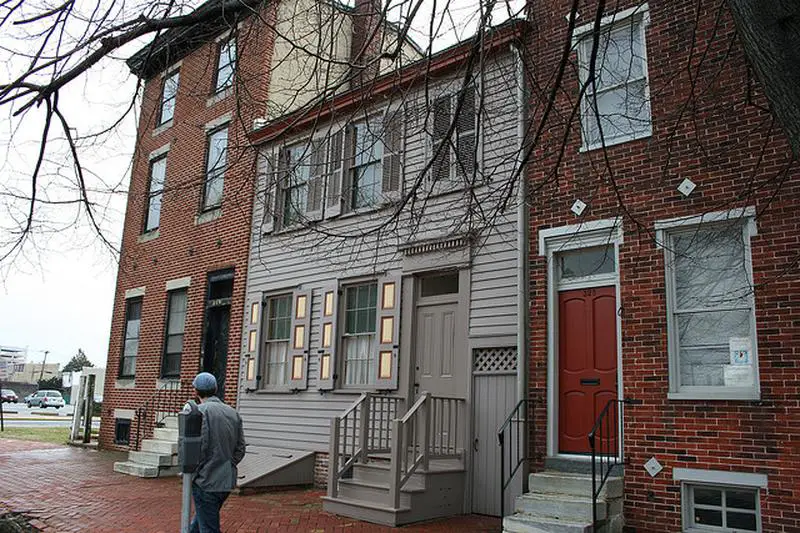
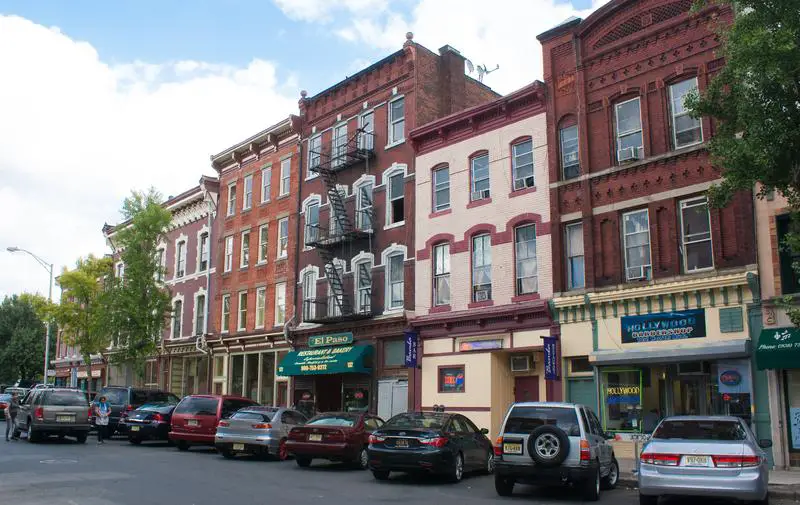
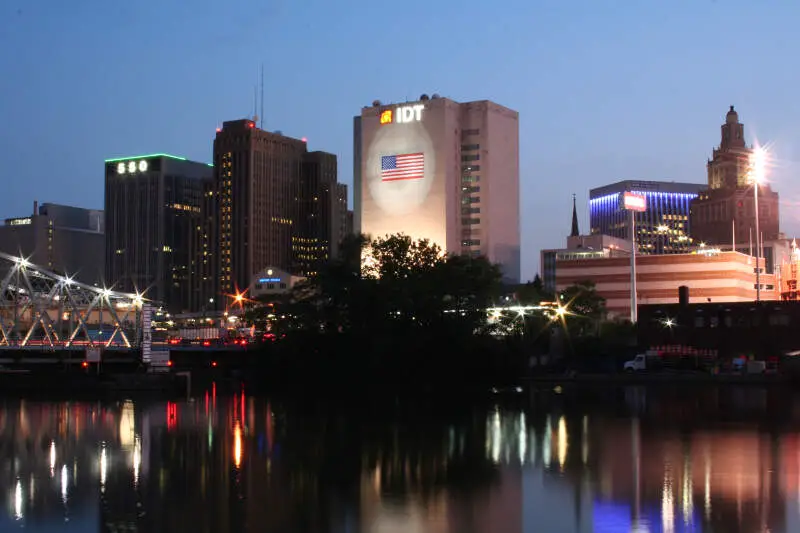
The 10 Most Miserable Places In New Jersey For 2023
/10
Population: 7,904
Poverty Level: 5.5%
Median Home Price $0
Married Households 3.0%
Households With Kids 59.93%
More on Fort Dix: Data | Cost Of Living
/10
Population: 8,185
Poverty Level: 1.3%
Median Home Price $408,900
Married Households 9.0%
Households With Kids 49.19%
More on Dayton: Data | Cost Of Living
/10
Population: 72,381
Poverty Level: 33.6%
Median Home Price $85,800
Married Households 6.0%
Households With Kids 40.59%
More on Camden: Data | Cost Of Living
/10
Population: 54,183
Poverty Level: 17.1%
Median Home Price $287,300
Married Households 9.0%
Households With Kids 42.39%
More on Plainfield: Data | Crime | Cost Of Living
/10
Population: 306,247
Poverty Level: 25.8%
Median Home Price $271,700
Married Households 6.0%
Households With Kids 33.93%
More on Newark: Data | Crime | Cost Of Living
/10
Population: 22,511
Poverty Level: 8.2%
Median Home Price $249,700
Married Households 11.0%
Households With Kids 33.25%
More on Roselle: Data | Crime | Cost Of Living
/10
Population: 26,643
Poverty Level: 35.1%
Median Home Price $109,800
Married Households 9.0%
Households With Kids 44.8%
More on Bridgeton: Data | Crime | Cost Of Living
/10
Population: 5,216
Poverty Level: 1.0%
Median Home Price $0
Married Households 5.0%
Households With Kids 65.71%
More on Mcguire Afb: Data | Cost Of Living
/10
Population: 17,132
Poverty Level: 11.6%
Median Home Price $288,100
Married Households 12.0%
Households With Kids 40.53%
More on Avenel: Data | Cost Of Living
/10
Population: 18,418
Poverty Level: 12.4%
Median Home Price $275,400
Married Households 7.0%
Households With Kids 44.35%
More on Dover: Data | Crime | Cost Of Living
Methodology: How We Measured The Most Miserable Cities In The Garden State
To rank the unhappiest places in New Jersey, we had to determine what criteria make people happy. It isn’t a stretch to assume that happy people earn great salaries, are relatively stress-free, and have a stable home life.
So we went to the Census’s American Community Survey 2017-2021 report for the happy criteria, flipped the list with Saturday Night Science, and it spit out the answer.
Like magic.
Here are the criteria we used to measure misery:
- Percentage of residents with a college degree
- Average commute times
- Unemployment rates
- Cost of living
- % of married couples
- % of families with kids
- Poverty rate
After we decided on the criteria, we gathered the data for the 264 places in New Jersey with over 5,000 people.
We then ranked each place from one to 264 for each of the seven criteria, with a score of one being the most miserable (Any ties were given to the larger place).
Next, we averaged the seven rankings into a Miserable Index for each place with the lowest overall Miserable Index “earning” the title “Most Miserable City In New Jersey.”
If you’d like to see the complete list of states, most miserable to happiest, scroll to the bottom of this post to see the unabridged chart.
We updated this article for 2023, and it’s our tenth time ranking the most miserable cities in New Jersey.
There You Have It – The Least Happy Cities In New Jersey
As we said earlier, trying to determine the most miserable cities in New Jersey is usually a subjective matter.
But if you’re analyzing cities where people are not stable, where you’re stuck in traffic, and no one spent the time to go to college, then this is an accurate list.
If you’re curious enough, here are the happiest cities in New Jersey, according to science:
- Ocean City
- Florham Park
- Morristown
For more New Jersey reading, check out:
- Best Places To Live In New Jersey
- Cheapest Places To Live In New Jersey
- Most Dangerous Cities In New Jersey
- Richest Cities In New Jersey
- Safest Places In New Jersey
- Worst Places To Live In New Jersey
- Most Expensive Places To Live In New Jersey
Miserable Cities In New Jersey For 2023
| Rank | City | Population | Poverty Level | Median Home Value | % Married | % Kids |
|---|---|---|---|---|---|---|
| 1 | Fort Dix, NJ | 7,904 | 5.5% | $0 | 3.0% | 59.93% |
| 2 | Dayton, NJ | 8,185 | 1.3% | $408,900 | 9.0% | 49.19% |
| 3 | Camden, NJ | 72,381 | 33.6% | $85,800 | 6.0% | 40.59% |
| 4 | Plainfield, NJ | 54,183 | 17.1% | $287,300 | 9.0% | 42.39% |
| 5 | Newark, NJ | 306,247 | 25.8% | $271,700 | 6.0% | 33.93% |
| 6 | Roselle, NJ | 22,511 | 8.2% | $249,700 | 11.0% | 33.25% |
| 7 | Bridgeton, NJ | 26,643 | 35.1% | $109,800 | 9.0% | 44.8% |
| 8 | Mcguire Afb, NJ | 5,216 | 1.0% | $0 | 5.0% | 65.71% |
| 9 | Avenel, NJ | 17,132 | 11.6% | $288,100 | 12.0% | 40.53% |
| 10 | Dover, NJ | 18,418 | 12.4% | $275,400 | 7.0% | 44.35% |
| 11 | East Orange, NJ | 68,918 | 18.0% | $244,100 | 8.0% | 29.57% |
| 12 | Clayton, NJ | 8,818 | 9.2% | $208,400 | 20.0% | 34.39% |
| 13 | Salem, NJ | 5,237 | 37.8% | $59,100 | 16.0% | 39.11% |
| 14 | Perth Amboy, NJ | 55,046 | 20.8% | $282,600 | 6.0% | 41.37% |
| 15 | Passaic, NJ | 70,308 | 25.3% | $347,900 | 5.0% | 49.12% |
| 16 | Paterson, NJ | 157,927 | 25.1% | $269,200 | 5.0% | 44.74% |
| 17 | Carteret, NJ | 25,077 | 8.6% | $284,200 | 13.0% | 38.96% |
| 18 | Pleasantville, NJ | 20,505 | 24.5% | $134,900 | 9.0% | 35.51% |
| 19 | Union City, NJ | 67,903 | 20.0% | $382,200 | 3.0% | 35.52% |
| 20 | Linden, NJ | 43,387 | 7.7% | $307,200 | 14.0% | 31.84% |
| 21 | Burlington, NJ | 9,800 | 14.6% | $170,600 | 19.0% | 35.27% |
| 22 | North Plainfield, NJ | 22,635 | 12.0% | $285,000 | 11.0% | 30.27% |
| 23 | Bergenfield, NJ | 28,282 | 5.8% | $386,900 | 9.0% | 37.6% |
| 24 | Mays Landing, NJ | 6,555 | 4.9% | $219,600 | 18.0% | 27.6% |
| 25 | Trenton, NJ | 90,097 | 27.7% | $96,700 | 9.0% | 31.15% |
| 26 | Lincroft, NJ | 6,812 | 2.4% | $591,100 | 20.0% | 39.9% |
| 27 | Holiday City-Berkeley, NJ | 12,889 | 8.7% | $183,000 | 25.0% | 0.44% |
| 28 | Laurence Harbor, NJ | 6,292 | 2.6% | $271,800 | 29.0% | 26.02% |
| 29 | Robertsville, NJ | 12,365 | 2.1% | $544,100 | 13.0% | 44.55% |
| 30 | Ellisburg, NJ | 5,093 | 11.7% | $247,500 | 9.0% | 30.57% |
| 31 | Woodbridge, NJ | 21,314 | 3.7% | $305,400 | 22.0% | 41.43% |
| 32 | Guttenberg, NJ | 11,833 | 14.8% | $316,100 | 5.0% | 28.99% |
| 33 | Yorketown, NJ | 7,316 | 2.2% | $457,700 | 16.0% | 44.35% |
| 34 | Prospect Park, NJ | 6,301 | 17.9% | $296,100 | 11.0% | 45.91% |
| 35 | West New York, NJ | 52,485 | 19.9% | $363,800 | 3.0% | 31.39% |
| 36 | New Brunswick, NJ | 55,671 | 35.3% | $265,700 | 5.0% | 36.97% |
| 37 | Browns Mills, NJ | 10,053 | 12.2% | $165,600 | 16.0% | 28.22% |
| 38 | Elizabeth, NJ | 135,772 | 14.7% | $314,500 | 6.0% | 41.7% |
| 39 | Atlantic City, NJ | 38,481 | 37.0% | $150,900 | 7.0% | 29.49% |
| 40 | Franklin Park, NJ | 13,686 | 7.7% | $279,000 | 11.0% | 31.57% |
| 41 | Princeton Meadows, NJ | 15,491 | 3.6% | $547,200 | 7.0% | 42.78% |
| 42 | Tenafly, NJ | 15,307 | 4.1% | $858,900 | 10.0% | 52.92% |
| 43 | Ridgefield Park, NJ | 13,202 | 10.3% | $388,600 | 10.0% | 37.42% |
| 44 | Upper Montclair, NJ | 12,033 | 1.9% | $797,400 | 15.0% | 45.47% |
| 45 | Rahway, NJ | 29,582 | 8.5% | $293,300 | 16.0% | 29.75% |
| 46 | Old Bridge, NJ | 28,252 | 4.9% | $377,400 | 17.0% | 29.02% |
| 47 | Pine Hill, NJ | 10,637 | 12.9% | $144,100 | 18.0% | 28.1% |
| 48 | Glen Ridge, NJ | 7,764 | 1.3% | $674,800 | 21.0% | 49.9% |
| 49 | East Franklin, NJ | 8,375 | 12.5% | $280,200 | 5.0% | 38.02% |
| 50 | Spotswood, NJ | 8,163 | 2.9% | $317,700 | 29.0% | 27.72% |
| 51 | Sayreville, NJ | 45,062 | 5.3% | $334,600 | 15.0% | 31.58% |
| 52 | Haledon, NJ | 8,936 | 7.3% | $303,600 | 12.0% | 38.54% |
| 53 | Berlin, NJ | 7,484 | 2.2% | $246,500 | 20.0% | 33.73% |
| 54 | Hackett, NJ | 10,221 | 8.4% | $290,100 | 23.0% | 36.68% |
| 55 | Kearny, NJ | 41,790 | 10.2% | $359,800 | 10.0% | 35.01% |
| 56 | Glen Rock, NJ | 12,098 | 1.5% | $695,300 | 19.0% | 52.37% |
| 57 | Madison Park, NJ | 8,014 | 13.6% | $320,400 | 12.0% | 37.24% |
| 58 | Chatham, NJ | 9,208 | 1.1% | $827,900 | 23.0% | 47.88% |
| 59 | South River, NJ | 16,087 | 12.4% | $322,200 | 21.0% | 33.95% |
| 60 | Williamstown, NJ | 14,947 | 6.1% | $204,300 | 27.0% | 33.28% |
| 61 | Palmyra, NJ | 7,429 | 8.3% | $175,400 | 12.0% | 23.59% |
| 62 | Union Beach, NJ | 5,781 | 2.8% | $310,200 | 23.0% | 28.69% |
| 63 | Wharton, NJ | 7,175 | 14.4% | $307,200 | 10.0% | 35.49% |
| 64 | Ocean Acres, NJ | 17,886 | 2.4% | $282,800 | 36.0% | 37.47% |
| 65 | Twin Rivers, NJ | 8,049 | 3.3% | $235,000 | 13.0% | 35.12% |
| 66 | Englewood Cliffs, NJ | 5,358 | 2.4% | $1,159,200 | 13.0% | 36.38% |
| 67 | Woodcliff Lake, NJ | 6,112 | 2.6% | $845,900 | 18.0% | 41.27% |
| 68 | Ramblewood, NJ | 6,340 | 2.7% | $306,500 | 19.0% | 34.26% |
| 69 | Woodbury, NJ | 10,067 | 14.8% | $165,300 | 17.0% | 28.97% |
| 70 | Jamesburg, NJ | 5,784 | 6.1% | $285,900 | 22.0% | 34.09% |
| 71 | Iselin, NJ | 17,684 | 4.8% | $328,400 | 12.0% | 33.35% |
| 72 | Glendora, NJ | 5,511 | 6.4% | $171,900 | 26.0% | 26.22% |
| 73 | Belle Mead, NJ | 5,754 | 3.7% | $586,000 | 10.0% | 64.24% |
| 74 | Bayonne, NJ | 70,553 | 11.1% | $359,800 | 16.0% | 32.57% |
| 75 | Bogota, NJ | 8,830 | 3.9% | $349,600 | 13.0% | 32.37% |
| 76 | Lincoln Park, NJ | 10,877 | 1.5% | $353,500 | 24.0% | 26.79% |
| 77 | Stratford, NJ | 6,967 | 10.3% | $184,700 | 19.0% | 29.02% |
| 78 | Ridgefield, NJ | 11,477 | 4.3% | $457,300 | 10.0% | 33.85% |
| 79 | Fords, NJ | 12,897 | 4.2% | $327,800 | 19.0% | 33.82% |
| 80 | Washington, NJ | 7,172 | 9.0% | $184,400 | 26.0% | 29.12% |
| 81 | Paulsboro, NJ | 6,234 | 9.9% | $135,900 | 19.0% | 20.52% |
| 82 | Somerdale, NJ | 5,476 | 14.2% | $183,300 | 24.0% | 32.32% |
| 83 | Crestwood Village, NJ | 8,414 | 11.5% | $69,600 | 18.0% | 0.65% |
| 84 | Budd Lake, NJ | 9,971 | 7.6% | $364,200 | 23.0% | 47.19% |
| 85 | Ringwood, NJ | 11,778 | 1.9% | $370,900 | 28.0% | 31.83% |
| 86 | Summit, NJ | 22,598 | 6.3% | $852,300 | 13.0% | 42.82% |
| 87 | Kenilworth, NJ | 8,377 | 8.3% | $384,700 | 23.0% | 36.48% |
| 88 | South Plainfield, NJ | 24,251 | 3.3% | $362,200 | 26.0% | 37.23% |
| 89 | Gloucester City, NJ | 11,438 | 11.2% | $140,400 | 30.0% | 35.37% |
| 90 | Pomona, NJ | 8,340 | 8.3% | $196,700 | 18.0% | 44.0% |
| 91 | Leisure Village, NJ | 6,001 | 24.3% | $111,100 | 14.0% | 8.32% |
| 92 | Pitman, NJ | 8,812 | 4.3% | $195,100 | 30.0% | 27.42% |
| 93 | Hammonton, NJ | 14,695 | 10.7% | $258,300 | 23.0% | 30.55% |
| 94 | Lodi, NJ | 25,983 | 10.8% | $393,500 | 11.0% | 34.68% |
| 95 | Fairview, NJ | 14,918 | 14.9% | $429,600 | 4.0% | 18.21% |
| 96 | Fanwood, NJ | 7,727 | 2.0% | $498,400 | 24.0% | 38.13% |
| 97 | Ramtown, NJ | 6,540 | 0.7% | $368,300 | 32.0% | 42.13% |
| 98 | Phillipsburg, NJ | 15,146 | 16.6% | $149,600 | 20.0% | 27.97% |
| 99 | New Milford, NJ | 16,912 | 4.9% | $442,000 | 15.0% | 35.72% |
| 100 | Pine Lake Park, NJ | 9,148 | 3.3% | $281,100 | 35.0% | 39.67% |
I moved to Plainfield when I was two and lived in a big Victorian house w/ my 4 siblings, maternal grandmother, and parents. My parents had marital problems, etc. Lived there until age seven. A hard but happy family life. It was the best, most memorable place I lived in, and I’ve moved a lot. We knew all our neighbors. Plainfield used to be a “grand” place to live, including the downtown district. My paternal grandparents lived there a while also. Wonderful memories too numerous to go into…a shame about the deterioration, crime, etc. That’s partly why we had to move (to North Plainfield)! 🙂
The deterioration of these most vibrant cities is a shame. Over the past decades their downfall was evident as lower income people became the majority within their confines. The government assisted this movement with outreach programs to these groups.
Clinton talks of helping the Low income people if elected. How convenient to create the problem then offer to repair it.
Is there anyway we can get a statistic on the funniest cities in New Jersey?
Keansburg- where even the babies have tattoos. Not in agreement re Bayonne, though. It still has some restaurants that attract people from other towns. That should have been a criteria; does this town have a restaurant ( or any other attraction) that people from other towns would go to?