
Do you live in one of the most miserable places in Virginia?
Only a third of Virginians say they are truly happy. That’s too bad, considering that folks in Virginia don’t really have it too bad in the grand scheme of things.
But, we were curious – which Virginia cities might be the most miserable? We’re about to find out, using Saturday Night Science and data.
After analyzing the 63 largest cities, we sadly present the most miserable cities in the Old Dominion.
Table Of Contents: Top Ten | Methodology | Summary | Table
The 10 Most Miserable Places In Virginia
Read on below to see how we crunched the numbers and how your town ranked. If you have a smile on your face, you probably don’t live in one of these cities.
Oh, and by the way, Blacksburg is the happiest place in Virginia.
For more Virginia reading, check out:
The 10 Most Miserable Places In Virginia For 2023
/10
Population: 5,669
Poverty Level: 14.1%
Median Home Price $226,100
Married Households 9.0%
Households With Kids 59.1%
More on Dumfries: Data | Crime | Cost Of Living

/10
Population: 17,081
Poverty Level: 4.4%
Median Home Price $330,200
Married Households 8.0%
Households With Kids 41.82%
More on Manassas Park: Data | Crime | Cost Of Living
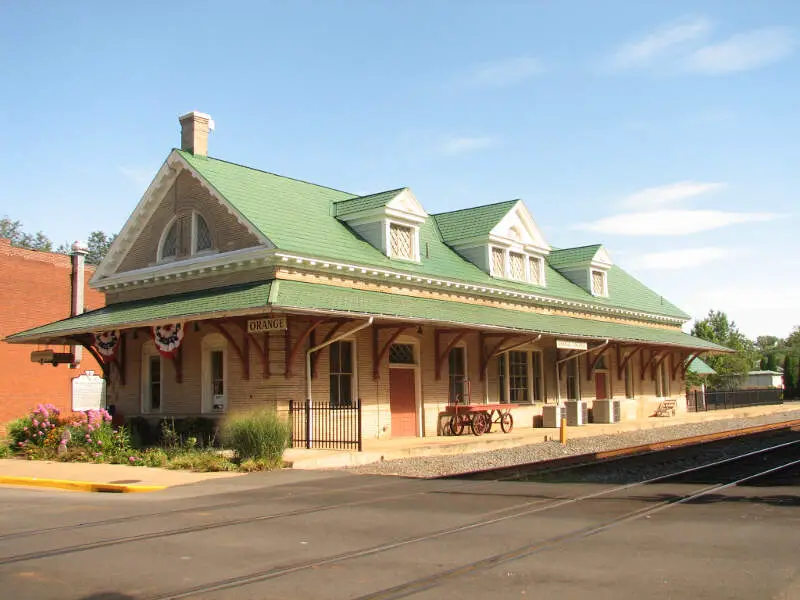
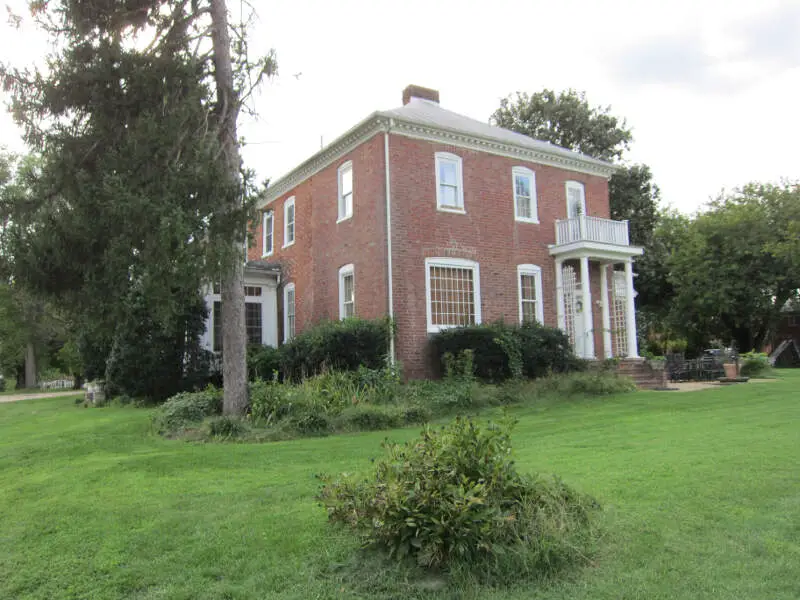
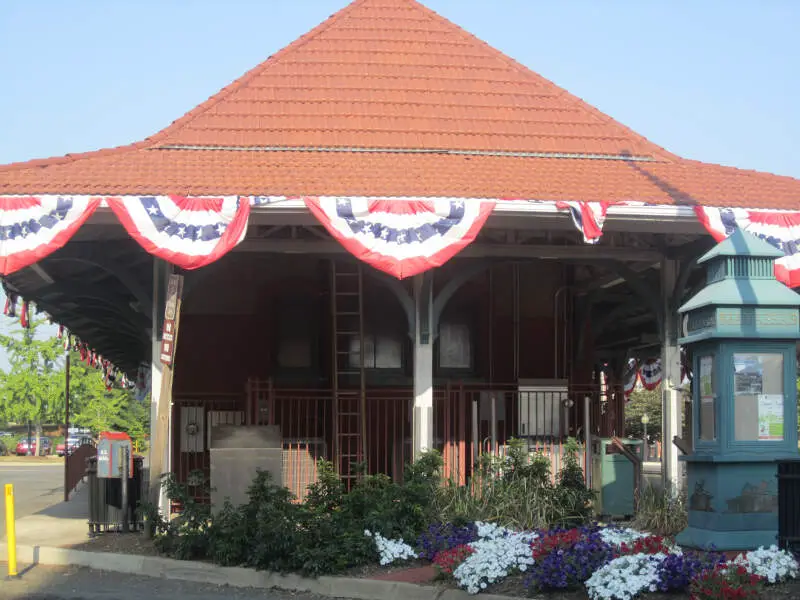
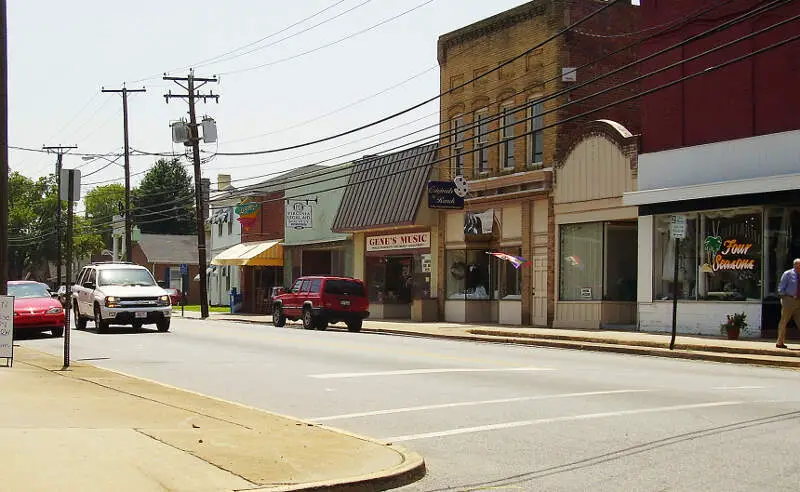
/10
Population: 5,012
Poverty Level: 15.7%
Median Home Price $219,500
Married Households 18.0%
Households With Kids 33.74%
More on Orange: Data | Crime | Cost Of Living

/10
Population: 23,020
Poverty Level: 24.0%
Median Home Price $127,300
Married Households 22.0%
Households With Kids 31.14%
More on Hopewell: Data | Crime | Cost Of Living
/10
Population: 42,596
Poverty Level: 5.6%
Median Home Price $356,500
Married Households 10.0%
Households With Kids 39.21%
More on Manassas: Data | Crime | Cost Of Living
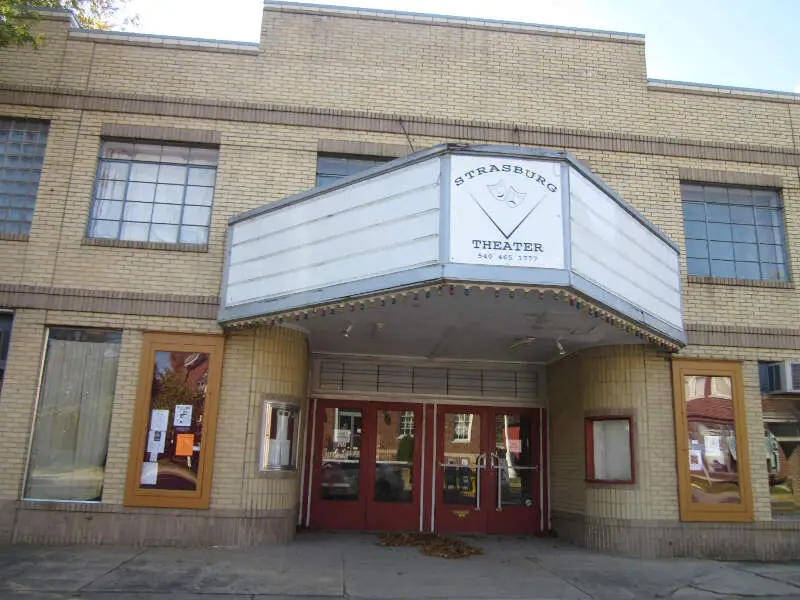
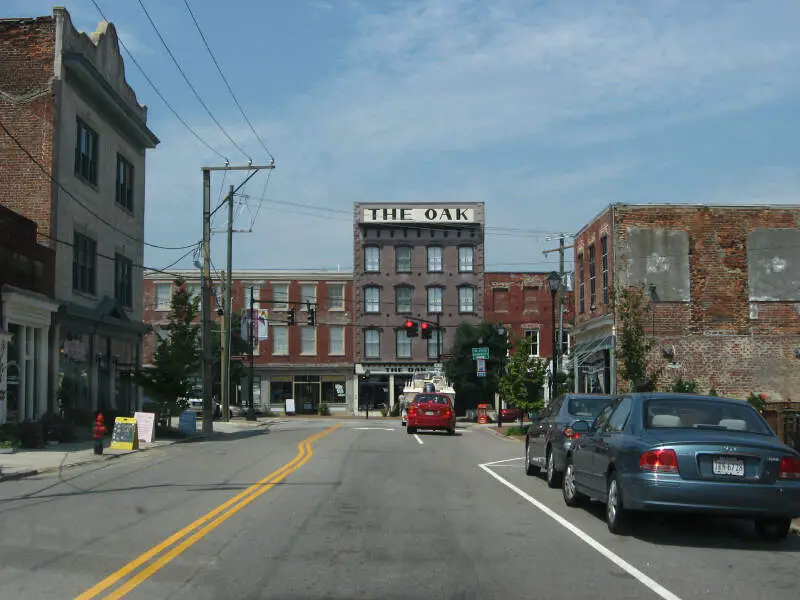
/10
Population: 7,036
Poverty Level: 5.6%
Median Home Price $212,700
Married Households 23.0%
Households With Kids 34.45%
More on Strasburg: Data | Crime | Cost Of Living
/10
Population: 18,127
Poverty Level: 9.0%
Median Home Price $188,900
Married Households 23.0%
Households With Kids 32.14%
More on Colonial Heights: Data | Crime | Cost Of Living
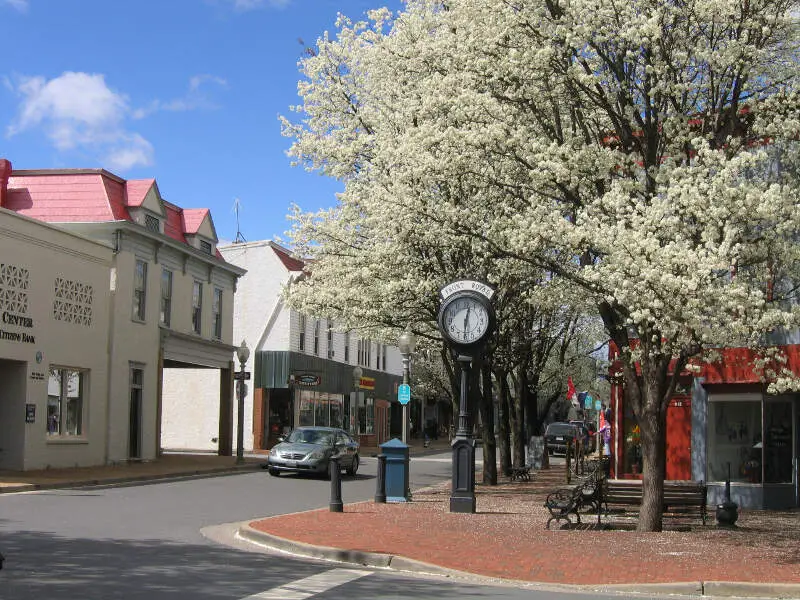
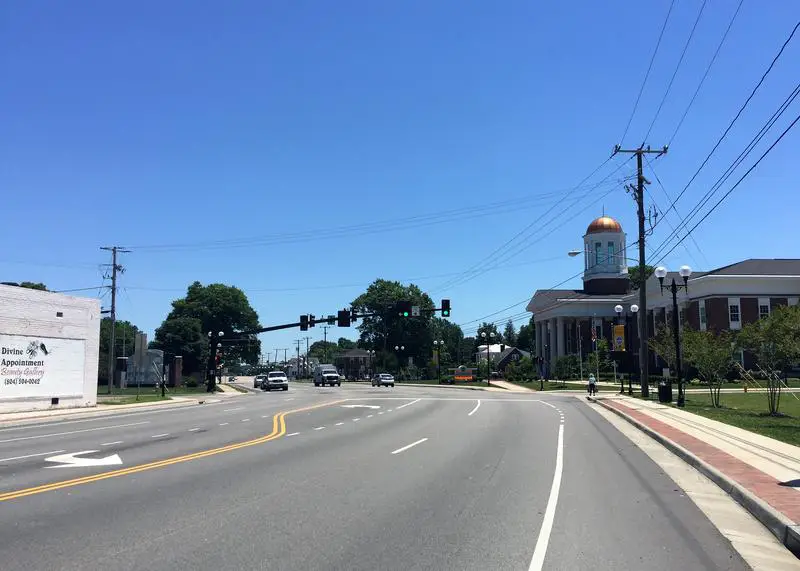
/10
Population: 15,039
Poverty Level: 14.5%
Median Home Price $237,800
Married Households 23.0%
Households With Kids 30.76%
More on Front Royal: Data | Crime | Cost Of Living
/10
Population: 33,229
Poverty Level: 21.3%
Median Home Price $119,200
Married Households 12.0%
Households With Kids 20.86%
More on Petersburg: Data | Crime | Cost Of Living
/10
Population: 5,761
Poverty Level: 21.5%
Median Home Price $104,500
Married Households 24.0%
Households With Kids 32.14%
More on Emporia: Data | Crime | Cost Of Living
Methodology: How We Measured The Most Miserable Cities In The Old Dominion
To rank the unhappiest places in Virginia, we had to determine what criteria make people happy. It isn’t a stretch to assume that happy people earn great salaries, are relatively stress-free, and have a stable home life.
So we went to the Census’s American Community Survey 2017-2021 report for the happy criteria, flipped the list with Saturday Night Science, and it spit out the answer.
Like magic.
Here are the criteria we used to measure misery:
- Percentage of residents with a college degree
- Average commute times
- Unemployment rates
- Cost of living
- % of married couples
- % of families with kids
- Poverty rate
After we decided on the criteria, we gathered the data for the 63 places in Virginia with over 5,000 people.
We then ranked each place from one to 63 for each of the seven criteria, with a score of one being the most miserable (Any ties were given to the larger place).
Next, we averaged the seven rankings into a Miserable Index for each place with the lowest overall Miserable Index “earning” the title “Most Miserable City In Virginia.”
If you’d like to see the complete list of states, most miserable to happiest, scroll to the bottom of this post to see the unabridged chart.
We updated this article for 2023, and it’s our tenth time ranking the most miserable cities in Virginia.
There You Have It – The Least Happy Cities In Virginia
As we said earlier, trying to determine the most miserable cities in Virginia is usually a subjective matter.
But if you’re analyzing cities where people are not stable, where you’re stuck in traffic, and no one spent the time to go to college, then this is an accurate list.
If you’re curious enough, here are the happiest cities in Virginia, according to science:
- Blacksburg
- Lexington
- Charlottesville
For more Virginia reading, check out:
- Best Places To Live In Virginia
- Cheapest Places To Live In Virginia
- Most Dangerous Cities In Virginia
- Richest Cities In Virginia
- Safest Places In Virginia
- Worst Cities In Virginia For 2017
- Most Expensive Places To Live In Virginia
Miserable Cities In Virginia For 2023
| Rank | City | Population | Poverty Level | Median Home Value | % Married | % Kids |
|---|---|---|---|---|---|---|
| 1 | Dumfries, VA | 5,669 | 14.1% | $226,100 | 9.0% | 59.1% |
| 2 | Manassas Park, VA | 17,081 | 4.4% | $330,200 | 8.0% | 41.82% |
| 3 | Orange, VA | 5,012 | 15.7% | $219,500 | 18.0% | 33.74% |
| 4 | Hopewell, VA | 23,020 | 24.0% | $127,300 | 22.0% | 31.14% |
| 5 | Manassas, VA | 42,596 | 5.6% | $356,500 | 10.0% | 39.21% |
| 6 | Strasburg, VA | 7,036 | 5.6% | $212,700 | 23.0% | 34.45% |
| 7 | Colonial Heights, VA | 18,127 | 9.0% | $188,900 | 23.0% | 32.14% |
| 8 | Front Royal, VA | 15,039 | 14.5% | $237,800 | 23.0% | 30.76% |
| 9 | Petersburg, VA | 33,229 | 21.3% | $119,200 | 12.0% | 20.86% |
| 10 | Emporia, VA | 5,761 | 21.5% | $104,500 | 24.0% | 32.14% |
| 11 | Suffolk, VA | 93,268 | 9.6% | $273,600 | 23.0% | 33.1% |
| 12 | Franklin, VA | 8,249 | 19.8% | $178,800 | 26.0% | 33.05% |
| 13 | Culpeper, VA | 19,740 | 9.7% | $304,100 | 17.0% | 38.69% |
| 14 | Big Stone Gap, VA | 5,280 | 18.9% | $141,600 | 26.0% | 29.1% |
| 15 | Portsmouth, VA | 97,454 | 17.2% | $182,700 | 18.0% | 29.87% |
| 16 | Newport News, VA | 185,069 | 15.8% | $204,900 | 13.0% | 29.51% |
| 17 | Falls Church, VA | 14,494 | 2.5% | $838,300 | 7.0% | 36.09% |
| 18 | Woodstock, VA | 5,716 | 23.1% | $226,100 | 19.0% | 31.11% |
| 19 | Chesapeake, VA | 247,172 | 8.0% | $291,700 | 20.0% | 38.15% |
| 20 | Hampton, VA | 136,748 | 14.4% | $191,000 | 16.0% | 29.15% |
| 21 | Purcellville, VA | 8,910 | 4.5% | $514,900 | 15.0% | 47.4% |
| 22 | Leesburg, VA | 48,223 | 3.6% | $490,500 | 9.0% | 44.98% |
| 23 | Vienna, VA | 16,465 | 3.7% | $827,800 | 7.0% | 44.41% |
| 24 | Herndon, VA | 24,574 | 7.3% | $470,200 | 5.0% | 38.19% |
| 25 | Norfolk, VA | 238,556 | 17.4% | $223,300 | 12.0% | 28.75% |
| 26 | Vinton, VA | 8,039 | 11.3% | $149,800 | 25.0% | 30.82% |
| 27 | Virginia Beach, VA | 457,658 | 7.8% | $295,900 | 13.0% | 33.1% |
| 28 | South Boston, VA | 8,011 | 22.9% | $142,000 | 17.0% | 30.81% |
| 29 | Danville, VA | 42,556 | 23.1% | $91,800 | 21.0% | 22.21% |
| 30 | Roanoke, VA | 99,578 | 18.4% | $140,600 | 18.0% | 23.46% |
| 31 | Covington, VA | 5,716 | 15.8% | $69,800 | 37.0% | 33.22% |
| 32 | Galax, VA | 6,681 | 21.9% | $100,000 | 24.0% | 26.83% |
| 33 | Richlands, VA | 5,300 | 27.8% | $94,800 | 38.0% | 20.45% |
| 34 | Staunton, VA | 25,358 | 12.3% | $179,900 | 22.0% | 25.89% |
| 35 | Martinsville, VA | 13,476 | 25.4% | $77,600 | 19.0% | 23.5% |
| 36 | Ashland, VA | 7,478 | 16.9% | $210,100 | 15.0% | 28.35% |
| 37 | Bluefield, VA | 5,079 | 16.2% | $136,200 | 15.0% | 30.38% |
| 38 | Fairfax, VA | 23,980 | 10.1% | $596,800 | 8.0% | 30.81% |
| 39 | Warrenton, VA | 10,002 | 6.2% | $363,000 | 16.0% | 29.43% |
| 40 | Waynesboro, VA | 22,149 | 16.6% | $188,400 | 22.0% | 28.95% |
| 41 | Pulaski, VA | 8,984 | 21.8% | $123,400 | 25.0% | 24.48% |
| 42 | Smithfield, VA | 8,513 | 12.0% | $313,300 | 25.0% | 27.99% |
| 43 | Fredericksburg, VA | 28,027 | 14.3% | $382,400 | 12.0% | 23.41% |
| 44 | Winchester, VA | 28,194 | 13.3% | $270,300 | 15.0% | 27.14% |
| 45 | Lynchburg, VA | 78,973 | 17.6% | $169,000 | 16.0% | 25.44% |
| 46 | Bridgewater, VA | 6,092 | 9.8% | $279,600 | 15.0% | 26.9% |
| 47 | Alexandria, VA | 158,185 | 9.6% | $579,100 | 4.0% | 21.14% |
| 48 | Bristol, VA | 16,996 | 17.7% | $139,000 | 21.0% | 24.65% |
| 49 | Marion, VA | 5,817 | 21.1% | $119,600 | 28.0% | 27.33% |
| 50 | Poquoson, VA | 12,382 | 4.4% | $358,700 | 31.0% | 37.97% |
| 51 | Williamsburg, VA | 15,299 | 15.5% | $328,700 | 8.0% | 20.3% |
| 52 | Radford, VA | 16,205 | 35.4% | $174,700 | 13.0% | 21.3% |
| 53 | Salem, VA | 25,335 | 10.0% | $205,900 | 26.0% | 29.43% |
| 54 | Harrisonburg, VA | 52,062 | 25.8% | $231,300 | 9.0% | 29.08% |
| 55 | Richmond, VA | 225,676 | 19.8% | $263,000 | 13.0% | 20.18% |
| 56 | Buena Vista, VA | 6,649 | 21.4% | $123,100 | 32.0% | 28.24% |
| 57 | Abingdon, VA | 8,350 | 15.5% | $170,800 | 25.0% | 21.38% |
| 58 | Wytheville, VA | 8,260 | 25.8% | $163,100 | 25.0% | 23.79% |
| 59 | Farmville, VA | 7,266 | 26.9% | $204,900 | 7.0% | 16.55% |
| 60 | Christiansburg, VA | 23,174 | 12.9% | $205,000 | 24.0% | 28.75% |
| 61 | Charlottesville, VA | 46,597 | 23.1% | $355,800 | 12.0% | 22.66% |
| 62 | Lexington, VA | 7,287 | 22.8% | $251,500 | 6.0% | 16.91% |
| 63 | Blacksburg, VA | 44,385 | 45.2% | $335,200 | 5.0% | 18.17% |