
Do you live in one of the murder capitals of Illinois?
We all watch the news with horror when we hear about a homicide that happens not that far away from us. While a murder just blocks or even a couple of towns away from your house would make anyone uneasy, in the long run, most likely, where you live is relatively safe.
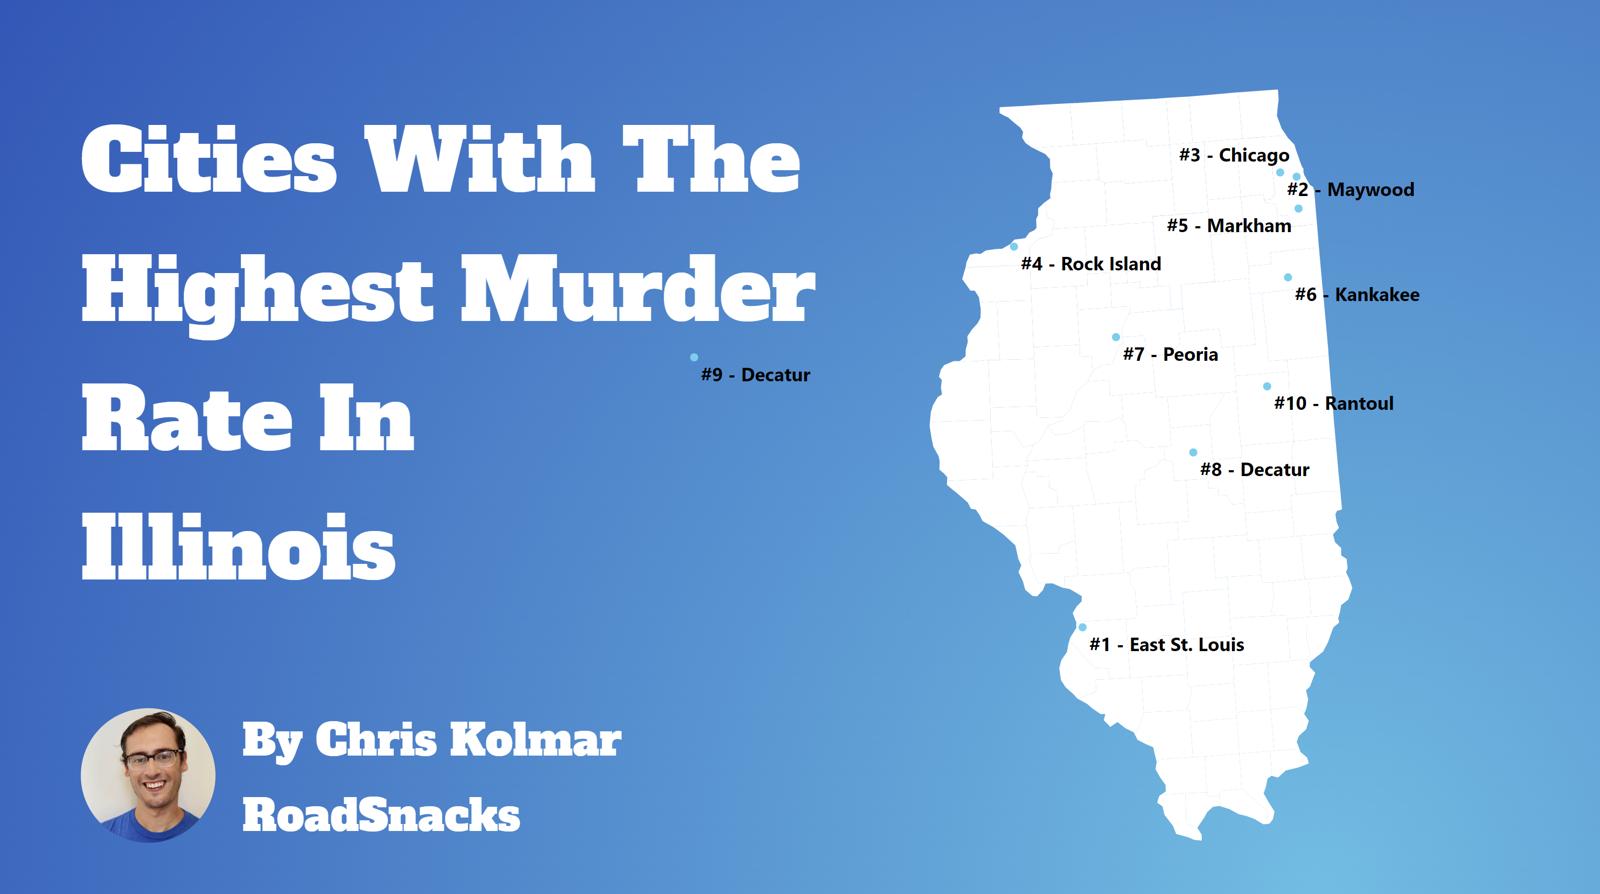
To find the cities in Illinois with the most murders and the highest murder rates per capita, we used Saturday Night Science to compare the FBI crime data on murders for the 81 cities in the Prairie State with over 6,000 residents.
Table Of Contents: Top Ten | Methodology | Summary | Table
Cities With Highest Murder Rates In Illinois
What city has the highest murder rate in Illinois? The city with the highest murder rate in Illinois is Riverdale with 69.9 murders per 100,000 people.
What is the city in Illinois with highest number of murders? The city in Illinois with the highest number of murders is Chicago with 461 murders.
Read on below to see how we crunched the numbers and how your town in Illinois ranked. There were ‘only’ 81 cities in Illinois where a city reported a murder to the FBI, meaning 203 places had no murder.
For more reading on the Prairie State check out:
- Best Places To Live In Illinois
- Cheapest Places To Live In Illinois
- Most Dangerous Cities In Illinois
The 10 Murder Capitals Of Illinois For 2026

/10
Population: 10,009
Murders: 7 (5th Most)
Murders Per 100k: 69.9 (Most)
More on Riverdale: Data | Crime | Cost Of Living | Movers

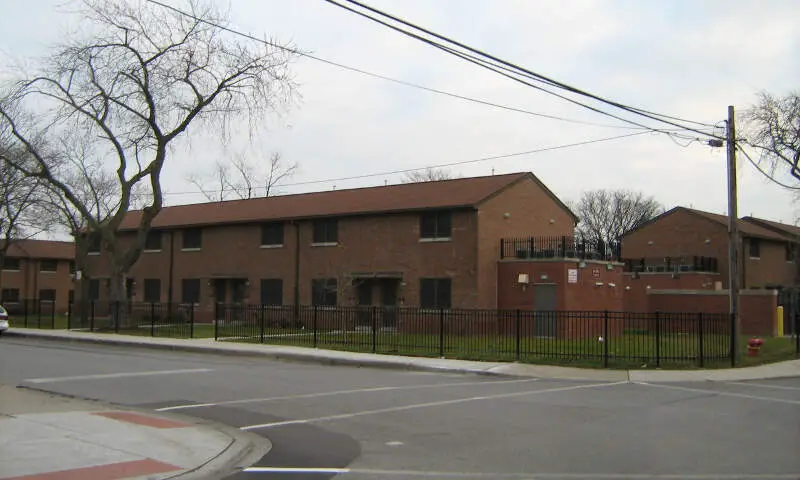
/10
Population: 13,460
Murders: 4 (14th Most)
Murders Per 100k: 29.7 (2nd Most)
More on Forest Park: Data | Crime | Cost Of Living | Movers


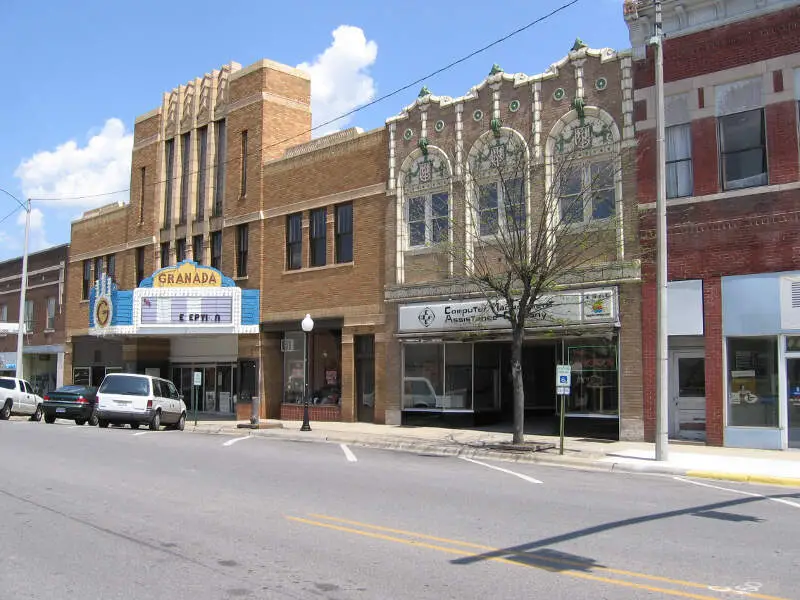
/10
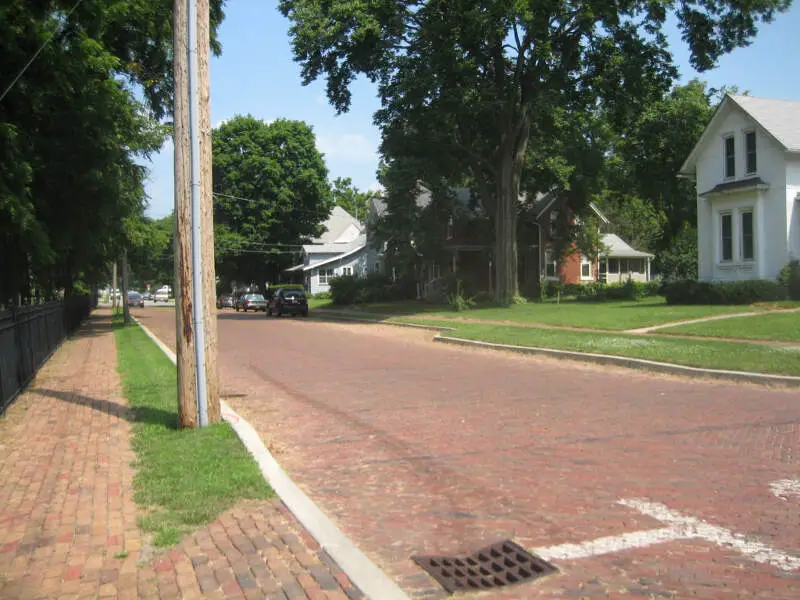
Population: 10,538
Murders: 3 (22nd Most)
Murders Per 100k: 28.5 (3rd Most)
More on Mahomet: Data | Crime | Cost Of Living | Movers

/10
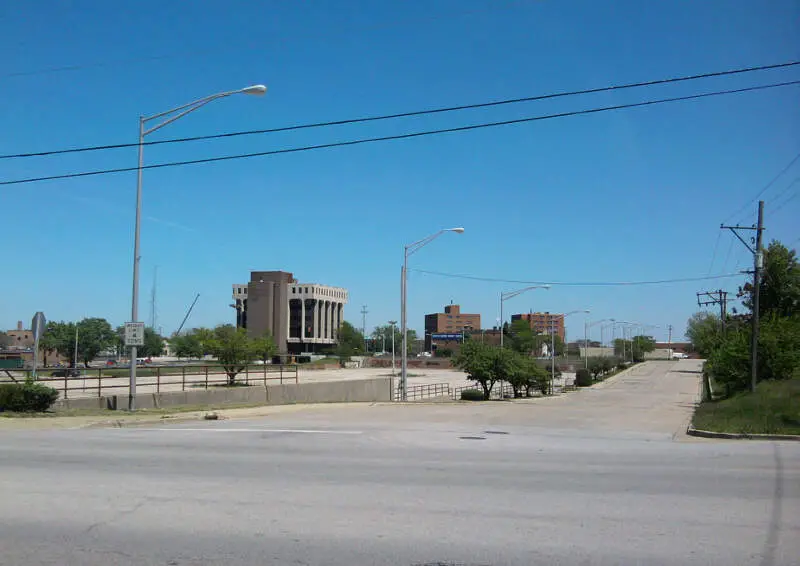
Population: 14,146
Murders: 4 (14th Most)
Murders Per 100k: 28.3 (4th Most)
More on Mount Vernon: Data | Crime | Cost Of Living | Movers

/10
Population: 8,150
Murders: 2 (37th Most)
Murders Per 100k: 24.5 (5th Most)
More on Glenwood: Data | Crime | Cost Of Living | Movers

/10
Population: 9,360
Murders: 2 (37th Most)
Murders Per 100k: 21.4 (6th Most)
More on Sauk Village: Data | Crime | Cost Of Living | Movers

/10
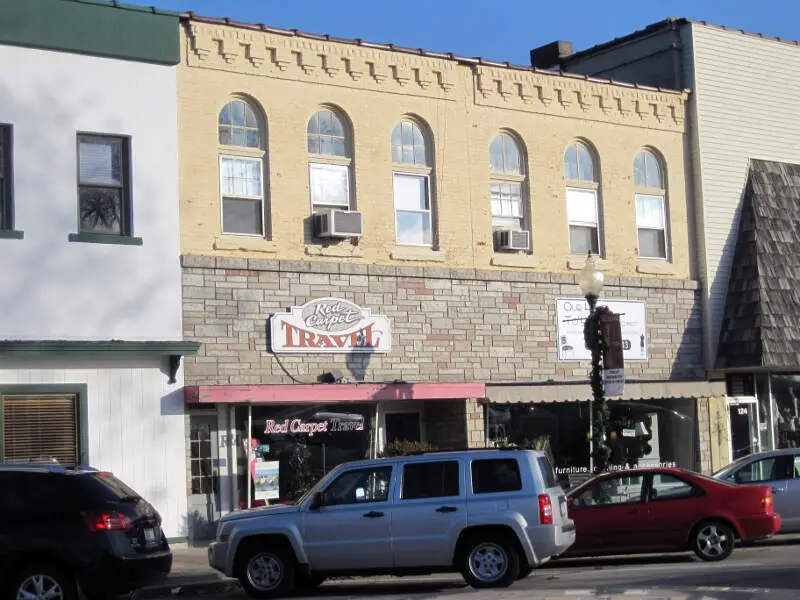
Population: 14,400
Murders: 3 (22nd Most)
Murders Per 100k: 20.8 (7th Most)
More on Sterling: Data | Crime | Cost Of Living | Movers

/10
Population: 14,608
Murders: 3 (22nd Most)
Murders Per 100k: 20.5 (8th Most)
More on Morris: Data | Crime | Cost Of Living | Movers

/10
Population: 25,802
Murders: 5 (9th Most)
Murders Per 100k: 19.4 (9th Most)
More on Chicago Heights: Data | Crime | Cost Of Living | Movers

/10
Population: 10,455
Murders: 2 (37th Most)
Murders Per 100k: 19.1 (10th Most)
More on Summit: Data | Crime | Cost Of Living | Movers
Methodology: How we calculated the murder capitals of Illinois
While there are surveys and public polls on what cities in a state are the most dangerous, we wanted to rely on something other than speculation and opinion. Instead, we used Saturday Night Science to compare the hard numbers from the FBI’s last year of reporting. Specifically, we analyzed the FBI’s Uniform Crime Report, which summarizes the number of murders in each city annually.
We only looked at every single city in Illinois for which FBI data was available for the most recent FBI Crime In The United States. That left us with 81 cities to rank.
We took the number of murders per capita as the ranking factor. The place with the most murders per capita based on the most recent data is Riverdale. It is our eleventh time ranking the places with the most murders per capita in Illinois. We updated the list for 2026.
Summary: The Places With The Most Murders In Illinois For 2026
If you’re looking at the places in Illinois with the most murders, and where residents have the highest chances of being killed themselves, this is an accurate list. Again, these statistics are an indication of where crimes occur, not a statement about the effectiveness of the law enforcement in the areas they serve.
The cities with the highest murder per capita in Illinois are Riverdale, Forest Park, Mahomet, Mount Vernon, Glenwood, Sauk Village, Sterling, Morris, Chicago Heights, and Summit.
For more Illinois reading, check out:
- Best Places To Raise A Family In Illinois
- Fastest Growing Cities In Illinois
- Safest Places In Illinois
- Best Cities For Singles In Illinois
- Worst Places To Live In Illinois
Murder Rates By City In Illinois
| Rank | City | Population | Murders | Murders/100K |
|---|---|---|---|---|
| 1 | Riverdale, IL | 10009 | 7 | 69.94 |
| 2 | Forest Park, IL | 13460 | 4 | 29.72 |
| 3 | Mahomet, IL | 10538 | 3 | 28.47 |
| 4 | Mount Vernon, IL | 14146 | 4 | 28.28 |
| 5 | Glenwood, IL | 8150 | 2 | 24.54 |
| 6 | Sauk Village, IL | 9360 | 2 | 21.37 |
| 7 | Sterling, IL | 14400 | 3 | 20.83 |
| 8 | Morris, IL | 14608 | 3 | 20.54 |
| 9 | Chicago Heights, IL | 25802 | 5 | 19.38 |
| 10 | Summit, IL | 10455 | 2 | 19.13 |
| 11 | Country Club Hills, IL | 15787 | 3 | 19.0 |
| 12 | Chicago, IL | 2638698 | 461 | 17.47 |
| 13 | Belleville, IL | 40225 | 6 | 14.92 |
| 14 | Park Forest, IL | 20487 | 3 | 14.64 |
| 15 | Murphysboro, IL | 6924 | 1 | 14.44 |
| 16 | Blue Island, IL | 21179 | 3 | 14.16 |
| 17 | Bradley, IL | 15224 | 2 | 13.14 |
| 18 | Freeport, IL | 22888 | 3 | 13.11 |
| 19 | Rockford, IL | 145280 | 19 | 13.08 |
| 20 | Peoria, IL | 109677 | 14 | 12.76 |
| 21 | Zion, IL | 24068 | 3 | 12.46 |
| 22 | Alton, IL | 24809 | 3 | 12.09 |
| 23 | Moline, IL | 41659 | 5 | 12.0 |
| 24 | Rock Falls, IL | 8545 | 1 | 11.7 |
| 25 | Jacksonville, IL | 17122 | 2 | 11.68 |
| 26 | Bellwood, IL | 17623 | 2 | 11.35 |
| 27 | South Holland, IL | 20192 | 2 | 9.9 |
| 28 | Barrington, IL | 10402 | 1 | 9.61 |
| 29 | Geneva, IL | 21056 | 2 | 9.5 |
| 30 | Carbondale, IL | 21494 | 2 | 9.3 |
| 31 | Villa Park, IL | 21570 | 2 | 9.27 |
| 32 | Woodridge, IL | 33387 | 3 | 8.99 |
| 33 | Melrose Park, IL | 23327 | 2 | 8.57 |
| 34 | Rantoul, IL | 11835 | 1 | 8.45 |
| 35 | Northlake, IL | 12100 | 1 | 8.26 |
| 36 | Richton Park, IL | 12187 | 1 | 8.21 |
| 37 | Springfield, IL | 111965 | 9 | 8.04 |
| 38 | West Chicago, IL | 24968 | 2 | 8.01 |
| 39 | Plano, IL | 12942 | 1 | 7.73 |
| 40 | Tinley Park, IL | 53256 | 4 | 7.51 |
| 41 | Vernon Hills, IL | 26629 | 2 | 7.51 |
| 42 | Decatur, IL | 67934 | 5 | 7.36 |
| 43 | McHenry, IL | 28563 | 2 | 7.0 |
| 44 | Galesburg, IL | 28864 | 2 | 6.93 |
| 45 | Highland Park, IL | 30311 | 2 | 6.6 |
| 46 | Warrenville, IL | 15530 | 1 | 6.44 |
| 47 | Mundelein, IL | 31876 | 2 | 6.27 |
| 48 | Fairview Heights, IL | 15948 | 1 | 6.27 |
| 49 | Mattoon, IL | 16464 | 1 | 6.07 |
| 50 | Oak Park, IL | 51306 | 3 | 5.85 |
| 51 | Waukegan, IL | 87155 | 5 | 5.74 |
| 52 | Lemont, IL | 17507 | 1 | 5.71 |
| 53 | Champaign, IL | 89466 | 5 | 5.59 |
| 54 | Rock Island, IL | 35841 | 2 | 5.58 |
| 55 | Sycamore, IL | 18718 | 1 | 5.34 |
| 56 | Harvey, IL | 19121 | 1 | 5.23 |
| 57 | Cicero, IL | 79748 | 4 | 5.02 |
| 58 | Crest Hill, IL | 20020 | 1 | 5.0 |
| 59 | East Moline, IL | 20637 | 1 | 4.85 |
| 60 | East Peoria, IL | 21873 | 1 | 4.57 |
| 61 | Elgin, IL | 112879 | 5 | 4.43 |
| 62 | Normal, IL | 52573 | 2 | 3.8 |
| 63 | Round Lake Beach, IL | 26644 | 1 | 3.75 |
| 64 | Granite City, IL | 26708 | 1 | 3.74 |
| 65 | Lansing, IL | 27309 | 1 | 3.66 |
| 66 | Oak Lawn, IL | 54953 | 2 | 3.64 |
| 67 | Danville, IL | 27905 | 1 | 3.58 |
| 68 | Gurnee, IL | 30041 | 1 | 3.33 |
| 69 | O’Fallon, IL | 31856 | 1 | 3.14 |
| 70 | St. Charles, IL | 32529 | 1 | 3.07 |
| 71 | Streamwood, IL | 37245 | 1 | 2.68 |
| 72 | Wheeling, IL | 37251 | 1 | 2.68 |
| 73 | Urbana, IL | 38204 | 1 | 2.62 |
| 74 | Carol Stream, IL | 38703 | 1 | 2.58 |
| 75 | Downers Grove, IL | 49567 | 1 | 2.02 |
| 76 | Mount Prospect, IL | 53523 | 1 | 1.87 |
| 77 | Orland Park, IL | 56593 | 1 | 1.77 |
| 78 | Palatine, IL | 63960 | 1 | 1.56 |
| 79 | Bolingbrook, IL | 74177 | 1 | 1.35 |
| 80 | Naperville, IL | 150521 | 1 | 0.66 |
| 81 | Aurora, IL | 176688 | 1 | 0.57 |