
Do you live in one of the murder capitals of New Jersey?
We all watch the news with horror when we hear about a homicide that happens not that far away from us. While a murder just blocks or even a couple of towns away from your house would make anyone uneasy, in the long run, most likely, where you live is relatively safe.
To find the cities in New Jersey with the most murders and the highest murder rates per capita, we used Saturday Night Science to compare the FBI crime data on murders for the 58 cities in the Garden State with over 5,000 residents.
Table Of Contents: Top Ten | Methodology | Summary | Table

Cities With Highest Murder Rates In New Jersey
- Camden County Police Department
- Trenton
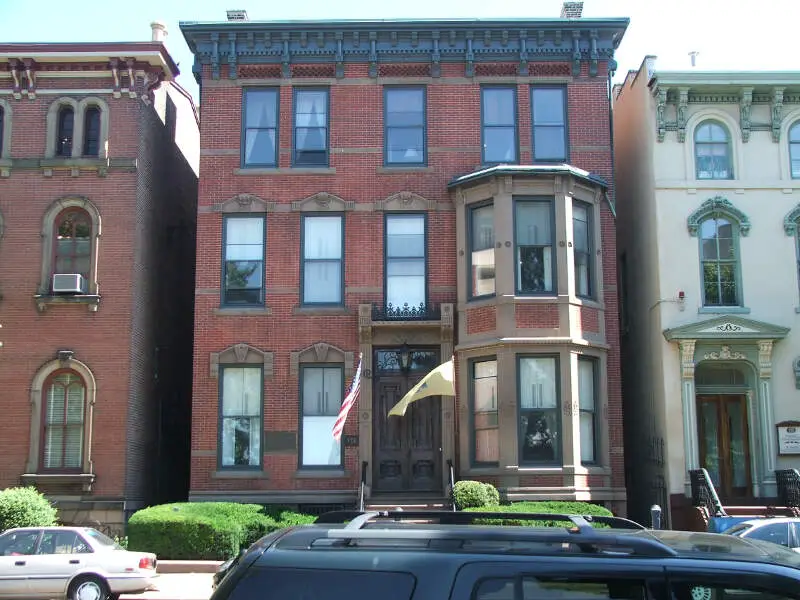
- Woodbury
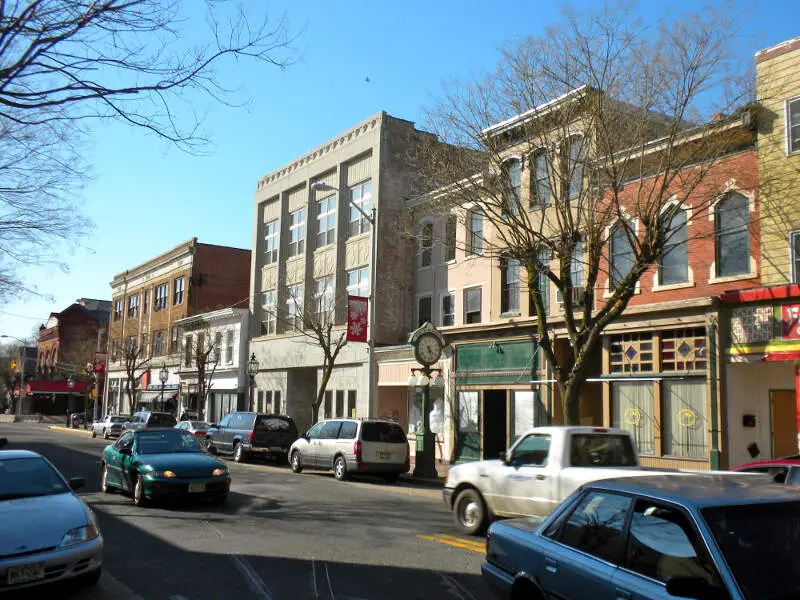
- Bridgeton
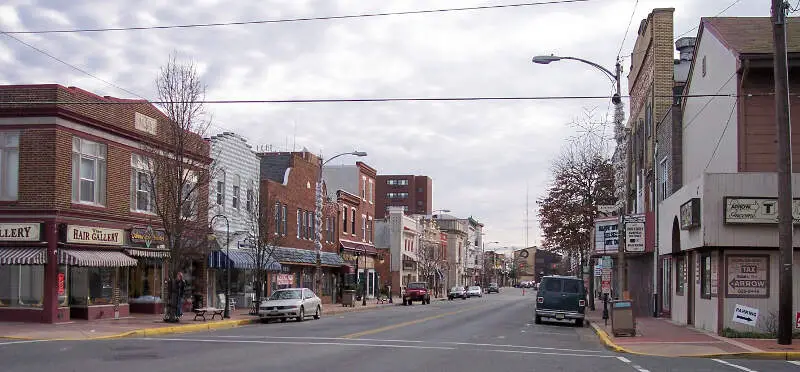
- Millville
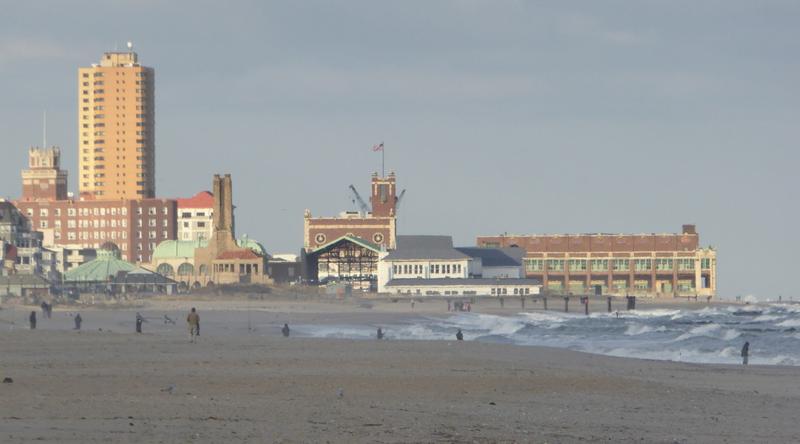
- Asbury Park
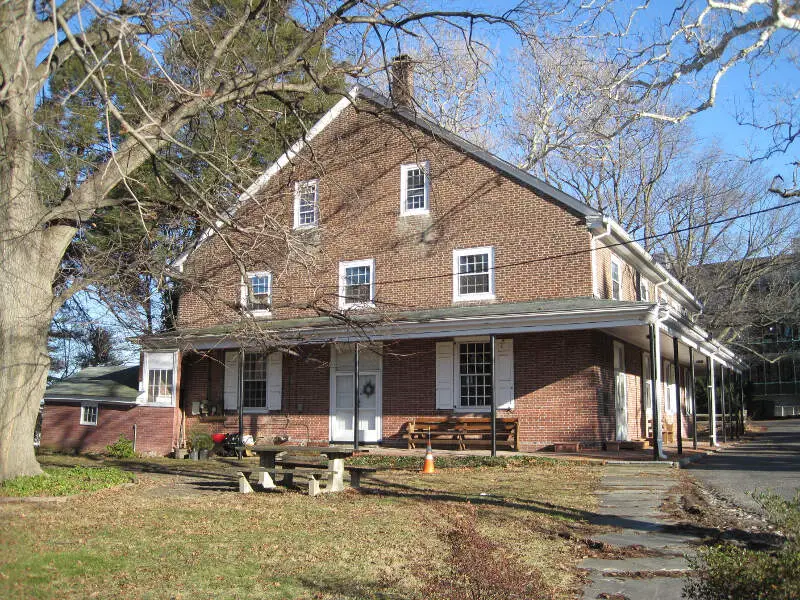
- Salem
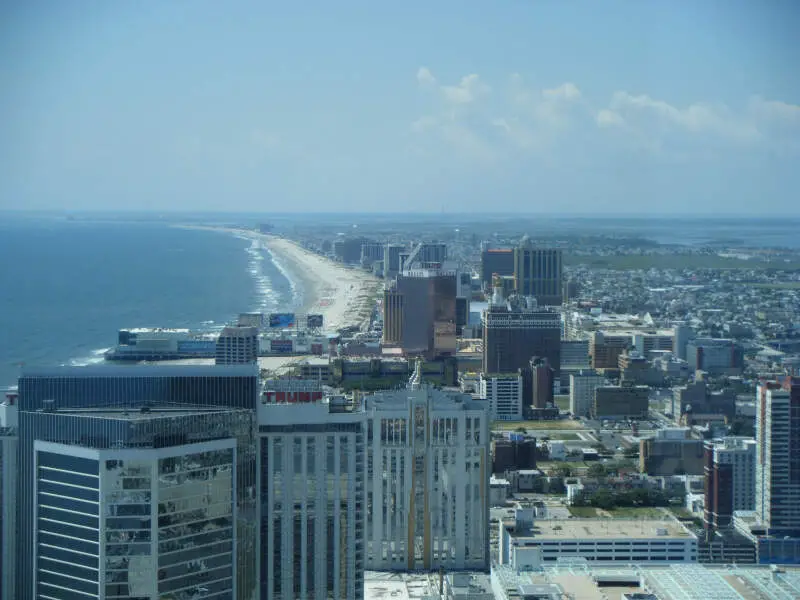
- Atlantic City
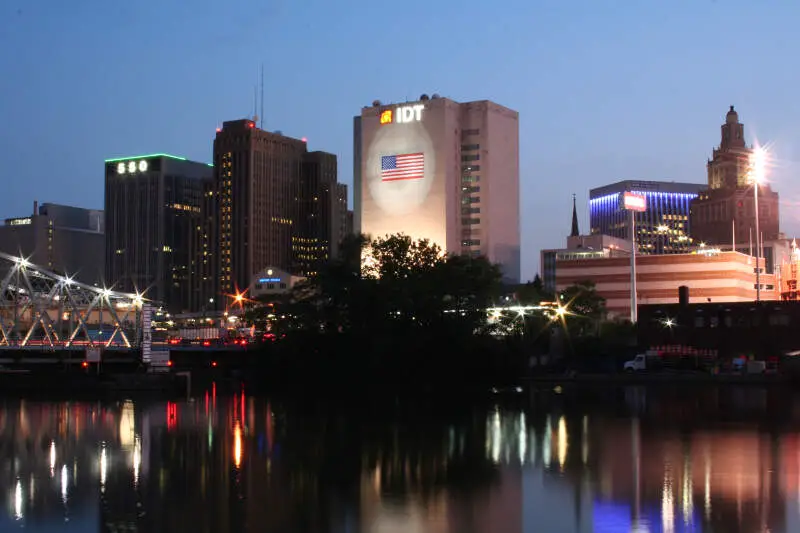
- Newark
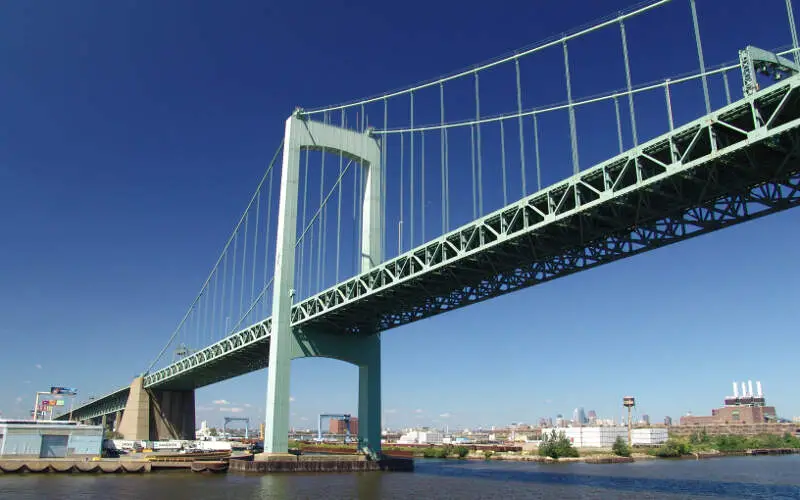
- Gloucester City
What city has the highest murder rate in New Jersey? The city with the highest murder rate in New Jersey is Camden County Police Department with 40.9 murders per 100,000 people.
What is the city in New Jersey with highest number of murders? The city in New Jersey with the highest number of murders is Newark with 53 murders.
Read on below to see how we crunched the numbers and how your town in New Jersey ranked. There were ‘only’ 58 cities in New Jersey where a city reported a murder to the FBI, meaning 264 places had no murder.
For more reading on the Garden State check out:
- Best Places To Live In New Jersey
- Cheapest Places To Live In New Jersey
- Most Dangerous Cities In New Jersey
The 10 Murder Capitals Of New Jersey For 2025
1. Camden County Police Department

Population: 70,875
Murders: 29 (2nd Most)
Murders Per 100k: 40.9 (Most)
More on Camden County Police Department:

/10
Population: 89,509
Murders: 27 (3rd Most)
Murders Per 100k: 30.2 (2nd Most)
More on Trenton: Data

/10
Population: 10,127
Murders: 3 (14th Most)
Murders Per 100k: 29.6 (3rd Most)
More on Woodbury: Data

/10
Population: 26,045
Murders: 7 (7th Most)
Murders Per 100k: 26.9 (4th Most)
More on Bridgeton: Data

/10
Population: 27,260
Murders: 6 (9th Most)
Murders Per 100k: 22.0 (5th Most)
More on Millville: Data

/10
Population: 15,136
Murders: 3 (14th Most)
Murders Per 100k: 19.8 (6th Most)
More on Asbury Park: Data

/10
Population: 5,337
Murders: 1 (42nd Most)
Murders Per 100k: 18.7 (7th Most)
More on Salem: Data

/10
Population: 38,625
Murders: 7 (7th Most)
Murders Per 100k: 18.1 (8th Most)
More on Atlantic City: Data

/10
Population: 303,827
Murders: 53 (Most)
Murders Per 100k: 17.4 (9th Most)
More on Newark: Data
/10
Population: 11,500
Murders: 2 (2Most)
Murders Per 100k: 17.4 (10th Most)
More on Gloucester City: Data
Methodology: How we calculated the murder capitals of New Jersey
While there are surveys and public polls on what cities in a state are the most dangerous, we wanted to rely on something other than speculation and opinion. Instead, we used Saturday Night Science to compare the hard numbers from the FBI’s last year of reporting. Specifically, we analyzed the FBI’s Uniform Crime Report, which summarizes the number of murders in each city annually.
We only looked at every single city in New Jersey for which FBI data was available for the most recent FBI Crime In The United States. That left us with 58 cities to rank.
We took the number of murders per capita as the ranking factor. The place with the most murders per capita based on the most recent data is Camden County Police Department. It is our tenth time ranking the places with the most murders per capita in New Jersey. We updated the list for 2025.
Summary: The Places With The Most Murders In New Jersey For 2025
If you’re looking at the places in New Jersey with the most murders, and where residents have the highest chances of being killed themselves, this is an accurate list. Again, these statistics are an indication of where crimes occur, not a statement about the effectiveness of the law enforcement in the areas they serve.
The cities with the highest murder per capita in New Jersey are Camden County Police Department, Trenton, Woodbury, Bridgeton, Millville, Asbury Park, Salem, Atlantic City, Newark, and Gloucester City.
For more New Jersey reading, check out:
- Best Places To Raise A Family In New Jersey
- Fastest Growing Cities In New Jersey
- Safest Places In New Jersey
- Best Cities For Singles In New Jersey
- Worst Places To Live In New Jersey
Murder Rates By City In New Jersey
| Rank | City | Population | Murders | Murders/100K |
|---|---|---|---|---|
| 1 | Camden County Police Department, NJ | 70875 | 29 | 40.92 |
| 2 | Trenton, NJ | 89509 | 27 | 30.16 |
| 3 | Woodbury, NJ | 10127 | 3 | 29.62 |
| 4 | Bridgeton, NJ | 26045 | 7 | 26.88 |
| 5 | Millville, NJ | 27260 | 6 | 22.01 |
| 6 | Asbury Park, NJ | 15136 | 3 | 19.82 |
| 7 | Salem, NJ | 5337 | 1 | 18.74 |
| 8 | Atlantic City, NJ | 38625 | 7 | 18.12 |
| 9 | Newark, NJ | 303827 | 53 | 17.44 |
| 10 | Gloucester City, NJ | 11500 | 2 | 17.39 |
| 11 | Plainsboro Township, NJ | 23973 | 4 | 16.69 |
| 12 | South Plainfield, NJ | 24286 | 3 | 12.35 |
| 13 | Runnemede, NJ | 8336 | 1 | 12.0 |
| 14 | Cresskill, NJ | 9078 | 1 | 11.02 |
| 15 | Paterson, NJ | 155991 | 15 | 9.62 |
| 16 | Franklin Lakes, NJ | 10920 | 1 | 9.16 |
| 17 | Roselle, NJ | 22266 | 2 | 8.98 |
| 18 | Roxbury Township, NJ | 23285 | 2 | 8.59 |
| 19 | Irvington, NJ | 59729 | 5 | 8.37 |
| 20 | Hasbrouck Heights, NJ | 12028 | 1 | 8.31 |
| 21 | Barnegat Township, NJ | 25488 | 2 | 7.85 |
| 22 | Elizabeth, NJ | 133578 | 10 | 7.49 |
| 23 | Linden, NJ | 43412 | 3 | 6.91 |
| 24 | Ramsey, NJ | 14681 | 1 | 6.81 |
| 25 | New Milford, NJ | 16931 | 1 | 5.91 |
| 26 | Dover, NJ | 18493 | 1 | 5.41 |
| 27 | Belleville, NJ | 37323 | 2 | 5.36 |
| 28 | Harrison, NJ | 20043 | 1 | 4.99 |
| 29 | Pleasantville, NJ | 20694 | 1 | 4.83 |
| 30 | Little Egg Harbor Township, NJ | 21757 | 1 | 4.6 |
| 31 | East Orange, NJ | 68230 | 3 | 4.4 |
| 32 | Manchester Township, NJ | 46818 | 2 | 4.27 |
| 33 | Egg Harbor Township, NJ | 48039 | 2 | 4.16 |
| 34 | Medford Township, NJ | 24666 | 1 | 4.05 |
| 35 | Carteret, NJ | 25208 | 1 | 3.97 |
| 36 | Jersey City, NJ | 285117 | 11 | 3.86 |
| 37 | Neptune Township, NJ | 28238 | 1 | 3.54 |
| 38 | Englewood, NJ | 29038 | 1 | 3.44 |
| 39 | West Windsor Township, NJ | 29751 | 1 | 3.36 |
| 40 | Deptford Township, NJ | 32541 | 1 | 3.07 |
| 41 | Ewing Township, NJ | 33469 | 1 | 2.99 |
| 42 | Passaic, NJ | 68784 | 2 | 2.91 |
| 43 | Franklin Township, Somerset County, NJ | 69175 | 2 | 2.89 |
| 44 | Monroe Township, Gloucester County, NJ | 38174 | 1 | 2.62 |
| 45 | Sayreville, NJ | 45233 | 1 | 2.21 |
| 46 | Hackensack, NJ | 45665 | 1 | 2.19 |
| 47 | Mount Laurel Township, NJ | 46507 | 1 | 2.15 |
| 48 | West New York, NJ | 51884 | 1 | 1.93 |
| 49 | Bloomfield, NJ | 53181 | 1 | 1.88 |
| 50 | Plainfield, NJ | 54791 | 1 | 1.83 |
| 51 | New Brunswick, NJ | 56562 | 1 | 1.77 |
| 52 | Piscataway Township, NJ | 60391 | 1 | 1.66 |
| 53 | Union City, NJ | 64257 | 1 | 1.56 |
| 54 | Gloucester Township, NJ | 66250 | 1 | 1.51 |
| 55 | Bayonne, NJ | 68762 | 1 | 1.45 |
| 56 | Hamilton Township, Mercer County, NJ | 91606 | 1 | 1.09 |
| 57 | Woodbridge Township, NJ | 103449 | 1 | 0.97 |
| 58 | Lakewood Township, NJ | 142510 | 1 | 0.7 |
How did you miss Jersey City?
20 murders in 2017, 15 in 2018.