
Do you live in one of the murder capitals of Ohio?
We all watch the news with horror when we hear about a homicide that happens not that far away from us. While a murder just blocks or even a couple of towns away from your house would make anyone uneasy, in the long run, most likely, where you live is relatively safe.
To find the cities in Ohio with the most murders and the highest murder rates per capita, we used Saturday Night Science to compare the FBI crime data on murders for the 75 cities in the Buckeye State with over 5,000 residents.
Table Of Contents: Top Ten | Methodology | Summary | Table

Cities With Highest Murder Rates In Ohio
- Moraine
- East Cleveland
- Uhrichsville
- Cleveland
- Youngstown
- Upper Sandusky
- Dayton
- Maple Heights
- Blendon Township
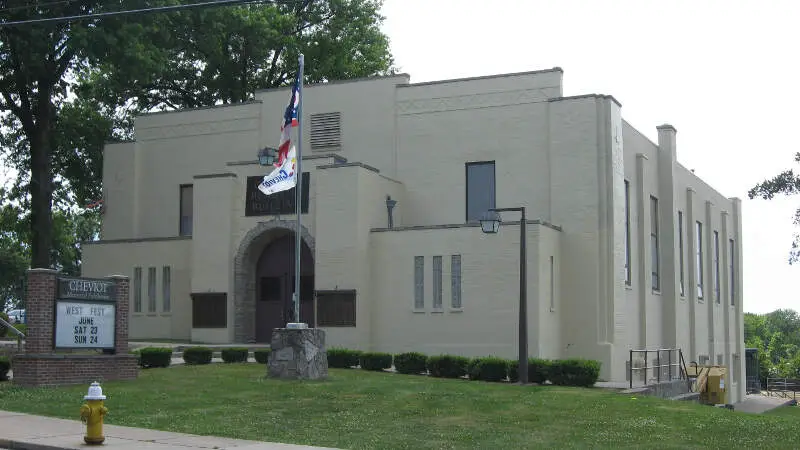
- Cheviot
What city has the highest murder rate in Ohio? The city with the highest murder rate in Ohio is Moraine with 105.4 murders per 100,000 people.
What is the city in Ohio with highest number of murders? The city in Ohio with the highest number of murders is Cleveland with 139 murders.
Read on below to see how we crunched the numbers and how your town in Ohio ranked. There were ‘only’ 75 cities in Ohio where a city reported a murder to the FBI, meaning 180 places had no murder.
For more reading on the Buckeye State check out:
The 10 Murder Capitals Of Ohio For 2025

/10
Population: 6,639
Murders: 7 (11th Most)
Murders Per 100k: 105.4 (Most)
More on Moraine: Data


/10
Population: 13,351
Murders: 9 (9th Most)
Murders Per 100k: 67.4 (2nd Most)
More on East Cleveland: Data


/10
Population: 5,126
Murders: 2 (34th Most)
Murders Per 100k: 39.0 (3rd Most)
More on Uhrichsville: Data


/10
Population: 358,146
Murders: 139 (Most)
Murders Per 100k: 38.8 (4th Most)
More on Cleveland: Data

/10
Population: 58,773
Murders: 18 (7th Most)
Murders Per 100k: 30.6 (5th Most)
More on Youngstown: Data


/10
Population: 6,671
Murders: 2 (34th Most)
Murders Per 100k: 30.0 (6th Most)
More on Upper Sandusky: Data


/10
Population: 135,181
Murders: 36 (4th Most)
Murders Per 100k: 26.6 (7th Most)
More on Dayton: Data

/10
Population: 22,987
Murders: 6 (12th Most)
Murders Per 100k: 26.1 (8th Most)
More on Maple Heights: Data
9. Blendon Township

Population: 7,869
Murders: 2 (34th Most)
Murders Per 100k: 25.4 (9th Most)
More on Blendon Township:

/10
Population: 8,510
Murders: 2 (34th Most)
Murders Per 100k: 23.5 (10th Most)
More on Cheviot: Data
Methodology: How we calculated the murder capitals of Ohio
While there are surveys and public polls on what cities in a state are the most dangerous, we wanted to rely on something other than speculation and opinion. Instead, we used Saturday Night Science to compare the hard numbers from the FBI’s last year of reporting. Specifically, we analyzed the FBI’s Uniform Crime Report, which summarizes the number of murders in each city annually.
We only looked at every single city in Ohio for which FBI data was available for the most recent FBI Crime In The United States. That left us with 75 cities to rank.
We took the number of murders per capita as the ranking factor. The place with the most murders per capita based on the most recent data is Moraine. It is our tenth time ranking the places with the most murders per capita in Ohio. We updated the list for 2025.
Summary: The Places With The Most Murders In Ohio For 2025
If you’re looking at the places in Ohio with the most murders, and where residents have the highest chances of being killed themselves, this is an accurate list. Again, these statistics are an indication of where crimes occur, not a statement about the effectiveness of the law enforcement in the areas they serve.
The cities with the highest murder per capita in Ohio are Moraine, East Cleveland, Uhrichsville, Cleveland, Youngstown, Upper Sandusky, Dayton, Maple Heights, Blendon Township, and Cheviot.
For more Ohio reading, check out:
- Best Places To Raise A Family In Ohio
- Fastest Growing Cities In Ohio
- Safest Places In Ohio
- Best Cities For Singles In Ohio
- Worst Places To Live In Ohio
Murder Rates By City In Ohio
| Rank | City | Population | Murders | Murders/100K |
|---|---|---|---|---|
| 1 | Moraine, OH | 6639 | 7 | 105.44 |
| 2 | East Cleveland, OH | 13351 | 9 | 67.41 |
| 3 | Uhrichsville, OH | 5126 | 2 | 39.02 |
| 4 | Cleveland, OH | 358146 | 139 | 38.81 |
| 5 | Youngstown, OH | 58773 | 18 | 30.63 |
| 6 | Upper Sandusky, OH | 6671 | 2 | 29.98 |
| 7 | Dayton, OH | 135181 | 36 | 26.63 |
| 8 | Maple Heights, OH | 22987 | 6 | 26.1 |
| 9 | Blendon Township, OH | 7869 | 2 | 25.42 |
| 10 | Cheviot, OH | 8510 | 2 | 23.5 |
| 11 | Englewood, OH | 13216 | 3 | 22.7 |
| 12 | Cincinnati, OH | 309484 | 68 | 21.97 |
| 13 | Richmond Heights, OH | 10502 | 2 | 19.04 |
| 14 | Mansfield, OH | 48034 | 9 | 18.74 |
| 15 | Trotwood, OH | 22900 | 4 | 17.47 |
| 16 | Springfield, OH | 57866 | 10 | 17.28 |
| 17 | Hillsboro, OH | 6628 | 1 | 15.09 |
| 18 | Mentor-on-the-Lake, OH | 7071 | 1 | 14.14 |
| 19 | Garfield Heights, OH | 28878 | 4 | 13.85 |
| 20 | Toledo, OH | 264341 | 36 | 13.62 |
| 21 | Oberlin, OH | 7344 | 1 | 13.62 |
| 22 | Canfield, OH | 7574 | 1 | 13.2 |
| 23 | Norwalk, OH | 17089 | 2 | 11.7 |
| 24 | Portsmouth, OH | 17285 | 2 | 11.57 |
| 25 | Sheffield Lake, OH | 8929 | 1 | 11.2 |
| 26 | Copley Township, OH | 18209 | 2 | 10.98 |
| 27 | Columbus, OH | 908834 | 95 | 10.45 |
| 28 | East Liverpool, OH | 9683 | 1 | 10.33 |
| 29 | Bowling Green, OH | 29135 | 3 | 10.3 |
| 30 | Forest Park, OH | 19735 | 2 | 10.13 |
| 31 | Akron, OH | 187705 | 19 | 10.12 |
| 32 | Whitehall, OH | 19816 | 2 | 10.09 |
| 33 | Sidney, OH | 20163 | 2 | 9.92 |
| 34 | Ironton, OH | 10161 | 1 | 9.84 |
| 35 | Reynoldsburg, OH | 41150 | 4 | 9.72 |
| 36 | Piqua, OH | 20722 | 2 | 9.65 |
| 37 | Lancaster, OH | 41448 | 4 | 9.65 |
| 38 | Chillicothe, OH | 21863 | 2 | 9.15 |
| 39 | Ravenna, OH | 11218 | 1 | 8.91 |
| 40 | Norton, OH | 11448 | 1 | 8.74 |
| 41 | Canton, OH | 69164 | 6 | 8.68 |
| 42 | Lima, OH | 34706 | 3 | 8.64 |
| 43 | Franklin, OH | 11624 | 1 | 8.6 |
| 44 | Bexley, OH | 12411 | 1 | 8.06 |
| 45 | Bedford, OH | 12756 | 1 | 7.84 |
| 46 | Fostoria, OH | 13033 | 1 | 7.67 |
| 47 | Maumee, OH | 13603 | 1 | 7.35 |
| 48 | Powell, OH | 14463 | 1 | 6.91 |
| 49 | Delaware, OH | 45041 | 3 | 6.66 |
| 50 | Mentor, OH | 46856 | 3 | 6.4 |
| 51 | Euclid, OH | 48170 | 3 | 6.23 |
| 52 | Mount Vernon, OH | 16551 | 1 | 6.04 |
| 53 | Defiance, OH | 16965 | 1 | 5.89 |
| 54 | Marion, OH | 34992 | 2 | 5.72 |
| 55 | Colerain Township, OH | 58268 | 3 | 5.15 |
| 56 | Rocky River, OH | 21247 | 1 | 4.71 |
| 57 | Cleveland Heights, OH | 43891 | 2 | 4.56 |
| 58 | Hudson, OH | 22839 | 1 | 4.38 |
| 59 | Solon, OH | 23681 | 1 | 4.22 |
| 60 | Willoughby, OH | 24261 | 1 | 4.12 |
| 61 | Sandusky, OH | 24273 | 1 | 4.12 |
| 62 | Riverside, OH | 24296 | 1 | 4.12 |
| 63 | Dublin, OH | 48827 | 2 | 4.1 |
| 64 | Elyria, OH | 53024 | 2 | 3.77 |
| 65 | Kent, OH | 26805 | 1 | 3.73 |
| 66 | Wooster, OH | 26945 | 1 | 3.71 |
| 67 | Kettering, OH | 56633 | 2 | 3.53 |
| 68 | Miami Township, Montgomery County, OH | 30642 | 1 | 3.26 |
| 69 | Hamilton, OH | 62705 | 2 | 3.19 |
| 70 | Sylvania Township, OH | 31756 | 1 | 3.15 |
| 71 | Cuyahoga Falls, OH | 50459 | 1 | 1.98 |
| 72 | Union Township, Clermont County, OH | 50463 | 1 | 1.98 |
| 73 | Newark, OH | 51147 | 1 | 1.96 |
| 74 | Lorain, OH | 65436 | 1 | 1.53 |
| 75 | Parma, OH | 78913 | 1 | 1.27 |