
Do you live in one of the murder capitals of Pennsylvania?
We all watch the news with horror when we hear about a homicide that happens not that far away from us. While a murder just blocks or even a couple of towns away from your house would make anyone uneasy, in the long run, most likely, where you live is relatively safe.
To find the cities in Pennsylvania with the most murders and the highest murder rates per capita, we used Saturday Night Science to compare the FBI crime data on murders for the 90 cities in the Keystone State with over 5,000 residents.
Table Of Contents: Top Ten | Methodology | Summary | Table
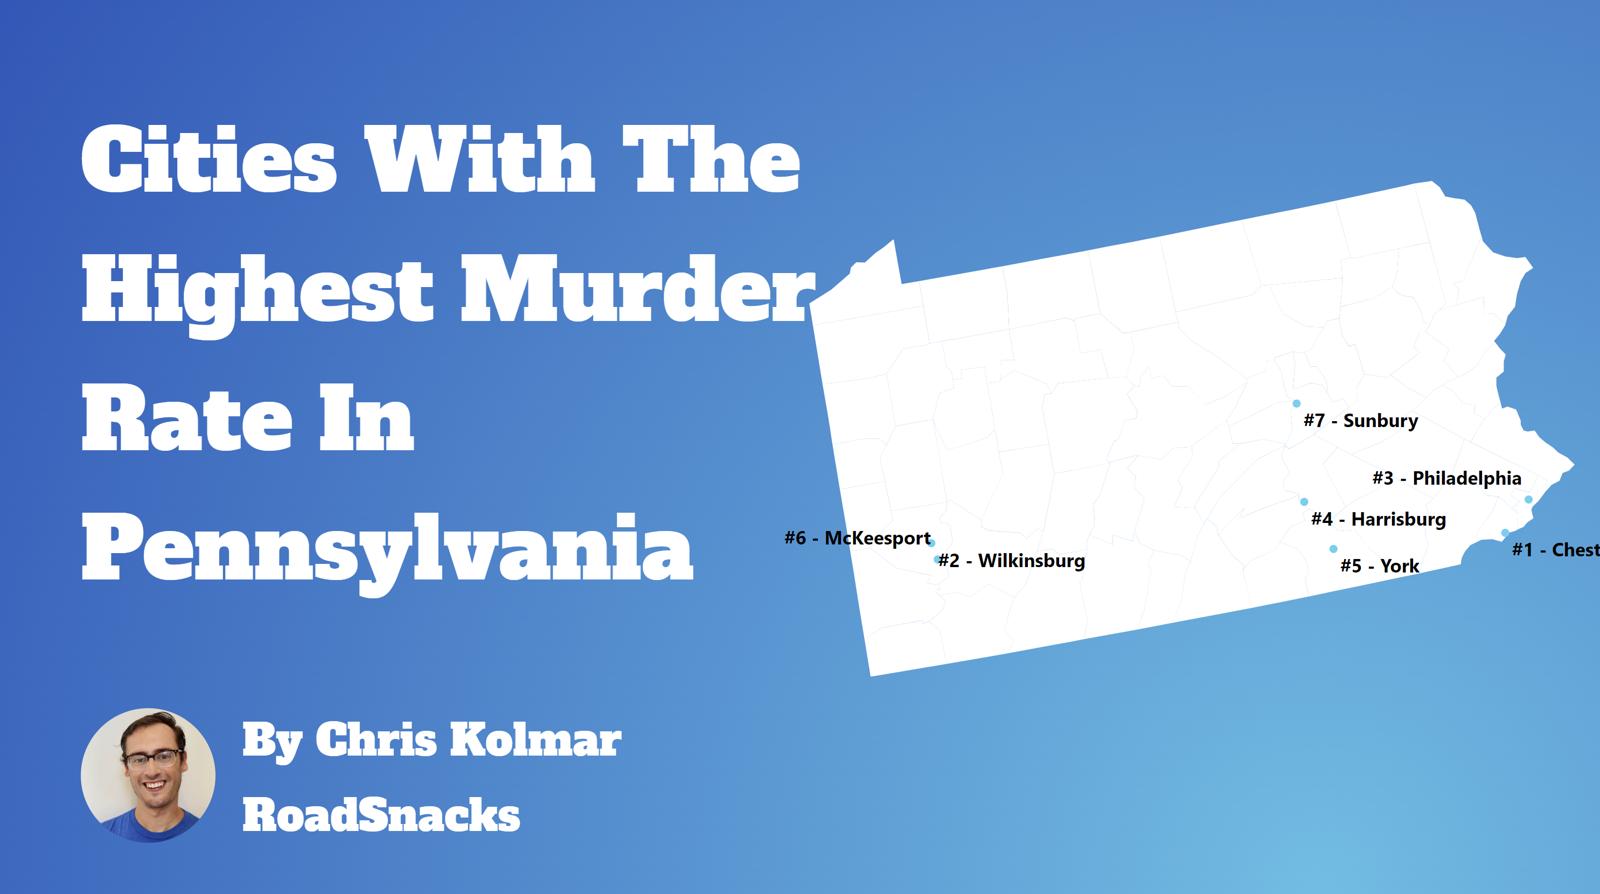
Cities With Highest Murder Rates In Pennsylvania
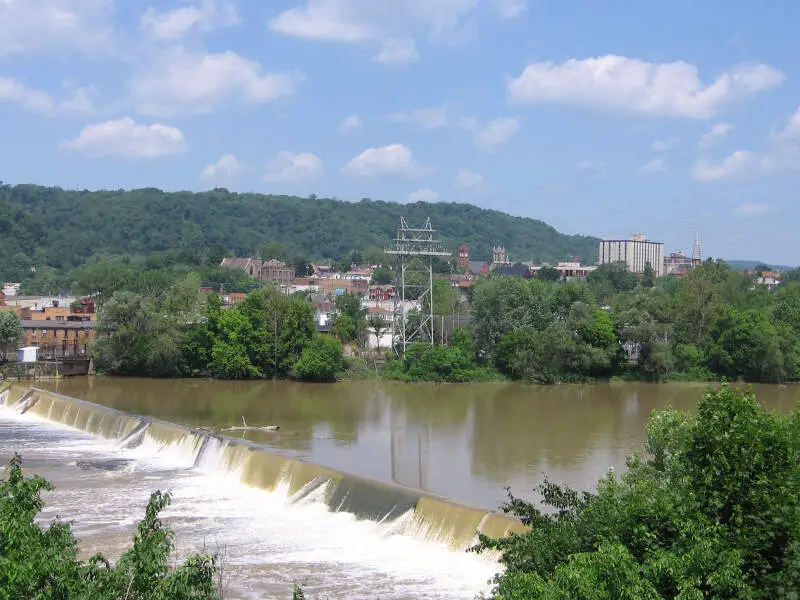
- Charleroi Regional
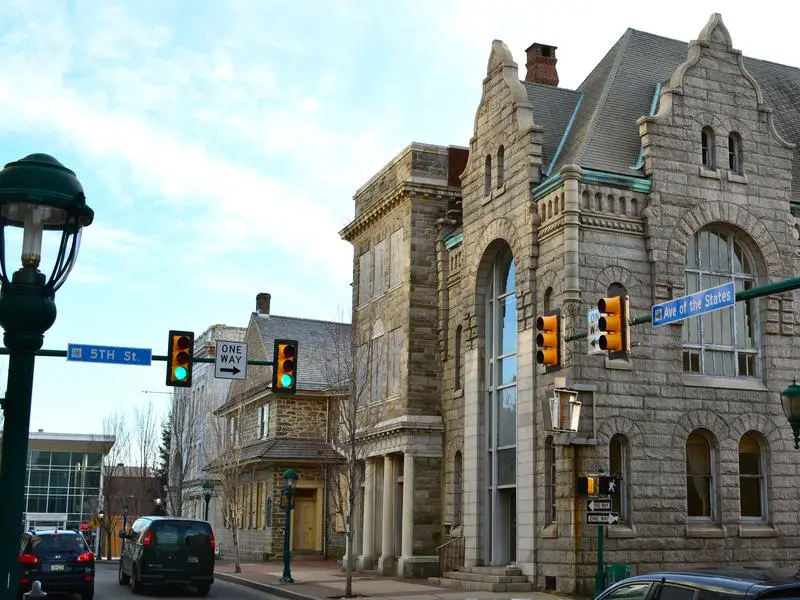
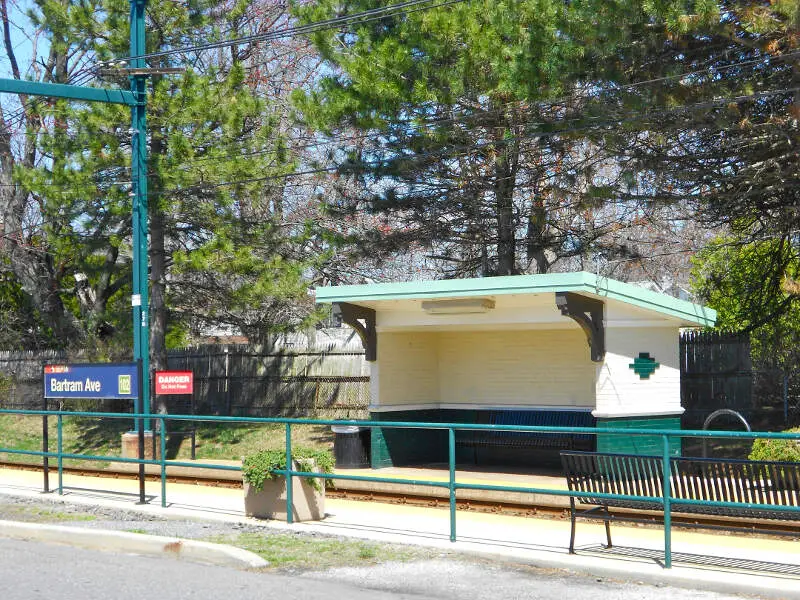
- Chester
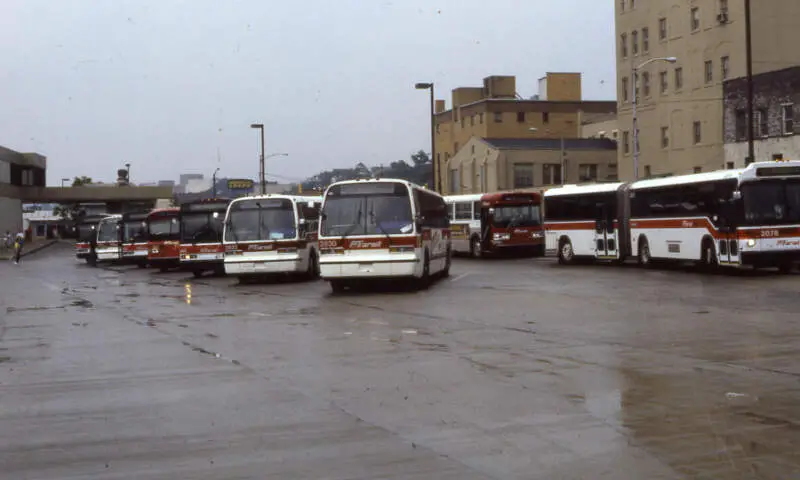
- Uniontown
- Sharon
- Beaver Falls
- Collingdale
- Stowe Township
- McKeesport
- Harrisburg
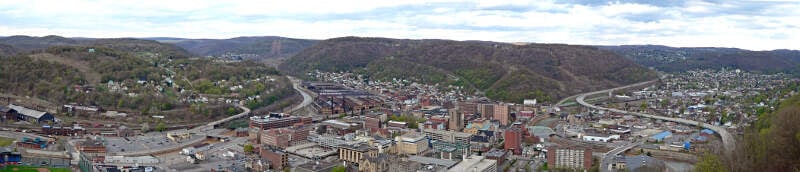
- Johnstown
What city has the highest murder rate in Pennsylvania? The city with the highest murder rate in Pennsylvania is Charleroi Regional with 59.6 murders per 100,000 people.
What is the city in Pennsylvania with highest number of murders? The city in Pennsylvania with the highest number of murders is Philadelphia with 262 murders.
Read on below to see how we crunched the numbers and how your town in Pennsylvania ranked. There were ‘only’ 90 cities in Pennsylvania where a city reported a murder to the FBI, meaning 342 places had no murder.
For more reading on the Keystone State check out:
- Best Places To Live In Pennsylvania
- Cheapest Places To Live In Pennsylvania
- Most Dangerous Cities In Pennsylvania
The 10 Murder Capitals Of Pennsylvania For 2026
1. Charleroi Regional

Population: 6,706
Murders: 4 (17th Most)
Murders Per 100k: 59.6 (Most)
More on Charleroi Regional: Movers

/10
Population: 33,944
Murders: 20 (3rd Most)
Murders Per 100k: 58.9 (2nd Most)
More on Chester: Data | Crime | Cost Of Living | Movers

/10
Population: 9,451
Murders: 5 (12th Most)
Murders Per 100k: 52.9 (3rd Most)
More on Uniontown: Data | Cost Of Living | Movers

/10
Population: 12,709
Murders: 6 (8th Most)
Murders Per 100k: 47.2 (4th Most)
More on Sharon: Data | Cost Of Living | Movers

/10
Population: 11,696
Murders: 4 (17th Most)
Murders Per 100k: 34.2 (5th Most)
More on Beaver Falls: Data | Cost Of Living | Movers

/10
Population: 8,813
Murders: 3 (20th Most)
Murders Per 100k: 34.0 (6th Most)
More on Collingdale: Data | Cost Of Living | Movers
7. Stowe Township

Population: 6,116
Murders: 2 (30th Most)
Murders Per 100k: 32.7 (7th Most)
More on Stowe Township: Movers

/10
Population: 18,480
Murders: 6 (8th Most)
Murders Per 100k: 32.5 (8th Most)
More on Mckeesport: Data | Crime | Cost Of Living | Movers


/10
Population: 49,985
Murders: 15 (4th Most)
Murders Per 100k: 30.0 (9th Most)
More on Harrisburg: Data | Crime | Cost Of Living | Movers

/10
Population: 20,120
Murders: 6 (8th Most)
Murders Per 100k: 29.8 (10th Most)
More on Johnstown: Data | Cost Of Living | Movers
Methodology: How we calculated the murder capitals of Pennsylvania
While there are surveys and public polls on what cities in a state are the most dangerous, we wanted to rely on something other than speculation and opinion. Instead, we used Saturday Night Science to compare the hard numbers from the FBI’s last year of reporting. Specifically, we analyzed the FBI’s Uniform Crime Report, which summarizes the number of murders in each city annually.
We only looked at every single city in Pennsylvania for which FBI data was available for the most recent FBI Crime In The United States. That left us with 90 cities to rank.
We took the number of murders per capita as the ranking factor. The place with the most murders per capita based on the most recent data is Charleroi Regional. It is our eleventh time ranking the places with the most murders per capita in Pennsylvania. We updated the list for 2026.
Summary: The Places With The Most Murders In Pennsylvania For 2026
If you’re looking at the places in Pennsylvania with the most murders, and where residents have the highest chances of being killed themselves, this is an accurate list. Again, these statistics are an indication of where crimes occur, not a statement about the effectiveness of the law enforcement in the areas they serve.
The cities with the highest murder per capita in Pennsylvania are Charleroi Regional, Chester, Uniontown, Sharon, Beaver Falls, Collingdale, Stowe Township, McKeesport, Harrisburg, and Johnstown.
For more Pennsylvania reading, check out:
- Best Places To Raise A Family In Pennsylvania
- Fastest Growing Cities In Pennsylvania
- Safest Places In Pennsylvania
- Best Cities For Singles In Pennsylvania
- Worst Places To Live In Pennsylvania
Murder Rates By City In Pennsylvania
| Rank | City | Population | Murders | Murders/100K |
|---|---|---|---|---|
| 1 | Charleroi Regional, PA | 6706 | 4 | 59.65 |
| 2 | Chester, PA | 33944 | 20 | 58.92 |
| 3 | Uniontown, PA | 9451 | 5 | 52.9 |
| 4 | Sharon, PA | 12709 | 6 | 47.21 |
| 5 | Beaver Falls, PA | 11696 | 4 | 34.2 |
| 6 | Collingdale, PA | 8813 | 3 | 34.04 |
| 7 | Stowe Township, PA | 6116 | 2 | 32.7 |
| 8 | McKeesport, PA | 18480 | 6 | 32.47 |
| 9 | Harrisburg, PA | 49985 | 15 | 30.01 |
| 10 | Johnstown, PA | 20120 | 6 | 29.82 |
| 11 | Folcroft, PA | 6717 | 2 | 29.78 |
| 12 | Carlisle, PA | 23144 | 5 | 21.6 |
| 13 | Coraopolis, PA | 5279 | 1 | 18.94 |
| 14 | Darby, PA | 10586 | 2 | 18.89 |
| 15 | Monongahela, PA | 11507 | 2 | 17.38 |
| 16 | Clairton, PA | 5877 | 1 | 17.02 |
| 17 | Philadelphia, PA | 1549259 | 262 | 16.91 |
| 18 | Sharon Hill, PA | 5942 | 1 | 16.83 |
| 19 | Dickson City, PA | 5995 | 1 | 16.68 |
| 20 | Corry, PA | 6034 | 1 | 16.57 |
| 21 | Steelton, PA | 6322 | 1 | 15.82 |
| 22 | Allegheny Township, Blair County, PA | 6518 | 1 | 15.34 |
| 23 | Wilkinsburg, PA | 13646 | 2 | 14.66 |
| 24 | East Coventry Township, PA | 7188 | 1 | 13.91 |
| 25 | Ellwood City, PA | 7398 | 1 | 13.52 |
| 26 | Latrobe, PA | 7877 | 1 | 12.7 |
| 27 | Hatboro, PA | 8265 | 1 | 12.1 |
| 28 | Pocono Mountain Regional, PA | 42656 | 5 | 11.72 |
| 29 | Pittsburgh, PA | 317177 | 36 | 11.35 |
| 30 | Schuylkill Township, Chester County, PA | 8906 | 1 | 11.23 |
| 31 | West Caln Township, PA | 8968 | 1 | 11.15 |
| 32 | York, PA | 44893 | 5 | 11.14 |
| 33 | West Mifflin, PA | 18705 | 2 | 10.69 |
| 34 | Harrison Township, PA | 9671 | 1 | 10.34 |
| 35 | Morrisville, PA | 9675 | 1 | 10.34 |
| 36 | West Hills Regional, PA | 9795 | 1 | 10.21 |
| 37 | Plains Township, PA | 9911 | 1 | 10.09 |
| 38 | Buckingham Township, PA | 20736 | 2 | 9.65 |
| 39 | Nanticoke, PA | 10616 | 1 | 9.42 |
| 40 | New Castle, PA | 21252 | 2 | 9.41 |
| 41 | Scranton, PA | 75683 | 7 | 9.25 |
| 42 | Wilkes-Barre, PA | 44254 | 4 | 9.04 |
| 43 | Lansdowne, PA | 11071 | 1 | 9.03 |
| 44 | Chambersburg, PA | 22366 | 2 | 8.94 |
| 45 | New Kensington, PA | 11832 | 1 | 8.45 |
| 46 | Carbondale, PA | 11849 | 1 | 8.44 |
| 47 | Norristown, PA | 35764 | 3 | 8.39 |
| 48 | Butler, PA | 12973 | 1 | 7.71 |
| 49 | Clearfield Regional, PA | 13062 | 1 | 7.66 |
| 50 | Coatesville, PA | 13256 | 1 | 7.54 |
| 51 | Springettsbury Township, PA | 27604 | 2 | 7.25 |
| 52 | Susquehanna Township, Dauphin County, PA | 27762 | 2 | 7.2 |
| 53 | Reading, PA | 97868 | 7 | 7.15 |
| 54 | Lower Moreland Township, PA | 14124 | 1 | 7.08 |
| 55 | Indiana, PA | 14378 | 1 | 6.96 |
| 56 | Whitehall Township, PA | 29090 | 2 | 6.88 |
| 57 | Westtown-East Goshen Regional, PA | 29610 | 2 | 6.75 |
| 58 | Cecil Township, PA | 15206 | 1 | 6.58 |
| 59 | Southern Chester County Regional, PA | 15511 | 1 | 6.45 |
| 60 | Butler Township, Butler County, PA | 16682 | 1 | 5.99 |
| 61 | Elizabeth Township, PA | 17011 | 1 | 5.88 |
| 62 | Stroud Area Regional, PA | 34162 | 2 | 5.85 |
| 63 | Upper Saucon Township, PA | 17864 | 1 | 5.6 |
| 64 | Towamencin Township, PA | 17925 | 1 | 5.58 |
| 65 | Erie, PA | 92379 | 5 | 5.41 |
| 66 | Northern Lancaster County Regional, PA | 41609 | 2 | 4.81 |
| 67 | Springfield Township, Montgomery County, PA | 21044 | 1 | 4.75 |
| 68 | Upper Darby Township, PA | 84668 | 4 | 4.72 |
| 69 | West Goshen Township, PA | 23889 | 1 | 4.19 |
| 70 | Upper Moreland Township, PA | 26020 | 1 | 3.84 |
| 71 | Montgomery Township, PA | 26069 | 1 | 3.84 |
| 72 | Moon Township, PA | 26389 | 1 | 3.79 |
| 73 | East Lampeter Township, PA | 26615 | 1 | 3.76 |
| 74 | Shaler Township, PA | 26801 | 1 | 3.73 |
| 75 | East Hempfield Township, PA | 27135 | 1 | 3.69 |
| 76 | Upper Dublin Township, PA | 27382 | 1 | 3.65 |
| 77 | Spring Township, Berks County, PA | 28506 | 1 | 3.51 |
| 78 | Swatara Township, PA | 29394 | 1 | 3.4 |
| 79 | Allentown, PA | 124599 | 4 | 3.21 |
| 80 | Lower Merion Township, PA | 64290 | 2 | 3.11 |
| 81 | Lower Makefield Township, PA | 33400 | 1 | 2.99 |
| 82 | Northern Regional, PA | 38548 | 1 | 2.59 |
| 83 | Penn Hills, PA | 39203 | 1 | 2.55 |
| 84 | Bethlehem, PA | 79194 | 2 | 2.53 |
| 85 | Northampton Township, PA | 39879 | 1 | 2.51 |
| 86 | Altoona, PA | 42424 | 1 | 2.36 |
| 87 | Northern York County Regional, PA | 90901 | 2 | 2.2 |
| 88 | Middletown Township, PA | 45516 | 1 | 2.2 |
| 89 | Bensalem Township, PA | 62843 | 1 | 1.59 |
| 90 | York County Regional, PA | 71232 | 1 | 1.4 |