
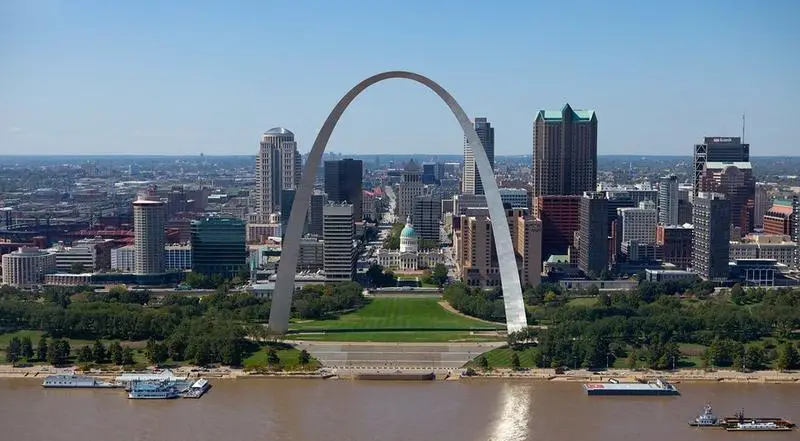
St. Louis’s neighborhoods conjure up too many stereotypes to count. You’ve got hipster areas, preppy places, neighborhoods where college kids thrive, and of course, ghettos.
It seems as if there’s a neighborhood for everyone in St. Louis.
And while the city consistently ranks as one of the best places to live in Missouri thanks in part to tons of entertainment and jobs, it’s not all rainbows and sunshine in St. Louis. Some neighborhoods aren’t as safe as others.
So the question arises, which St. Louis neighborhoods are the most dangerous and which are the safest?
Today, we’ll use Saturday Night Science to determine which St. Louis hoods need a little tender loving care – the sore thumbs of the St. Louis area if you will. Realistically, you can’t expect all the neighborhoods to be amazing, although Wydown-Skinker ranks way above the rest.
We examined 77 of St. Louis’s neighborhoods to find out the most dangerous places to live. These places don’t quite measure up to St. Louis’s reputation.
Table Of Contents: Top 10 | Methodology | Summary | Table
So what’s the worst neighborhood to live in St. Louis for 2025? According to the most recent census data, Fairground Neighborhood looks to be the worst neighborhood in St. Louis.
Read on to see how we determined the places around St. Louis that need a pick-me-up. And remember, don’t blame the messenger.
For more Missouri reading, check out:
- Best Places To Live In Missouri
- Cheapest Places To Live In Missouri
- Most Dangerous Cities in Missouri
The 10 Most Dangerous Neighborhoods In St. Louis For 2025
/10
Population: 690
Violent Crimes Per 100k: 2,285
Property Crime Per 100k: 10,120
Median Home Value: $42,400 (5th worst)
Median Income: $24,768 (6th worst)
More on Fairground Neighborhood: Data
/10
Population: 992
Violent Crimes Per 100k: 2,224
Property Crime Per 100k: 9,848
Median Home Value: $66,900 (18th worst)
Median Income: $21,848 (4th worst)
More on North Riverfront: Data
/10
Population: 1,394
Violent Crimes Per 100k: 3,096
Property Crime Per 100k: 11,208
Median Home Value: $35,700 (worst)
Median Income: $30,928 (18th worst)
More on Hyde Park: Data
/10
Population: 4,300
Violent Crimes Per 100k: 2,620
Property Crime Per 100k: 9,886
Median Home Value: $66,486 (17th worst)
Median Income: $28,916 (16th worst)
More on Baden: Data
/10
Population: 1,438
Violent Crimes Per 100k: 2,798
Property Crime Per 100k: 9,593
Median Home Value: $119,133 (32nd worst)
Median Income: $23,160 (5th worst)
More on Old North Saint Louis: Data
/10
Population: 1,026
Violent Crimes Per 100k: 2,852
Property Crime Per 100k: 5,351
Median Home Value: $44,650 (6th worst)
Median Income: $29,056 (17th worst)
More on College Hill: Data
/10
Population: 1,924
Violent Crimes Per 100k: 2,358
Property Crime Per 100k: 6,658
Median Home Value: $80,067 (2worst)
Median Income: $33,430 (22nd worst)
More on Near North Riverfront: Data
/10
Population: 1,036
Violent Crimes Per 100k: 4,096
Property Crime Per 100k: 9,103
Median Home Value: $94,150 (29th worst)
Median Income: $20,313 (2nd worst)
More on Fountain Park: Data
/10
Population: 2,052
Violent Crimes Per 100k: 3,637
Property Crime Per 100k: 8,780
Median Home Value: $75,750 (20th worst)
Median Income: $26,993 (12th worst)
More on Academy: Data
/10
Population: 2,720
Violent Crimes Per 100k: 1,695
Property Crime Per 100k: 5,486
Median Home Value: $87,283 (25th worst)
Median Income: $20,792 (3rd worst)
More on Saint Louis Place: Data
Methodology: How we determined the most dangerous St. Louis neighborhoods in 2025
To figure out how bad a place is to live in, we only needed to know what kinds of things people like and then decide what places have the least amount of those things. We plugged the following criteria into Saturday Night Science to get the worst neighborhoods in St. Louis:
- High crime (Estimated)
- High unemployment (Less jobs)
- Low median income (Less pay)
- Low population density (No things to do)
- Low home values (No one’s willing to pay to live here)
Then, we ranked each neighborhood in St. Louis, Missouri for each of these criteria from worst to best.
Next, we averaged the individual rankings for each criterion into a “Worst Score.”
The neighborhood with the lowest “Worst Score” ranks as the most dangerous neighborhood of St. Louis.
The article is an opinion based on facts and is meant as infotainment. We updated this article for 2025. This report is our time ranking the worst neighborhoods to live in St. Louis.
Skip to the end to see the list of all 77 neighborhoods ranked from worst to best.
Summary: The Worst Neighborhoods Around St. Louis
Well, there you have it — the worst of the neighborhoods in St. Louis with Fairground Neighborhood landing at the bottom of the pack.
The worst neighborhoods in St. Louis are Fairground Neighborhood, North Riverfront, Hyde Park, Baden, Old North Saint Louis, College Hill, Near North Riverfront, Fountain Park, Academy, and Saint Louis Place.
As mentioned earlier, the neighborhoods in St. Louis aren’t all bad. Wydown-Skinker takes the cake as the best place to live in St. Louis.
The best neighborhoods in St. Louis are Wydown-Skinker, Hi-Pointe, Shaw, South Hampton, and Skinker-Debaliviere.
We ranked the neighborhoods from worst to best in the chart below.
For more Missouri reading, check out:
Most Dangerous Neighborhoods To Live In St. Louis For 2025?
| Rank | Neighborhood | Population | Home Value | Median Income |
|---|---|---|---|---|
| 1 | Fairground Neighborhood | 690 | $42,400 | $24,768 |
| 2 | North Riverfront | 992 | $66,900 | $21,848 |
| 3 | Hyde Park | 1,394 | $35,700 | $30,928 |
| 4 | Baden | 4,300 | $66,486 | $28,916 |
| 5 | Old North Saint Louis | 1,438 | $119,133 | $23,160 |
| 6 | College Hill | 1,026 | $44,650 | $29,056 |
| 7 | Near North Riverfront | 1,924 | $80,067 | $33,430 |
| 8 | Fountain Park | 1,036 | $94,150 | $20,313 |
| 9 | Academy | 2,052 | $75,750 | $26,993 |
| 10 | Saint Louis Place | 2,720 | $87,283 | $20,792 |
| 11 | Visitation Park | 794 | $141,550 | $26,993 |
| 12 | Walnut Park East | 2,944 | $36,700 | $28,359 |
| 13 | The Ville | 1,715 | $36,650 | $24,790 |
| 14 | Fairground Park | 406 | $47,300 | $26,042 |
| 15 | Jeffvanderlou | 5,145 | $86,600 | $28,202 |
| 16 | Wells-Goodfellow | 5,099 | $50,925 | $31,929 |
| 17 | The Greater Ville | 4,746 | $48,514 | $27,034 |
| 18 | Hamilton Heights | 2,214 | $45,400 | $17,706 |
| 19 | Covenant Blu-Grand Center | 3,005 | $85,250 | $34,628 |
| 20 | Peabody-Darst-Webbe | 1,652 | $177,725 | $48,840 |
| 21 | Marine Villa | 2,506 | $89,300 | $42,765 |
| 22 | Patch | 2,664 | $88,833 | $31,735 |
| 23 | Kingsway West | 2,327 | $42,333 | $41,442 |
| 24 | Mark Twain | 2,630 | $53,333 | $33,367 |
| 25 | Penrose | 4,852 | $57,612 | $34,968 |
| 26 | West End | 5,834 | $152,757 | $38,437 |
| 27 | Walnut Park West | 3,207 | $51,925 | $39,976 |
| 28 | Lewis Place | 1,314 | $136,533 | $39,432 |
| 29 | Calvary-Bellefontaine Cemetery | 1,478 | $56,300 | $25,286 |
| 30 | Mount Pleasant | 3,828 | $68,433 | $25,864 |
| 31 | Vandeventer | 2,011 | $143,550 | $43,602 |
| 32 | Gravois Park | 5,442 | $80,150 | $39,860 |
| 33 | La Salle | 219 | $183,750 | $46,194 |
| 34 | Kingsway East | 3,215 | $45,033 | $50,854 |
| 35 | Soulard | 2,532 | $202,367 | $62,454 |
| 36 | Kosciusko | 872 | $203,533 | $50,127 |
| 37 | Carondelet | 7,807 | $101,000 | $45,028 |
| 38 | North Point | 2,784 | $59,575 | $49,364 |
| 39 | Dutchtown | 15,510 | $88,917 | $36,261 |
| 40 | Botanical Heights | 1,058 | $180,275 | $44,517 |
| 41 | Holly Hills | 2,263 | $138,800 | $62,928 |
| 42 | Cheltenham | 863 | $153,800 | $47,300 |
| 43 | Benton Park West | 4,967 | $163,600 | $41,418 |
| 44 | Forest Park Southeast | 2,693 | $224,933 | $54,949 |
| 45 | Midtown | 5,335 | $219,000 | $34,520 |
| 46 | Kings Oak | 453 | $153,800 | $47,300 |
| 47 | Bevo Mill | 12,266 | $104,889 | $45,637 |
| 48 | The Hill | 2,953 | $167,275 | $49,191 |
| 49 | Mckinley Heights | 1,297 | $215,000 | $60,558 |
| 50 | Lafayette Square | 3,031 | $228,500 | $60,980 |
| 51 | Ellendale | 1,612 | $142,050 | $59,254 |
| 52 | Central West End | 14,347 | $374,067 | $52,315 |
| 53 | Downtown West | 6,511 | $224,667 | $54,611 |
| 54 | Franz Park | 1,879 | $134,933 | $64,172 |
| 55 | Southwest Garden | 4,209 | $185,560 | $52,906 |
| 56 | Tower Grove East | 6,551 | $203,800 | $57,203 |
| 57 | Boulevard Heights | 10,275 | $134,244 | $55,402 |
| 58 | North Hampton | 7,117 | $165,910 | $57,118 |
| 59 | Clayton-Tamm | 1,912 | $152,800 | $59,750 |
| 60 | Benton Park | 3,957 | $215,825 | $65,561 |
| 61 | Tower Grove South | 12,364 | $157,429 | $61,906 |
| 62 | Clifton Heights | 2,722 | $167,300 | $61,217 |
| 63 | Oarondelet Park | 1,028 | $195,400 | $112,500 |
| 64 | Fox Park | 2,809 | $181,275 | $64,681 |
| 65 | Missouri Botanical Garden | 1,296 | $293,350 | $89,436 |
| 66 | Debaliviere Place | 2,848 | $202,733 | $62,791 |
| 67 | Princeton Heights | 6,897 | $145,062 | $61,387 |
| 68 | The Gate District | 3,405 | $233,000 | $81,916 |
| 69 | Downtown | 5,505 | $208,067 | $66,526 |
| 70 | Compton Heights | 1,531 | $318,800 | $68,781 |
| 71 | Saint Louis Hills | 8,066 | $238,900 | $63,348 |
| 72 | Lindenwood Park | 8,607 | $166,750 | $66,158 |
| 73 | Skinker-Debaliviere | 4,531 | $306,967 | $67,465 |
| 74 | South Hampton | 7,622 | $201,657 | $62,089 |
| 75 | Shaw | 6,108 | $281,900 | $75,439 |
| 76 | Hi-Pointe | 2,516 | $173,267 | $66,613 |
| 77 | Wydown-Skinker | 762 | $392,100 | $110,357 |
“Until World War II, Mount Auburn was a largely white, working-class neighborhood filled with frame bungalows with wide front porches. Neighbors knew each other, their kids walked to Mount Auburn Elementary School, up to Woolworths or J.C. Penney on East Grand, and over to the Major Theater on Samuell Avenue. It was your typical all-American neighborhood. No, it was your typical ALL-WHITE neighborhood. Non-white Americans were not welcome (like many neighborhoods in Dallas). Dallas neighborhoods were once severely segregated by race and ethnicity. Now, in these enlightened times, we don”t do that any more. Racial segregation has given way to economic segregation, thanks in large part to unchecked gentrification. Just like the neighborhoods east of Central Expressway, and south of Henderson, the poor and the middle class families will continue to disappear as redevelopment accelerates.
I grew up in old north st. louis I believe that was the area the address was 1621 knapp st 63106 I really would like some info on that area. and also what would it take to turn these neighborhoods around. What if a builder went in and built all new homes would that bring the middle class back to these neighborhoods. I’m guessing the crack and cocaine epidemic brought them down in the first place. I’m so serious about trying to find a way to rebuild my old neighbor hood.
I work as a home health nurse in 63106 and there’s been a lot of rebuilding. Lots of parks and new red brick housing.
Please stop walking and around the problems on St. Louis’s north side. The problem is and has been the influx of blacks into n St. Louis in about 1968. I realize you may not know this. Or just don’t want to admit it. I lived there and I know it’s true. It was once a good neighborhood. Now it’s a jungles. Ask the current mayor why nothing has been done build fixed. By any mayor since about 1962 years. Thank you b
I knew that. You would question my comments non the less they are true I was there. You weren’t. If asked I can give you more reasons. Which in sure you would like better
You think you places and parks will keep bad elements out. It would take more then that to feel safe again. My boy friend thinks that we should not fear it but I just want a place that my children can walk around with looking around every 5 mins due to violence