
Most dangerous cities in California research summary. We analyzed the most recent FBI crime data using Saturday Night Science to determine the most dangerous cities in California.
We examined the violent and property crime per capita statistics for every place with over 5,000 residents. In total, we analyzed 419 California cities. Here are the results of our analysis:
-
The most dangerous city in California is Commerce based on the most recent FBI crime data.
-
The violent crime rate in California is 1,552 per 100k people.
-
The property crime rate in California is 13,862 per 100k people.
-
The safest city in California is Laguna Woods.
-
California is the 14th most dangerous state in the United States.
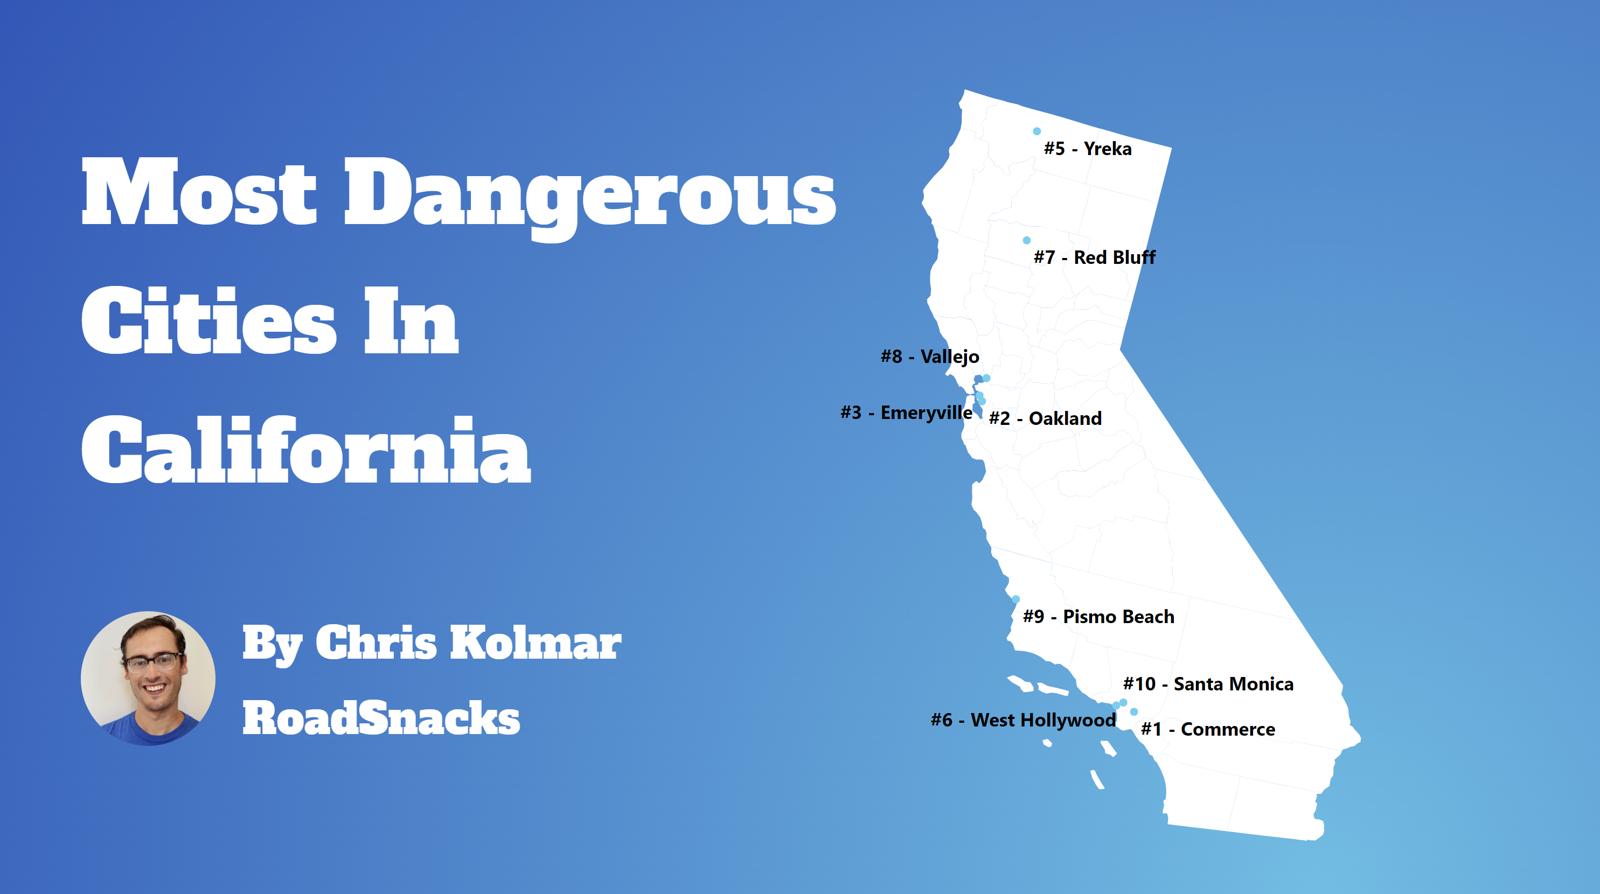
Table Of Contents: Top Ten | Table | Methodology | FAQs | References
What do Biggie, Tupac, and Snoop Dogg have in common? They’ve all written songs about some of the most dangerous places in California.
That’s right, from Stockton to Compton, The Golden State has some pretty sketchy places, and we’re here to tell you just where those places are located. We’ve put the research into creating a list of the top ten most dangerous places in California for 2024.
To compile our list, we looked at FBI data for violent and property crimes per capita in California cities with a population of 5,000 — that left us with 419 cities.
We discovered that many of California’s biggest cities are among its most dangerous. Cities like Oakland and San Bernardino just can’t catch a break.
The Most Dangerous Cities In California For 2024
What is the most dangerous place in California for 2024? The most dangerous city in California is Commerce.
California’s crime numbers have also catapulted the state into ranking as the 14th most dangerous state in America. And sadly, California has nine of the most dangerous cities in the country.
For more California reading, check out:
- Most dangerous cities in the US
- Best Places To Live In California
- Cheapest Places To Live In California
- Best Places To Raise A Family In California
The 10 Most Dangerous Places To Live In California For 2024

/10
Population: 11,787
Violent Crimes Per 100k: 1,552 (Most dangerous)
Property Crimes Per 100k: 13,862 (Second most dangerous)
Murders: 6
More on Commerce: Data | Crime | Cost Of Living
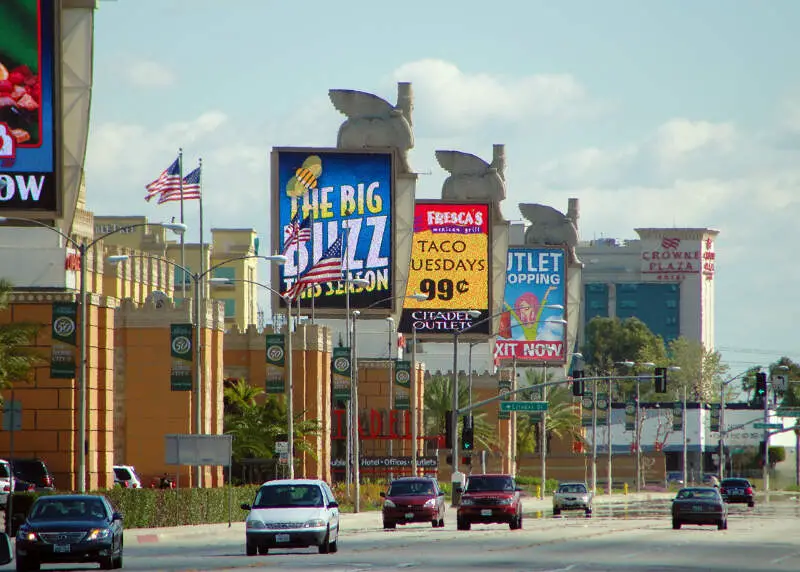
Located just southeast of Los Angeles, Commerce is nicknamed “The Model City,” but it has a long way to go before it can be truly described as a model for crime rates. Over the course of a year, any given resident has a 1 in 7 chance of being the victim of a property crime, the second highest rate in California.
Commerce’s violent crime, on the other hand, has been dropping at a steady rate in recent years, but it’s still prevalent enough to rank as the most violent place in California for 2022. At least nobody has to resort to pickpocketing for bus fare, because Commerce is one of the few cities in California to offer free bus service.

/10
Population: 428,374
Violent Crimes Per 100k: 1,521 (Second most dangerous)
Property Crimes Per 100k: 6,474 (Fifth most dangerous)
Murders: 121
More on Oakland: Data | Crime | Cost Of Living
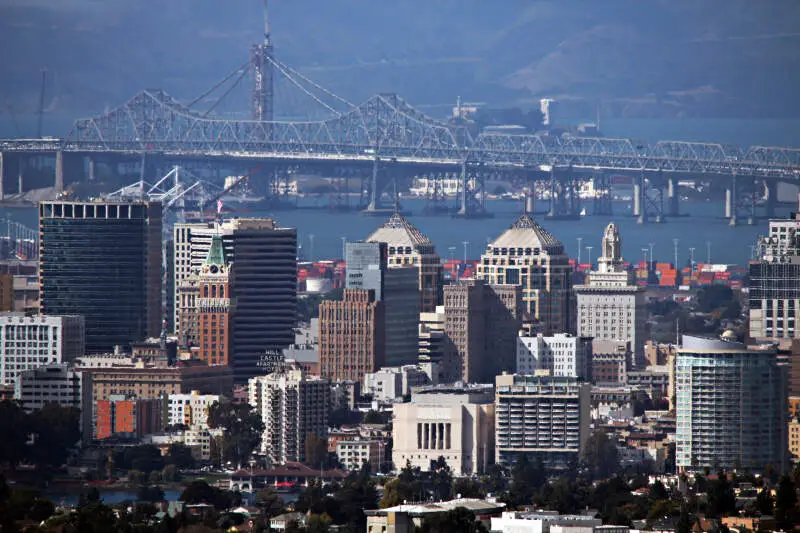
Oakland gets a bad wrap for being hella dangerous, but, in this case, the stereotype is all too true. With an overall crime rate 150% higher than the national average, a murder happening every five days on average, and the fifth highest rate of property crime in California, the statistics lead to the inescapable conclusion that Bump City is far from safe.
On the plus side, Oakland still has plenty of family-friendly spots where you don’t have to be looking over your shoulder constantly, like the entertainment and business destination, Jack London Square on the city’s waterfront, and the Oakland Zoo in Grass Valley.

/10
Population: 12,781
Violent Crimes Per 100k: 1,111 (12th most dangerous)
Property Crimes Per 100k: 15,084 (Most dangerous)
Murders: 0
More on Emeryville: Data | Crime | Cost Of Living
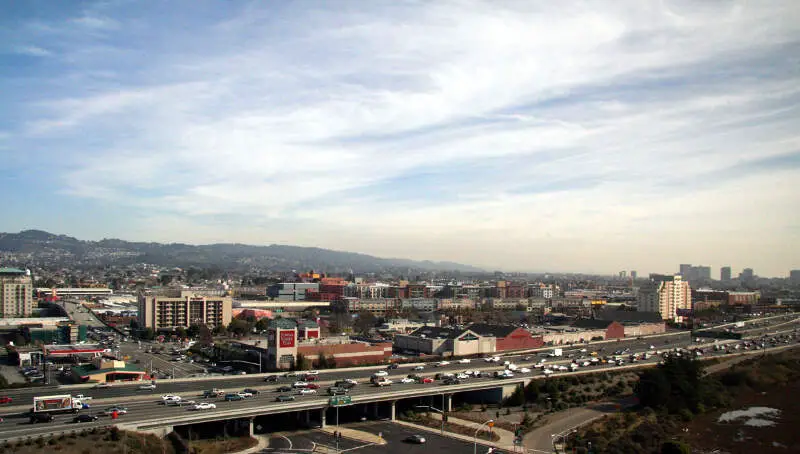
Four years running, and Emeryville still tops our list of the most dangerous places to live in California; not exactly a title they’re keen to hold onto, I’m sure. Located north of Oakland and east of San Francisco, Emeryville is also home to the Pixar Studios.
Those cute Pixar characters would be way out of their element if they landed in Emeryville, though, where they’d have a 1 in 90 chance of being the victim of a violent crime and a shocking 1 in 6 chance of being at the receiving end of a property crime.
So if you’re out for a shopping spree on Bay Street, be sure to get out quick, or your day’s haul could easily get snatched. The good news? Emeryville didn’t have a single murder last year, so that’s something.
/10
Population: 6,732
Violent Crimes Per 100k: 1,218 (Sixth most dangerous)
Property Crimes Per 100k: 6,045 (Eighth most dangerous)
Murders: 0
More on Crescent City: Data | Crime | Cost Of Living
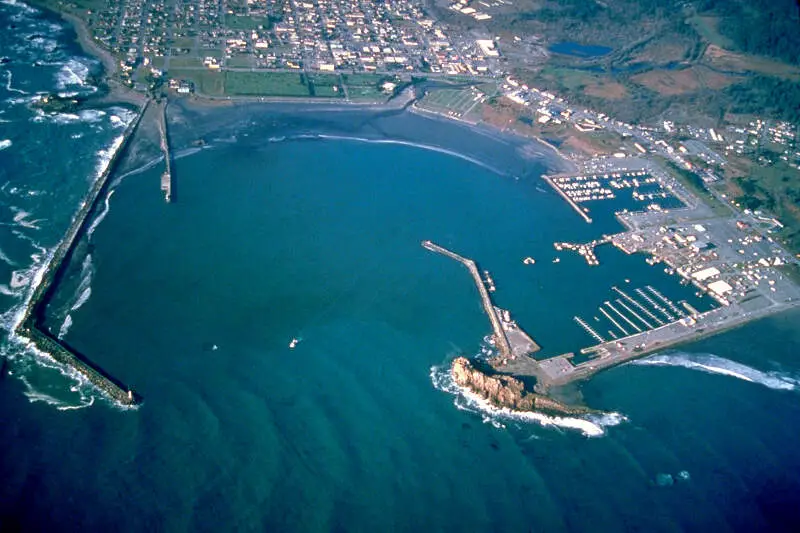
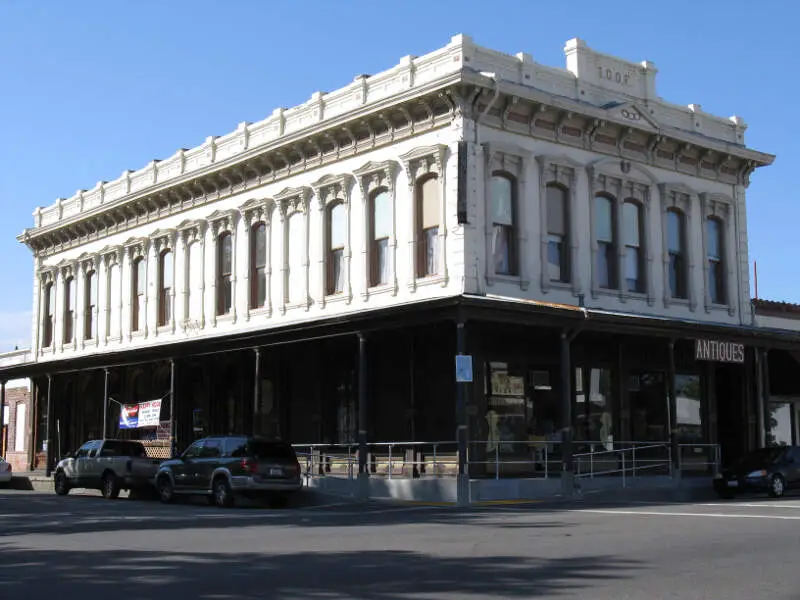
In purely geographical terms, Crescent City represents an excellent place to live. Located in the extreme north of the state, less than a half hour south of the Oregon border, the community sits along the Pacific coast. It even gets its name from a crescent-shaped beach nearby.
If only you could live there alone. Unfortunately, residents of Crescent City have reason to distrust their neighbors. After all, this is number 4 most dangerous spot in California.
For a community of just 6,732 people, the area experienced 82 violent crimes. This included 6 sexual assaults, giving it the number 19 scariest rate in this disturbing category.

/10
Population: 7,865
Violent Crimes Per 100k: 1,500 (Third most dangerous)
Property Crimes Per 100k: 4,704 (16th most dangerous)
Murders: 0
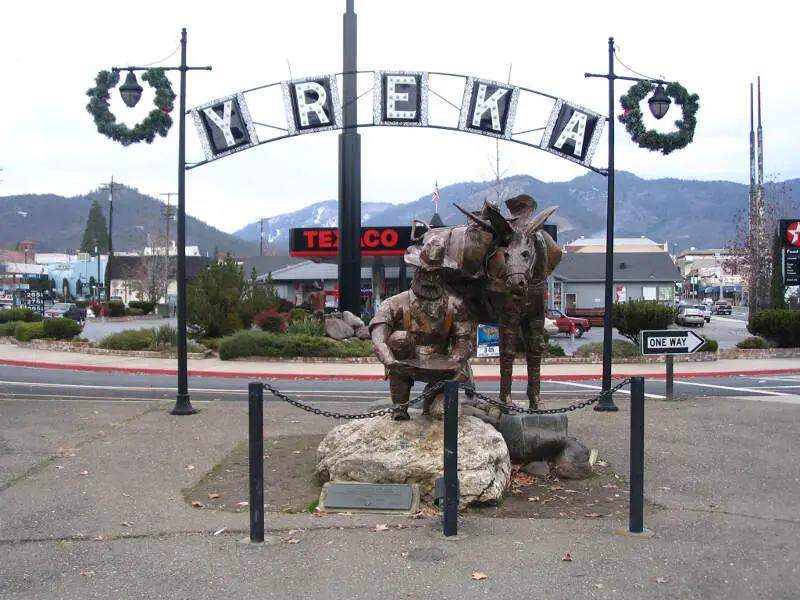
More on Yreka: Data | Crime | Cost Of Living
Yreka, the fifth most dangerous place to live in California, poses significant safety concerns for its residents. With a population of 7,865, this city in Siskiyou County has experienced a high rate of violent crime, including 118 incidents. Although the murder rate is relatively low, at 0 per capita, the overall violent crime rate is alarming, ranking Yreka as the third-highest in the state.
In addition to violent crime, property crime is also a significant issue in Yreka, with 370 reported incidents. Burglaries are particularly prevalent, with 35 cases recorded.

/10
Population: 34,185
Violent Crimes Per 100k: 947 (17th most dangerous)
Property Crimes Per 100k: 6,602 (Fourth most dangerous)
Murders: 0
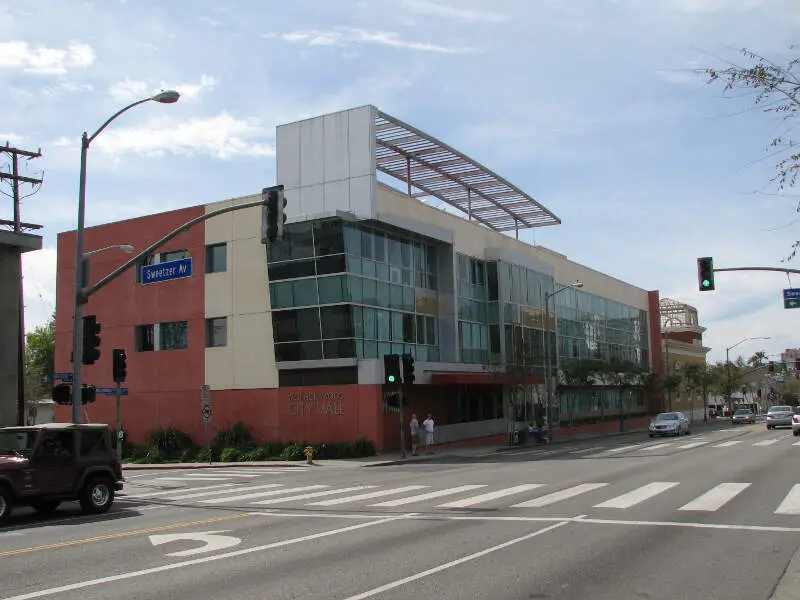
More on West Hollywood: Data | Crime | Cost Of Living
Hollywood is famous for producing films that showcase ungodly amounts of violence and property damage, but the real West Hollywood is a hub of such acts in its own right. West Hollywood’s property crime rate is the fourth highest in the state, and rape cases are the 57th highest.
West Hollywood somewhat makes up for these disappointing numbers by having one of the lowest rates of violent crime on this list, as well as an 8/10 overall SnackAbility score. Plus, it’s home to one of the largest LGBTQ communities in the nation, and the Sunset Strip is an excellent place to spend the day.

/10
Population: 14,529
Violent Crimes Per 100k: 915 (19th most dangerous)
Property Crimes Per 100k: 4,969 (12th most dangerous)
Murders: 1
More on Red Bluff: Data | Crime | Cost Of Living
Located on the northern edge of the Sacramento Valley, Red Bluff comes in as the seventh most dangerous place in California. While it may not be a major city, or near a major city, Red Bluff experienced a shocking rate of violent crime in 2022, the 19th highest statewide. So if you’re out for a day at the Sacramento River Bend, your reasons for bringing along some bear mace are twofold.
Property crime is slightly less of a problem in Red Bluff, but a 1 in 20 chance of being robbed or having your property damaged is certainly less than ideal. Unfortunately, Red Bluff also had the fifth highest rate of rape cases in California recorded in 2022.

/10
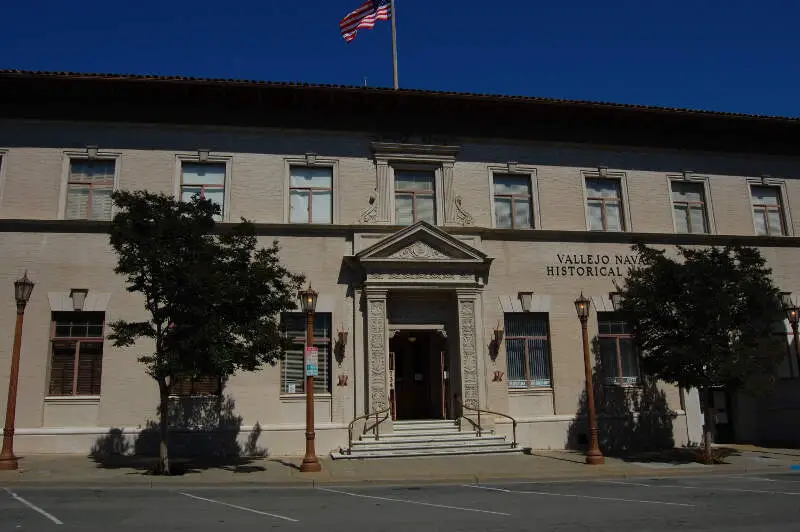
Population: 123,940
Violent Crimes Per 100k: 973 (16th most dangerous)
Property Crimes Per 100k: 4,231 (23rd most dangerous)
Murders: 22
More on Vallejo: Data | Crime | Cost Of Living
If you’re a true crime buff, you’ve heard of Vallejo. It was the site of one of the infamous Zodiac Killer murders during the 1960s. So, yeah, already a tough reputation for a community to live down.
But we’re not just talking the occasional weirdo serial killer here. Vallejo is overrun with the everyday stuff too — the kinds of crime that force people to invest in alarms and doorbell cameras. In fact, Vallejo ranks as the number 8 most dangerous spot in California. This includes the number 23 worst rate of burglaries. And, yes, even without the Zodiac Killer, the area reported 22 murders during the past year.

/10
Population: 8,015
Violent Crimes Per 100k: 1,185 (Eighth most dangerous)
Property Crimes Per 100k: 3,655 (35th most dangerous)
Murders: 0
More on Pismo Beach: Data | Crime | Cost Of Living
Pismo Beach, located in San Luis Obispo County, California, ranks as the ninth most dangerous place to live in the state. Pismo Beach reported 95 violent crimes. Additionally, property crime is a concern, with 293 cases reported. Burglary is particularly prevalent with 31 incidents recorded.
The location of Pismo Beach on the Central Coast area of California adds to its allure as a tourist destination and a desirable place to live. The transient population that comes for touristy reasons can add to the overall higher crime rate per capita.

/10
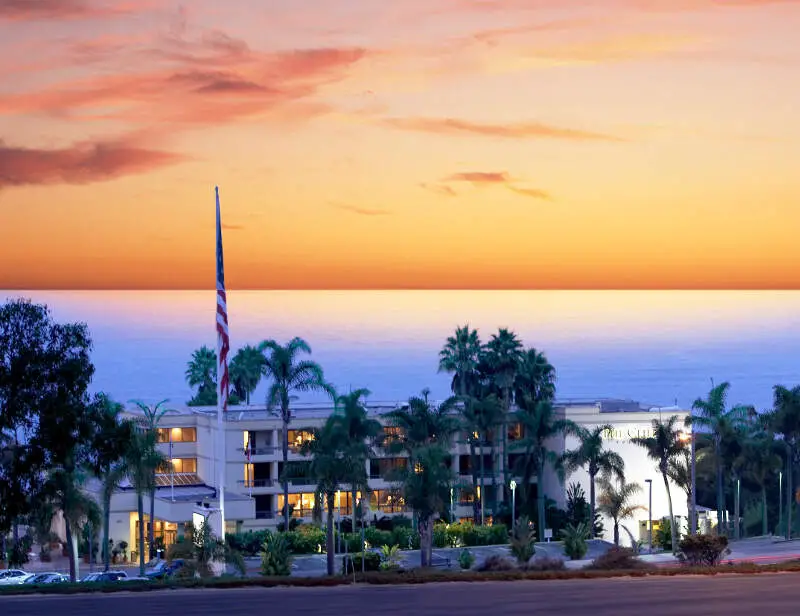
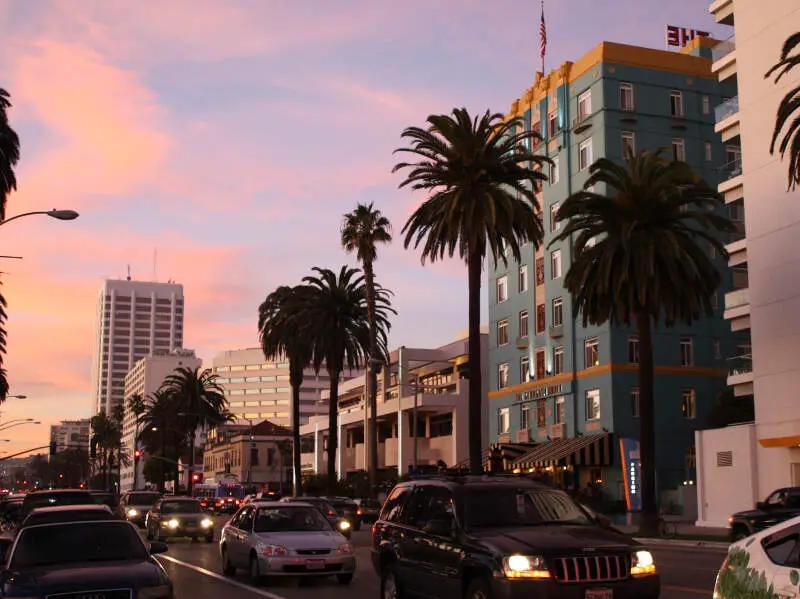
Population: 89,527
Violent Crimes Per 100k: 854 (26th most dangerous)
Property Crimes Per 100k: 4,531 (17th most dangerous)
Murders: 3
More on Santa Monica: Data | Crime | Cost Of Living
Santa Monica has a lot going for it; its titular pier is a favorite for locals and tourists alike, its beaches are world-class, and downtown is chock full of excellent entertainment, restaurants, and shops.
But there’s a seamy underbelly of crime in Santa Monica, much of it centered around the Pico neighborhood and its gang activity. So while Santa Monica’s property crime and violent crime rates are around the top ten worst in California, note that staying out of the city’s worst areas should yield a safe experience.
Crime By City In California
| Rank | City | Population | Total Crimes Per 100K | Violent Crimes Per 100K | Property Crimes Per 100K | Murders |
|---|---|---|---|---|---|---|
| 1 | Commerce | 11,787 | 15,415 | 1,552 | 13,862 | 6 |
| 2 | Oakland | 428,374 | 7,996 | 1,521 | 6,474 | 121 |
| 3 | Emeryville | 12,781 | 16,195 | 1,111 | 15,084 | 0 |
| 4 | Crescent City | 6,732 | 7,263 | 1,218 | 6,045 | 0 |
| 5 | Yreka | 7,865 | 6,204 | 1,500 | 4,704 | 0 |
| 6 | West Hollywood | 34,185 | 7,550 | 947 | 6,602 | 0 |
| 7 | Red Bluff | 14,529 | 5,884 | 915 | 4,969 | 1 |
| 8 | Vallejo | 123,940 | 5,205 | 973 | 4,231 | 22 |
| 9 | Pismo Beach | 8,015 | 4,840 | 1,185 | 3,655 | 0 |
| 10 | Santa Monica | 89,527 | 5,386 | 854 | 4,531 | 3 |
| 11 | Sonora | 5,025 | 5,194 | 815 | 4,378 | 0 |
| 12 | Signal Hill | 11,312 | 6,913 | 733 | 6,179 | 0 |
| 13 | Culver City | 39,271 | 6,236 | 735 | 5,500 | 0 |
| 14 | Oroville | 19,868 | 4,635 | 1,051 | 3,583 | 3 |
| 15 | Santa Fe Springs | 18,282 | 7,936 | 667 | 7,269 | 3 |
| 16 | San Francisco | 764,693 | 6,941 | 696 | 6,245 | 55 |
| 17 | El Segundo | 16,550 | 6,126 | 706 | 5,419 | 1 |
| 18 | Palm Springs | 45,463 | 5,655 | 699 | 4,955 | 5 |
| 19 | Huntington Park | 52,507 | 4,584 | 792 | 3,791 | 5 |
| 20 | Grass Valley | 13,895 | 4,195 | 1,245 | 2,950 | 1 |
| 21 | Fresno | 546,871 | 4,314 | 865 | 3,449 | 61 |
| 22 | San Bernardino | 222,623 | 4,140 | 1,185 | 2,954 | 72 |
| 23 | Sacramento | 526,671 | 4,068 | 901 | 3,167 | 54 |
| 24 | South El Monte | 19,523 | 5,091 | 645 | 4,446 | 1 |
| 25 | Eureka | 26,656 | 4,588 | 682 | 3,905 | 2 |
| 26 | Taft | 8,674 | 3,988 | 783 | 3,204 | 0 |
| 27 | Santa Cruz | 61,650 | 4,335 | 725 | 3,610 | 1 |
| 28 | Fort Bragg | 6,968 | 3,975 | 760 | 3,214 | 0 |
| 29 | Montclair | 38,203 | 4,735 | 625 | 4,109 | 3 |
| 30 | Stockton | 323,501 | 3,901 | 1,156 | 2,744 | 48 |
| 31 | Berkeley | 114,872 | 6,224 | 580 | 5,643 | 3 |
| 32 | Anderson | 11,447 | 4,114 | 628 | 3,485 | 0 |
| 33 | San Leandro | 86,465 | 5,497 | 577 | 4,919 | 4 |
| 34 | Compton | 91,625 | 3,813 | 1,140 | 2,672 | 19 |
| 35 | Gardena | 58,535 | 3,794 | 642 | 3,151 | 3 |
| 36 | Richmond | 115,043 | 3,583 | 873 | 2,709 | 17 |
| 37 | Malibu | 10,226 | 4,684 | 576 | 4,107 | 0 |
| 38 | Merced | 92,191 | 3,542 | 800 | 2,742 | 6 |
| 39 | Anaheim | 344,795 | 3,535 | 765 | 2,769 | 12 |
| 40 | Costa Mesa | 109,785 | 4,146 | 589 | 3,556 | 1 |
| 41 | Los Angeles | 3,809,182 | 3,542 | 834 | 2,708 | 387 |
| 42 | Inglewood | 102,879 | 3,564 | 664 | 2,899 | 17 |
| 43 | Lakeport | 5,171 | 3,442 | 870 | 2,572 | 0 |
| 44 | Corning | 8,191 | 3,577 | 610 | 2,966 | 0 |
| 45 | Pomona | 145,600 | 3,607 | 590 | 3,017 | 14 |
| 46 | Bakersfield | 411,873 | 4,518 | 546 | 3,972 | 38 |
| 47 | San Luis Obispo | 47,990 | 4,192 | 556 | 3,636 | 0 |
| 48 | Santa Maria | 109,518 | 3,425 | 650 | 2,774 | 10 |
| 49 | Concord | 122,982 | 3,444 | 643 | 2,800 | 4 |
| 50 | Atwater | 32,157 | 3,346 | 842 | 2,503 | 5 |
Methodology: How we determined the most dangerous cities in California for 2024?
Every year the FBI release two crime datasets on cities in California. First a preliminary dataset limited to the biggest cities in California, followed by a more detailed release at the end of the year.
For our analysis, we focused on the 2022 data, specifically the 2022 Crime In The United States Report for California.
So what criteria did we use? Have a look:
- Violent Crimes Per Capita
- Property Crimes Per Capita
In order to make the analysis as apples to apples as possible, we only considered California cities over 5,000 in population. That left us with 419 cities in California.
We then ranked each city from 1 to 419 for the two criteria with a #1 ranking being the most dangerous for the particular criteria.
Next, we averaged the two rankings into one “Dangerous Index”.
Finally, we ranked every city on the “Dangerous Index” with the lowest index being the most dangerous in California — Commerce. Any ties went to the smaller city.
This article is an opinion based on facts and is meant as infotainment. It is our tenth time ranking the most dangerous places to live in California and is updated for 2024.
Most Dangerous Places To Live In California FAQs
Yes, California is a dangerous state as it ranks as the #14 most dangerous state in the United States based on our analysis of the latest FBI Crime Data. The violent crime rate in California ranks 16th most dangerous in the United States — 19.54% worse than US average violent crime rate. The property crime rate in the Golden State ranks 18th most dangerous in the United States — 9.44% worse than US average property crime rate. The latest reporting year from the FBI was 2022.
Yes, Los Angeles is a dangerous city. Los Angeles ranks as the #123 most dangerous out of 328 major cities over 100,000 people in the United States based on our analysis of the latest FBI Crime Data. Keep in mind that are always safe and dangerous parts of any city, so even though Los Angeles might be considered dangerous you still need to be aware of where you are. For example, Bel Air is the safest in Los Angeles, while Downtown is considered dangerous by many based on recent crime stats.
Compared to other big cities, the violent crime rate in Los Angeles ranks 63rd highest in America — 50.69% worse than US average violent crime rate. The property crime rate in the ranks 148th highest in the United States — 0.74% better than US average property crime rate. Note the latest reporting year from the FBI was 2022 and that no city in America is ‘dangerous’. Despite the uptick in murders, it’s nothing like you’d see in Tijuana or Caracas where the murder rate is 2x any American city.
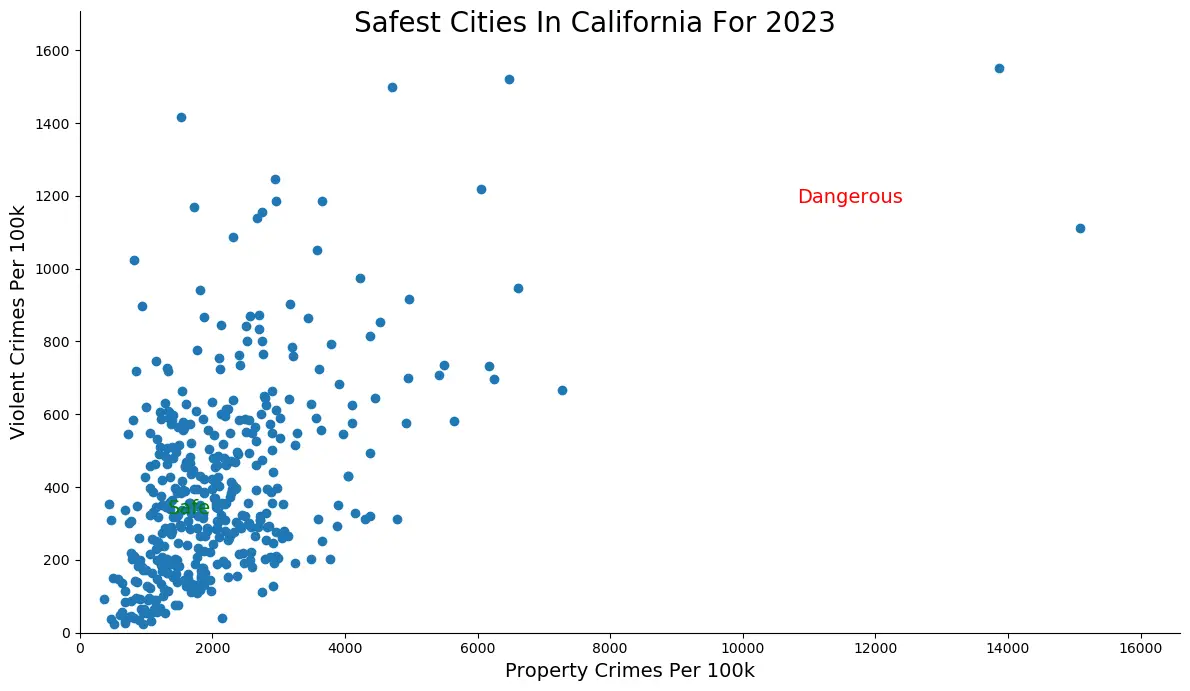
Graphing The Most Dangerous And Safest Places In California
Summary: Locking It All Up In California
So what is the most dangerous city in California? After analyzing 419 cities in California, Commerce takes the top spot as the most dangerous city in California based on the most recently reported FBI data — 2022.
The latest FBI crime data shows that Commerce ranks as the most dangerous city in California for 2024.
The most dangerous cities in California are .
We want to point out again that there’s still safes places in Commerce and that this isn’t a comment on the people that live there. So please don’t beat us up.
What is the most dangerous place in California for 2024? The most dangerous city in California is Commerce.
California’s crime numbers have also catapulted the state into ranking as the 14th most dangerous state in America. And sadly, California has nine of the most dangerous cities in the country.
Learn more about the safest places in California.
If you’re looking for something more national, check out the most dangerous cities in America or the most dangerous states in America.
Here are the safest cities in California:
- Saratoga (Pop. 29,306)
- Imperial (Pop. 21,626)
- Hillsborough (Pop. 10,678)
- Orinda (Pop. 19,441)
- Tiburon (Pop. 8,997)
- Moorpark (Pop. 35,692)
- Hughson (Pop. 7,542)
- Danville (Pop. 42,945)
- Rancho Santa Margarita (Pop. 46,889)
- Laguna Woods (Pop. 17,249)
For more California reading, check out:
- Best Places To Live In California
- Cheapest Places To Live In California
- Best Places To Raise A Family In California
- Safest Places In California
- Worst Places To Live In California
It would be good to see the entire list of cities
Stockton is the most horrible city I have ever been to, we got robbed, stole everything we had, and burned the moving trucks, the city is full of bastards. Don’t ever go there, it is a deadly, filthy, hell hole.
Hey! Not all of us are bastards 🙁
When are you planning to update this list with more recent data? I’m very curious to see where the CA cities net out now.
You forgot victorville,the Anus of the earth
In san Francisco, a major problem is cars windows being broken into for theft. As this is considered a “misdemeanor'” those who are caught are let go without being charged.
Likewise, bicycle theft.
This list is Garbage. I have lived in a few of these cities and there is no way that this list is accurate. Here is a better top 5 list.
Oakland
Los Angeles
Stockton
San Francisco
Victorville
Not necessarily in that order for all of them but… Grass Valley? REALLY? The Title of this article is These Are The 10 Most Dangerous Cities In California For 2017 and is clearly Clickbait! ALL of us who read it and this comment have all wasted our time.
Something seriously wrong with the data here.
Sacramento is safe? I’m foreigner.
Red Bluff??? No way.
These are “per capita” numbers. Big Bear Lake’s full-time population is 5,209 but it’s a resort town and its weekend and holiday population can be over 100,000. So the numbers are obviously skewed and proves that this article has a very flawed formula.
This article is bull I live in Red Bluff, Ca nothing happens in Red Bluff. This town is so dead and lifeless that you can hear the crickets chirping at night. So go f yourself. You’re probably some snot nose liberal that’s got his/her thumb up their..
yeah red bluff is pretty conservative which is why its gon be all right
AHAHAHAHAH! What a complete GARBAGE list I’ve ever seen.
Have you ever been to Carson, South Gate, Stockton, Modesto, Oakland, and other notorious places? Of course not, because you listed the sleepy community of Grass Valley on this list. Do you have any idea what Grass Valley is like? Seriously, this list is absolute trash you and have to stop posting this list. It’s completely flawed and is lying directly to the reader’s faces.
I live in Grass Valley. This year alone six dead (so far) on 49 and 20 by reckless /drunk drivers. Alcoholism is rampant. Multiple murder cases, robberies with assault, graft. Your the clueless self righteous no nothing idiot.
First if all, San Bernardino is in Southern California, it is over 300 miles away so fact check .
This list is straight up bs. Culver City is more dangerous than Inglewood??? Lmao.
TRASH list I’m gay and live in San Francisco with my boyfriend and nothing happens there im really offended
Carson is the most dangerous in the South Bay 310 area
RE San Francisco: “but hey — the numbers don’t lie.” “These numbers are much worse than Los Angeles, and they’re only getting worse.”
The numbers aren’t lying, but the author is definitely screwing with the facts. At the bottom, the list shows San Francisco’s violent crime per capita rate is smaller than Los Angeles (715 vs 716), and by all accounts, the trend shows the violent crime rates in both cities are declining, not getting worse.
All you guys Cap’n, n just over exaggerating cause stockton not even that bad stockton full of nice ppl
That’s so true. I’m from Stockton — lived in Stockton my whole life — yea there’s a couple of bad thing, but mostly good people and nice people.
Could be a good correlation
what about Fresno?
Show me a place run by democrats and I’ll show you a place that is or is turning into a ghetto. Detroit, Seattle, Portland, San Fran, Oakland, etc…
Stockton is an ok place to live. I live here currently and we have been egged, and our mail has been stolen, and more bad things, but we do have nice neighbors. Stockton is getting worse by the year, but it’s not that bad for now…
Oakland is scary as f—, Stockton and Fresno are shady as f—-, Modesto is a nightmare.
You wonder why the liberal areas of Los Angeles (Hollywood, Santa Monica) and San Francisco (Oakland, Emeryville) are on a list stating a lack of rehabilitation programs and high unemployment. Geez, I thought the libs were supposed to be taking care of everyone. Not doing such a good job, eh?