
Whitest cities in Indiana research summary. We analyzed Indiana’s most recent Census data to determine the whitest cities in Indiana based on the percentage of White residents. Here are the results of our analysis:
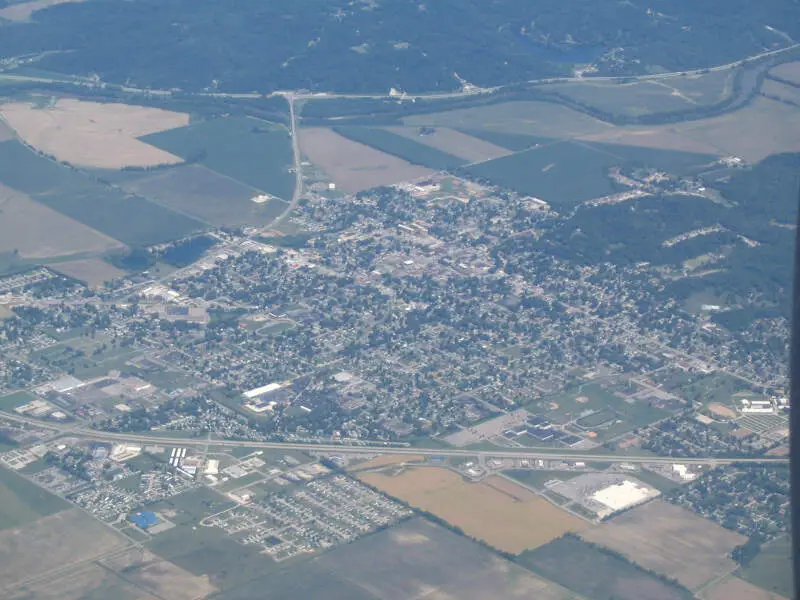
The whitest city in Indiana is Boonville based on the most recent Census data.
Boonville is 95.48% White.
The least White city in Indiana is East Chicago.
East Chicago is 6.56% White.
Indiana is 76.1% White.
Indiana is the 17th Whitest state in the United States.
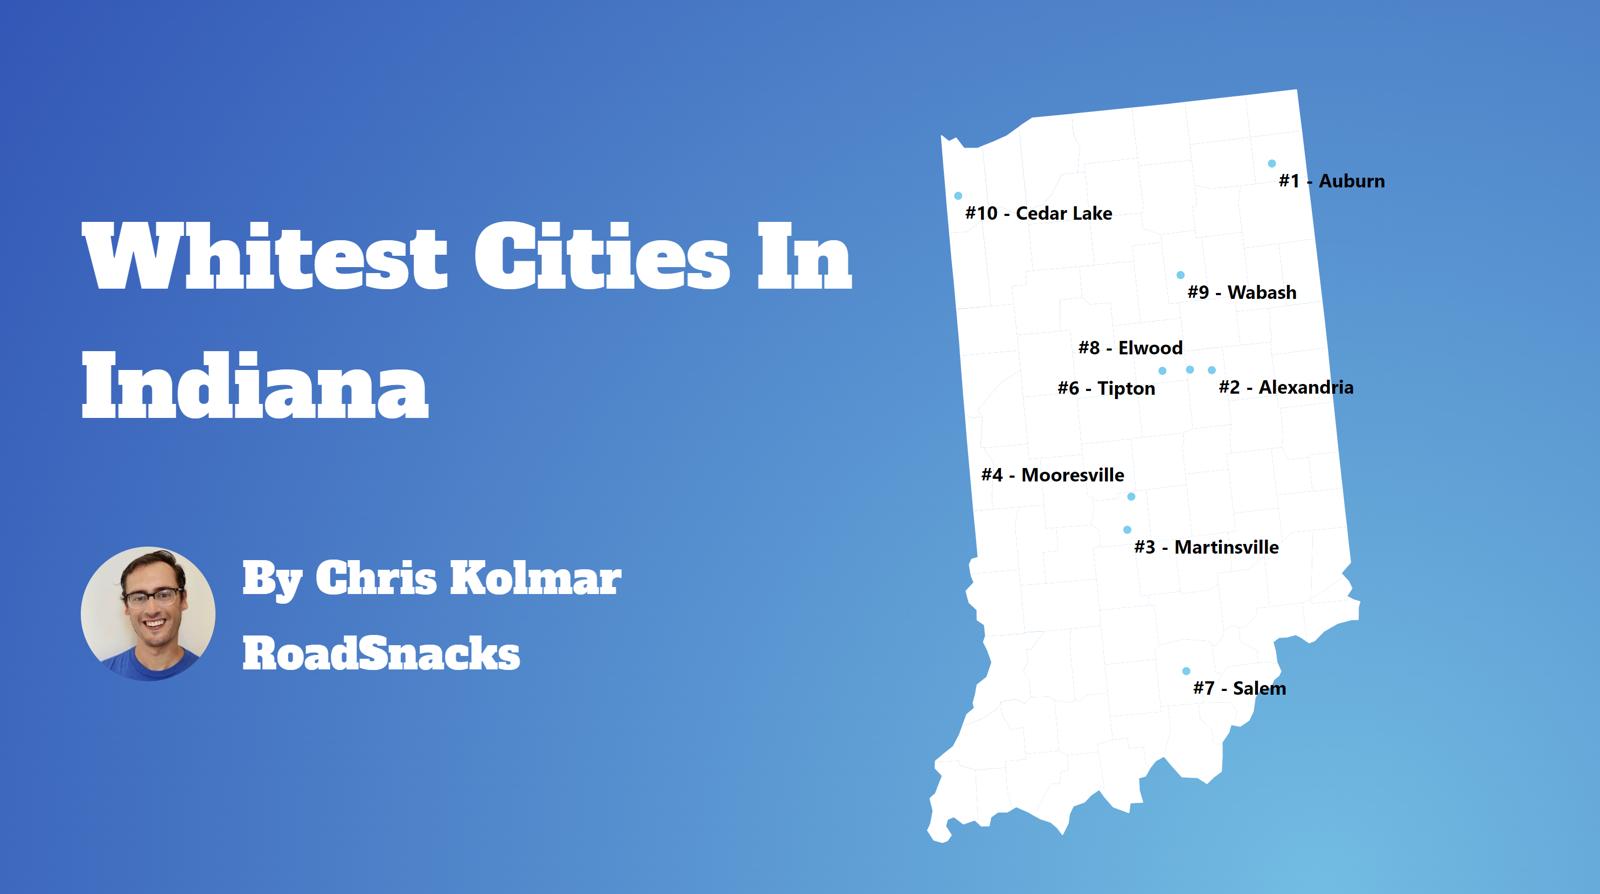
Table Of Contents: Top Ten | Methodology | Summary | Table
Today, we are looking at the whitest places in Indiana. We won’t measure the number of Whole Foods or Pottery Barns per capita. Instead, we’ll focus on the Census data’s report of race by place in Indiana. In particular, we ranked each place in Indiana by the percentage of white people.
So where are the whitest cities you can live in Indiana?
After analyzing cities with populations greater than 5,000, we came up with this list as the whitest cities in Indiana for 2025.Here are the 10 whites places in Indiana for 2025:
What is the whitest city in Indiana for 2025? According to the most recent census data Boonville ranks as the whitest. If you’re wondering, East Chicago is the least white city of all those we measured.
Read on below to see where your hometown ranked and why. Or check out the whitest states in America and the most diverse states in America.
For more Indiana reading, check out:
The 10 Whitest Cities In Indiana For 2025

/10
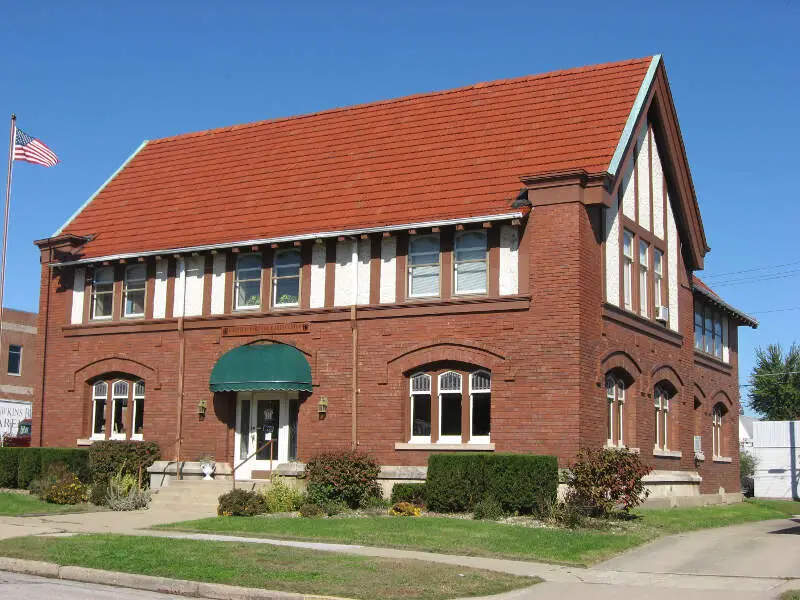
Population: 6,681
% White: 95.48%
More on Boonville: Data
/10
Population: 5,685
% White: 95.46%
More on Hartford City: Data

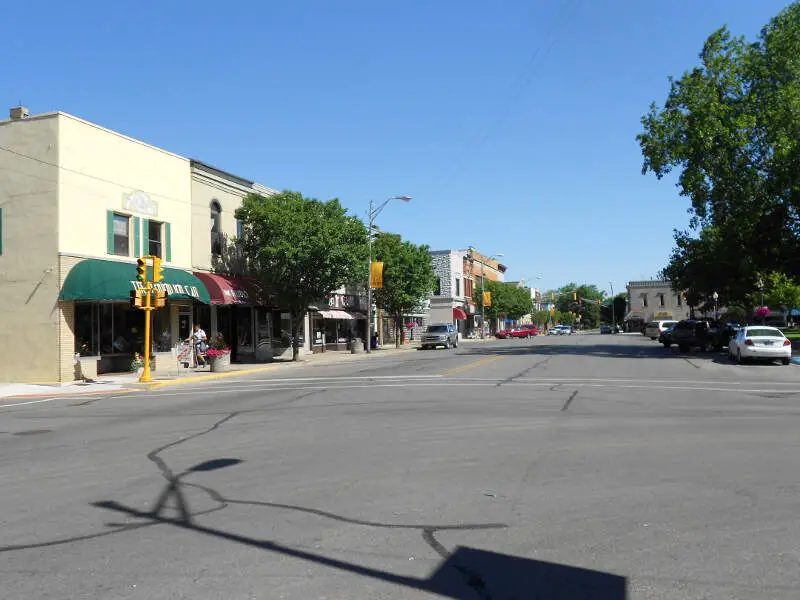
/10
Population: 13,464
% White: 95.37%
More on Auburn: Data

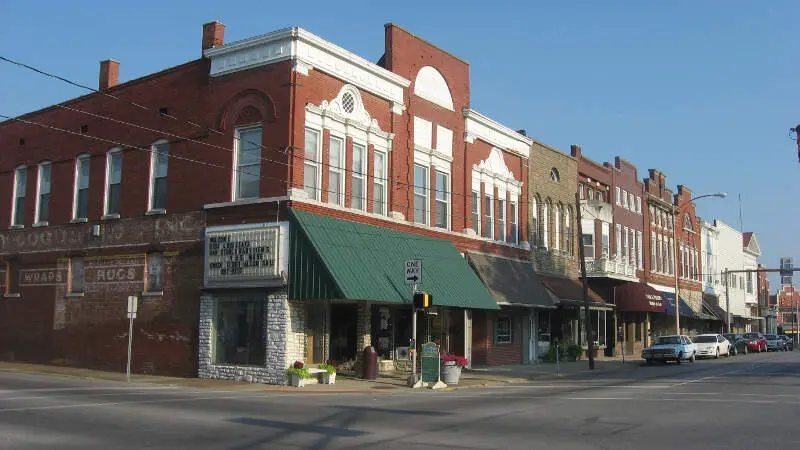
/10
Population: 6,484
% White: 95.08%
More on Salem: Data

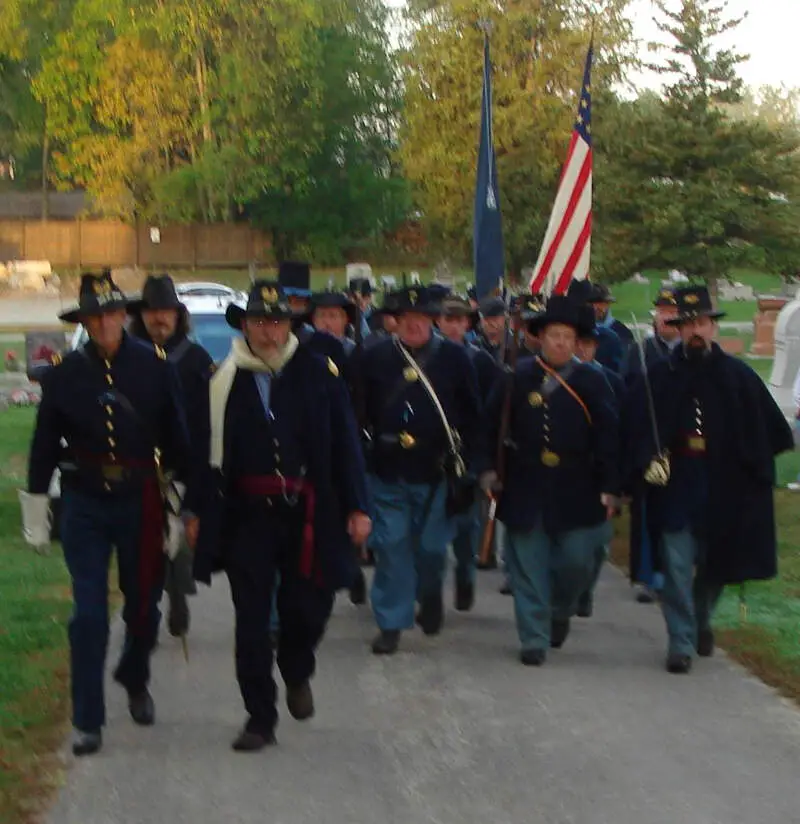
/10
Population: 11,913
% White: 94.64%
More on Martinsville: Data

/10
Population: 9,608
% White: 94.49%
More on Mooresville: Data

/10
Population: 6,653
% White: 94.05%
More on Ellettsville: Data
/10
Population: 5,145
% White: 93.84%
More on Alexandria: Data
/10
Population: 5,153
% White: 93.77%
More on Linton: Data

/10
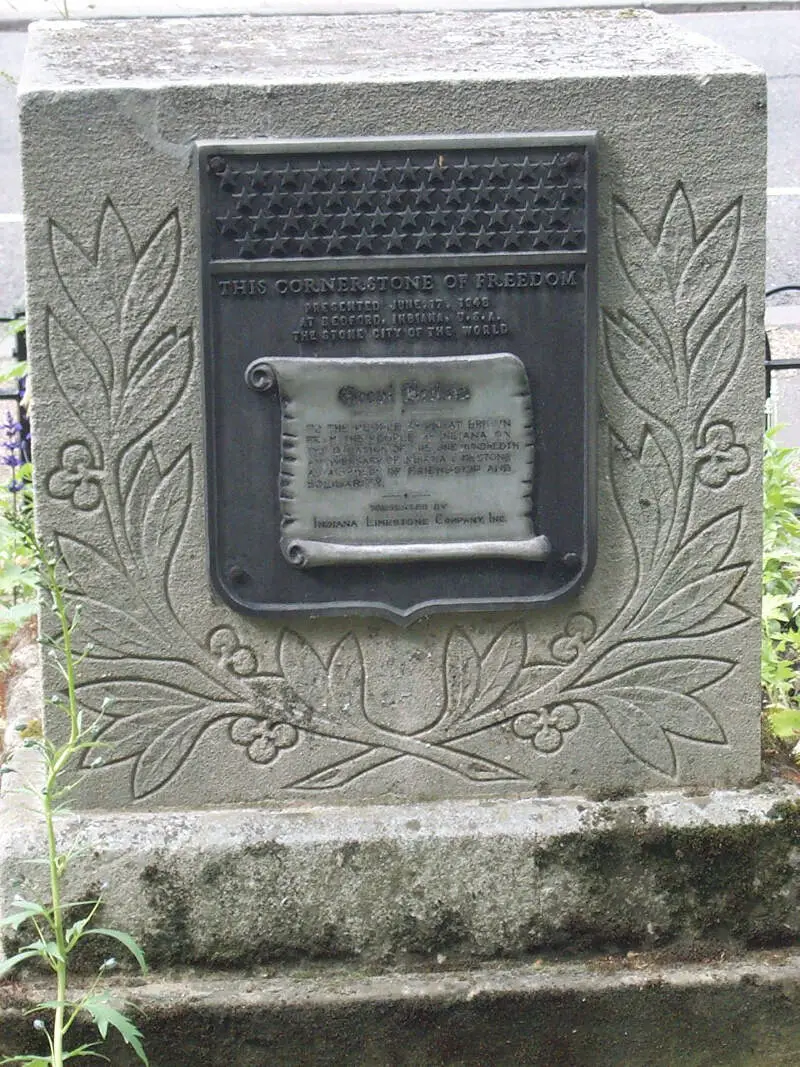
Population: 13,824
% White: 93.67%
More on Bedford: Data
To rank the whitest places in Indiana, we used Saturday Night Science to look at Census demographic data. We had to look at the number of white people living in each city in Indiana on a per capita basis. In other words, the percentage of white people living in each city in Indiana. We looked at table B03002: Hispanic OR LATINO ORIGIN BY RACE. Here are the category names as defined by the Census: Our particular column of interest here was the number of people who identified as White alone. We limited our analysis to town with a population greater than 5,000 people. That left us with 112 cities. We then calculated the percentage of residents that are White. The percentages ranked from 95.5% to 6.6%. Finally, we ranked each city based on the percentage of White population, with a higher score being more White than a lower score. Boonville took the distinction of being the most White, while East Chicago was the least White city. We updated this article for 2025. This report represents our tenth time ranking the whitest cities in Indiana. Read on for more information on how the cities in Indiana ranked by population of White residents or, for a more general take on diversity in America, head over to our ranking of the most diverse cities in America. We measured the locations with the highest percentage of white people in Indiana. According to the most recent data, this list provides accurate information on the whitest places in Indiana. The most White cities in Indiana are Boonville, Hartford City, Auburn, Salem, Martinsville, Mooresville, Ellettsville, Alexandria, Linton, and Bedford. If you’re curious enough, here are the least White places in Indiana: For more Indiana reading, check out:Methodology: How we determined the whitest places in Indiana for 2025
Summary: White Populations Across Indiana
White Population By City In Indiana
Rank City Population White Population % White 1 Boonville 6,681 6,379 95.48% 2 Hartford City 5,685 5,427 95.46% 3 Auburn 13,464 12,840 95.37% 4 Salem 6,484 6,165 95.08% 5 Martinsville 11,913 11,275 94.64% 6 Mooresville 9,608 9,079 94.49% 7 Ellettsville 6,653 6,257 94.05% 8 Alexandria 5,145 4,828 93.84% 9 Linton 5,153 4,832 93.77% 10 Bedford 13,824 12,949 93.67% 11 Elwood 8,320 7,778 93.49% 12 Tell City 7,490 6,989 93.31% 13 Brazil 8,064 7,500 93.01% 14 Yor 11,617 10,765 92.67% 15 Connersville 13,241 12,196 92.11% 16 Wabash 10,378 9,553 92.05% 17 Batesville 6,842 6,292 91.96% 18 Danville 11,049 10,136 91.74% 19 Rushville 6,186 5,664 91.56% 20 Greenfield 24,308 22,255 91.55% 21 Tipton 5,255 4,806 91.46% 22 Madison 12,277 11,206 91.28% 23 Garrett 6,540 5,962 91.16% 24 Sellersburg 10,215 9,307 91.11% 25 Huntington 17,026 15,500 91.04% 26 Mount Vernon 6,431 5,851 90.98% 27 Greensburg 11,585 10,514 90.76% 28 Franklin 25,999 23,463 90.25% 29 Columbia City 9,975 8,954 89.76% 30 Bluffton 10,539 9,415 89.33% 31 New Castle 17,356 15,356 88.48% 32 Lebanon 17,575 15,503 88.21% 33 Scottsburg 7,338 6,460 88.03% 34 Cedar Lake 14,686 12,920 87.97% 35 North Vernon 7,214 6,334 87.8% 36 Monticello 5,504 4,831 87.77% 37 Angola 9,383 8,229 87.7% 38 Jasper 16,421 14,383 87.59% 39 Kendallville 10,094 8,827 87.45% 40 Decatur 9,769 8,498 86.99% 41 Peru 10,835 9,395 86.71% 42 Portland 6,341 5,492 86.61% 43 Gas City 6,097 5,260 86.27% 44 Zionsville 31,442 27,038 85.99% 45 New Haven 15,339 13,176 85.9% 46 Crawfordsville 16,408 14,042 85.58% 47 Lowell 10,911 9,304 85.27% 48 Chesterton 14,326 12,123 84.62% 49 Vincennes 16,676 14,059 84.31% 50 Shelbyville 19,866 16,747 84.3% 51 Beech Grove 15,082 12,580 83.41% 52 Rensselaer 5,369 4,474 83.33% 53 New Whiteland 5,641 4,686 83.07% 54 Noblesville 71,940 59,374 82.53% 55 Rochester 6,244 5,151 82.5% 56 Greencastle 9,863 8,118 82.31% 57 Princeton 8,347 6,854 82.11% 58 Brownsburg 30,310 24,703 81.5% 59 Dyer 16,400 13,241 80.74% 60 St. John 21,639 17,424 80.52% 61 Valparaiso 34,377 27,644 80.41% 62 Charlestown 8,118 6,501 80.08% 63 New Albany 37,589 30,079 80.02% 64 Kokomo 59,375 47,132 79.38% 65 Richmond 35,551 28,201 79.33% 66 Muncie 64,739 50,988 78.76% 67 Terre Haute 58,491 46,062 78.75% 68 La Porte 22,125 16,799 75.93% 69 Nappanee 7,040 5,340 75.85% 70 Carmel 100,501 76,107 75.73% 71 Mishawaka 50,907 38,511 75.65% 72 Bloomington 78,791 59,518 75.54% 73 Evansville 116,441 87,955 75.54% 74 Warsaw 16,592 12,526 75.49% 75 Greenwood 64,237 48,457 75.43% 76 Marion 27,384 20,501 74.86% 77 Crown Point 34,042 25,388 74.58% 78 Washington 12,192 9,085 74.52% 79 Jeffersonville 50,176 37,046 73.83% 80 Cumberland 6,154 4,529 73.59% 81 Anderson 54,930 39,777 72.41% 82 Plainfield 35,783 25,874 72.31% 83 Columbus 51,104 36,595 71.61% 84 Lafayette 70,650 50,403 71.34% 85 Munster 23,733 16,837 70.94% 86 Clarksville 22,121 15,663 70.81% 87 Schererville 29,627 20,615 69.58% 88 Avon 22,683 15,670 69.08% 89 Plymouth 10,506 7,149 68.05% 90 Highland 23,749 15,945 67.14% 91 Portage 37,951 25,336 66.76% 92 Seymour 21,536 14,345 66.61% 93 West Lafayette 44,802 29,759 66.42% 94 Hobart 29,646 19,445 65.59% 95 Westville 5,291 3,468 65.55% 96 Frankfort 15,536 10,078 64.87% 97 Fort Wayne 266,235 169,757 63.76% 98 Griffith 16,228 10,175 62.7% 99 Huntingburg 6,504 4,004 61.56% 100 Logansport 17,766 10,871 61.19%