
Whitest cities in Indiana research summary. We analyzed Indiana’s most recent Census data to determine the whitest cities in Indiana based on the percentage of White residents. Here are the results of our analysis:
-
The whitest city in Indiana is Boonville based on the most recent Census data.
-
Boonville is 95.48% White.
-
The least White city in Indiana is East Chicago.
-
East Chicago is 6.56% White.
-
Indiana is 76.1% White.
-
Indiana is the 17th Whitest state in the United States.
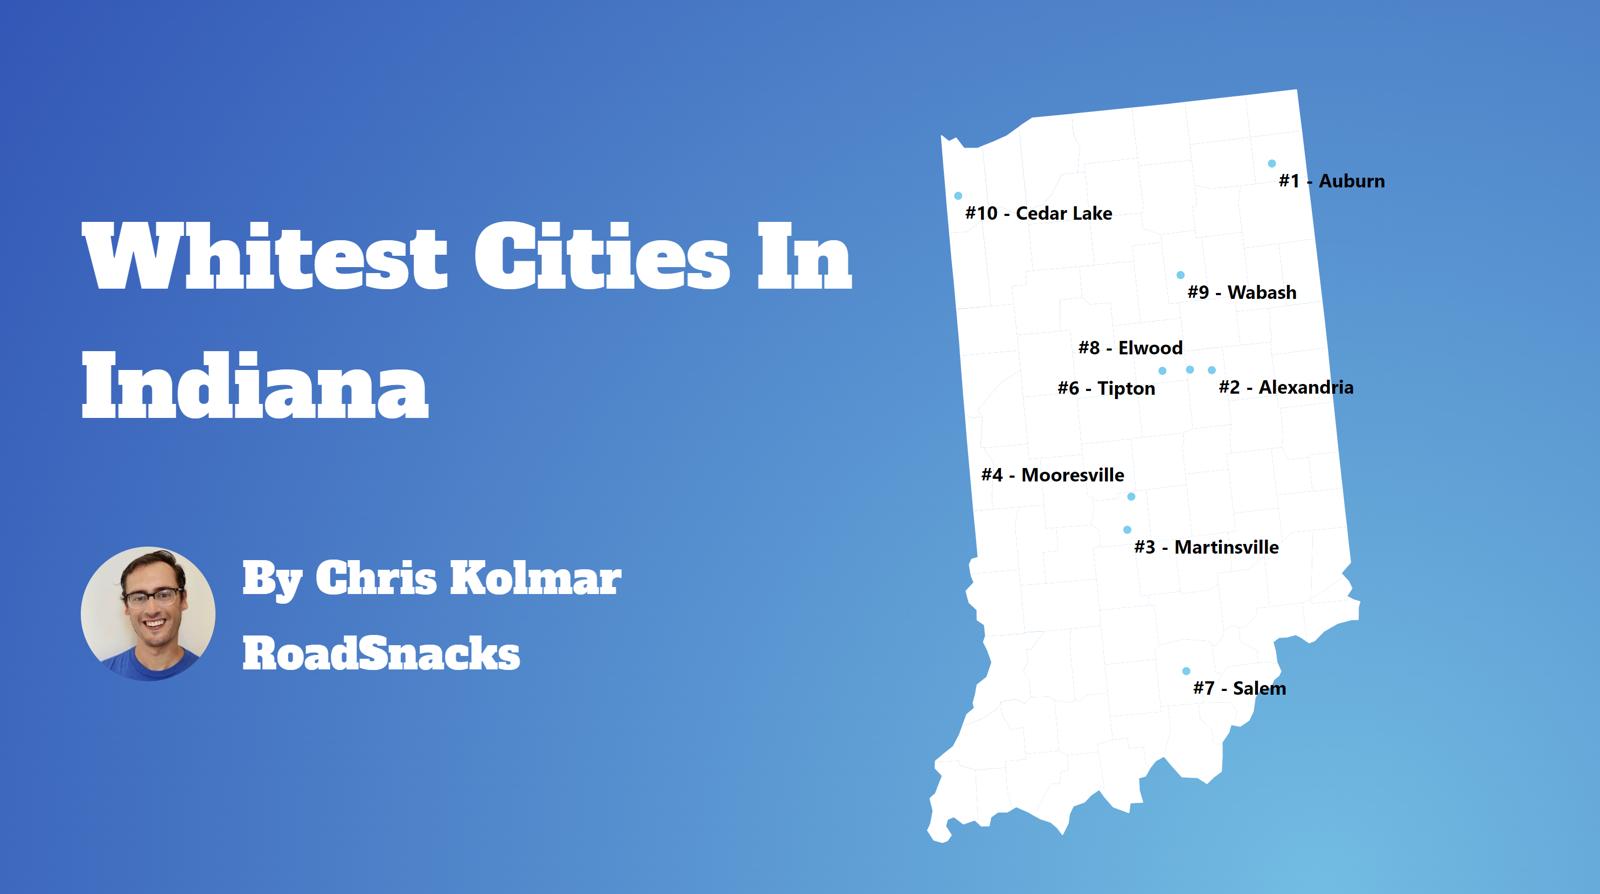
Table Of Contents: Top Ten | Methodology | Summary | Table
Today, we are looking at the whitest places in Indiana. We won’t measure the number of Whole Foods or Pottery Barns per capita. Instead, we’ll focus on the Census data’s report of race by place in Indiana. In particular, we ranked each place in Indiana by the percentage of white people.
So where are the whitest cities you can live in Indiana?
After analyzing cities with populations greater than 5,000, we came up with this list as the whitest cities in Indiana for 2025.
Here are the 10 whites places in Indiana for 2025:
What is the whitest city in Indiana for 2025? According to the most recent census data Boonville ranks as the whitest. If you’re wondering, East Chicago is the least white city of all those we measured.
Read on below to see where your hometown ranked and why. Or check out the whitest states in America and the most diverse states in America.
For more Indiana reading, check out:
The 10 Whitest Cities In Indiana For 2025

/10
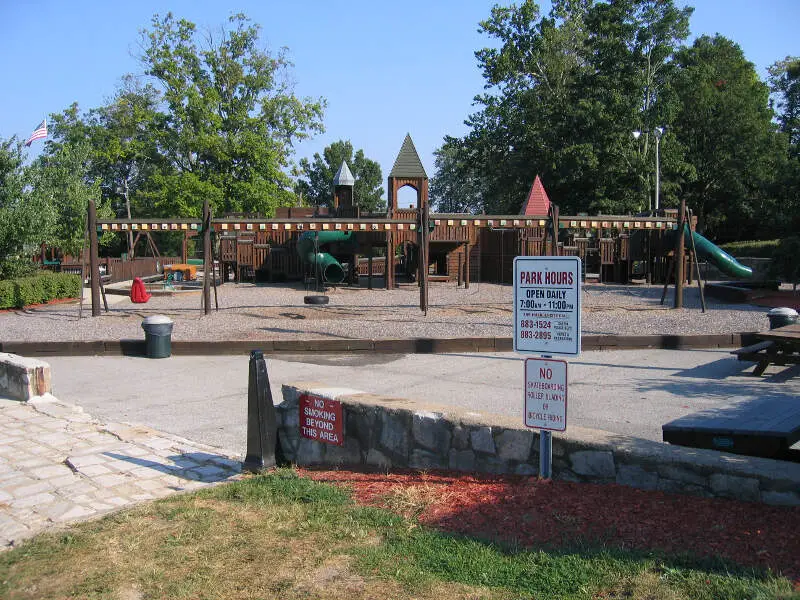
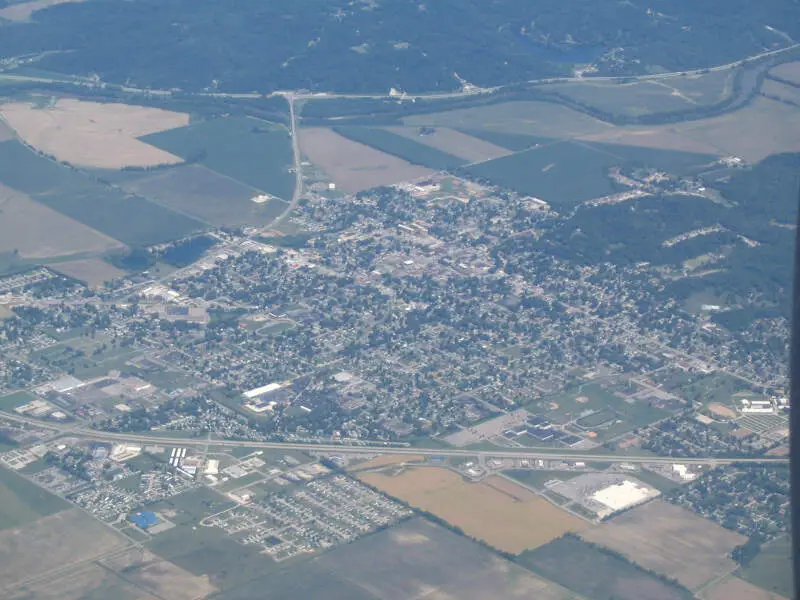
Population: 6,681
% White: 95.48%
More on Boonville: Data
/10
Population: 5,685
% White: 95.46%
More on Hartford City: Data

/10
Population: 13,464
% White: 95.37%
More on Auburn: Data

/10
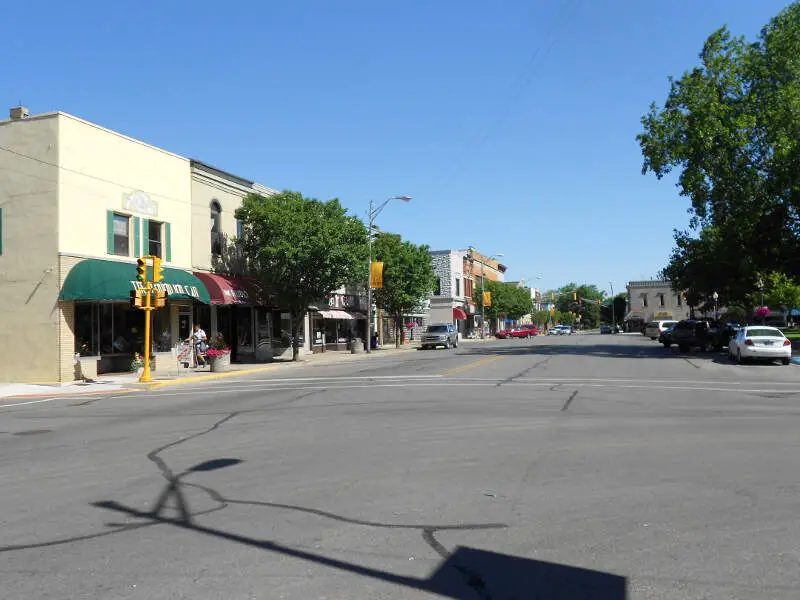
Population: 6,484
% White: 95.08%
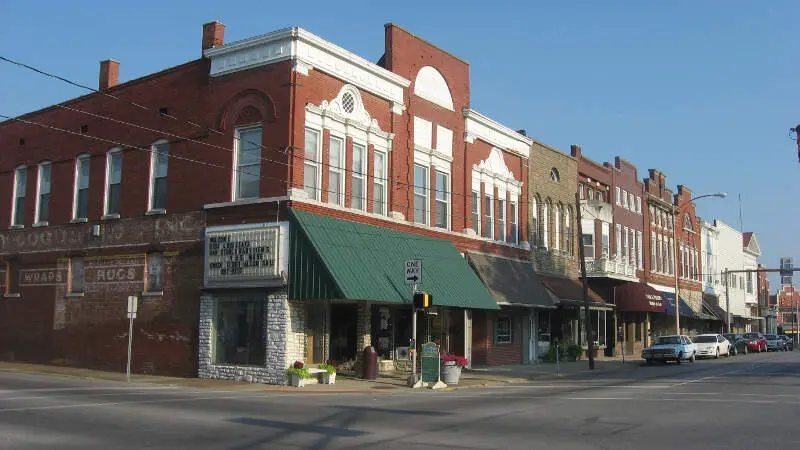
More on Salem: Data

/10
Population: 11,913
% White: 94.64%
More on Martinsville: Data

/10
Population: 9,608
% White: 94.49%
More on Mooresville: Data

/10
Population: 6,653
% White: 94.05%
More on Ellettsville: Data
/10
Population: 5,145
% White: 93.84%
More on Alexandria: Data
/10
Population: 5,153
% White: 93.77%
More on Linton: Data

/10
Population: 13,824
% White: 93.67%
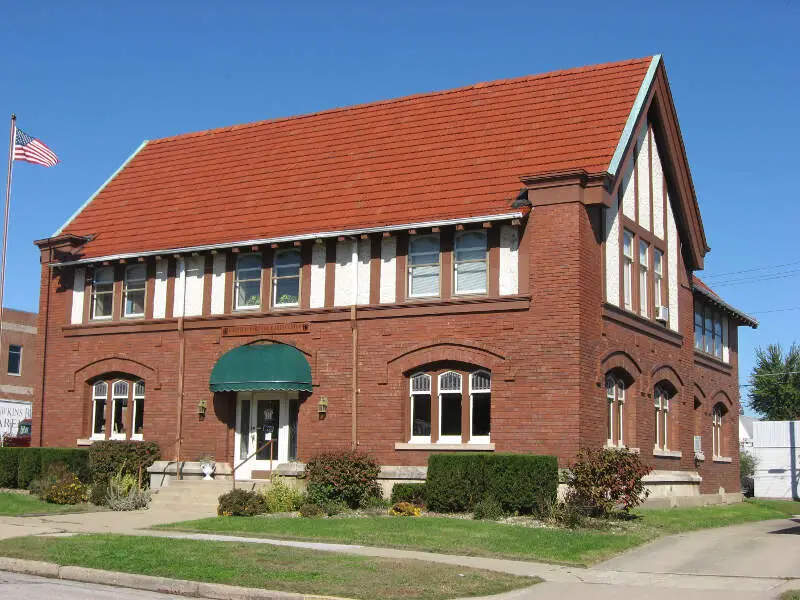
More on Bedford: Data
Methodology: How we determined the whitest places in Indiana for 2025
To rank the whitest places in Indiana, we used Saturday Night Science to look at Census demographic data.
We had to look at the number of white people living in each city in Indiana on a per capita basis. In other words, the percentage of white people living in each city in Indiana.
We looked at table B03002: Hispanic OR LATINO ORIGIN BY RACE. Here are the category names as defined by the Census:
- Hispanic or Latino
- White alone*
- Black or African American alone*
- American Indian and Alaska Native alone*
- Asian alone*
- Native Hawaiian and Other Pacific Islander alone*
- Some other race alone*
- Two or more races*
Our particular column of interest here was the number of people who identified as White alone.
We limited our analysis to town with a population greater than 5,000 people. That left us with 112 cities.
We then calculated the percentage of residents that are White. The percentages ranked from 95.5% to 6.6%.
Finally, we ranked each city based on the percentage of White population, with a higher score being more White than a lower score. Boonville took the distinction of being the most White, while East Chicago was the least White city.
We updated this article for 2025. This report represents our tenth time ranking the whitest cities in Indiana.
Read on for more information on how the cities in Indiana ranked by population of White residents or, for a more general take on diversity in America, head over to our ranking of the most diverse cities in America.
Summary: White Populations Across Indiana
We measured the locations with the highest percentage of white people in Indiana. According to the most recent data, this list provides accurate information on the whitest places in Indiana.
The most White cities in Indiana are Boonville, Hartford City, Auburn, Salem, Martinsville, Mooresville, Ellettsville, Alexandria, Linton, and Bedford.
If you’re curious enough, here are the least White places in Indiana:
- East Chicago
- Gary
- Hammond
For more Indiana reading, check out:
White Population By City In Indiana
| Rank | City | Population | White Population | % White |
|---|---|---|---|---|
| 1 | Boonville | 6,681 | 6,379 | 95.48% |
| 2 | Hartford City | 5,685 | 5,427 | 95.46% |
| 3 | Auburn | 13,464 | 12,840 | 95.37% |
| 4 | Salem | 6,484 | 6,165 | 95.08% |
| 5 | Martinsville | 11,913 | 11,275 | 94.64% |
| 6 | Mooresville | 9,608 | 9,079 | 94.49% |
| 7 | Ellettsville | 6,653 | 6,257 | 94.05% |
| 8 | Alexandria | 5,145 | 4,828 | 93.84% |
| 9 | Linton | 5,153 | 4,832 | 93.77% |
| 10 | Bedford | 13,824 | 12,949 | 93.67% |
| 11 | Elwood | 8,320 | 7,778 | 93.49% |
| 12 | Tell City | 7,490 | 6,989 | 93.31% |
| 13 | Brazil | 8,064 | 7,500 | 93.01% |
| 14 | Yor | 11,617 | 10,765 | 92.67% |
| 15 | Connersville | 13,241 | 12,196 | 92.11% |
| 16 | Wabash | 10,378 | 9,553 | 92.05% |
| 17 | Batesville | 6,842 | 6,292 | 91.96% |
| 18 | Danville | 11,049 | 10,136 | 91.74% |
| 19 | Rushville | 6,186 | 5,664 | 91.56% |
| 20 | Greenfield | 24,308 | 22,255 | 91.55% |
| 21 | Tipton | 5,255 | 4,806 | 91.46% |
| 22 | Madison | 12,277 | 11,206 | 91.28% |
| 23 | Garrett | 6,540 | 5,962 | 91.16% |
| 24 | Sellersburg | 10,215 | 9,307 | 91.11% |
| 25 | Huntington | 17,026 | 15,500 | 91.04% |
| 26 | Mount Vernon | 6,431 | 5,851 | 90.98% |
| 27 | Greensburg | 11,585 | 10,514 | 90.76% |
| 28 | Franklin | 25,999 | 23,463 | 90.25% |
| 29 | Columbia City | 9,975 | 8,954 | 89.76% |
| 30 | Bluffton | 10,539 | 9,415 | 89.33% |
| 31 | New Castle | 17,356 | 15,356 | 88.48% |
| 32 | Lebanon | 17,575 | 15,503 | 88.21% |
| 33 | Scottsburg | 7,338 | 6,460 | 88.03% |
| 34 | Cedar Lake | 14,686 | 12,920 | 87.97% |
| 35 | North Vernon | 7,214 | 6,334 | 87.8% |
| 36 | Monticello | 5,504 | 4,831 | 87.77% |
| 37 | Angola | 9,383 | 8,229 | 87.7% |
| 38 | Jasper | 16,421 | 14,383 | 87.59% |
| 39 | Kendallville | 10,094 | 8,827 | 87.45% |
| 40 | Decatur | 9,769 | 8,498 | 86.99% |
| 41 | Peru | 10,835 | 9,395 | 86.71% |
| 42 | Portland | 6,341 | 5,492 | 86.61% |
| 43 | Gas City | 6,097 | 5,260 | 86.27% |
| 44 | Zionsville | 31,442 | 27,038 | 85.99% |
| 45 | New Haven | 15,339 | 13,176 | 85.9% |
| 46 | Crawfordsville | 16,408 | 14,042 | 85.58% |
| 47 | Lowell | 10,911 | 9,304 | 85.27% |
| 48 | Chesterton | 14,326 | 12,123 | 84.62% |
| 49 | Vincennes | 16,676 | 14,059 | 84.31% |
| 50 | Shelbyville | 19,866 | 16,747 | 84.3% |
| 51 | Beech Grove | 15,082 | 12,580 | 83.41% |
| 52 | Rensselaer | 5,369 | 4,474 | 83.33% |
| 53 | New Whiteland | 5,641 | 4,686 | 83.07% |
| 54 | Noblesville | 71,940 | 59,374 | 82.53% |
| 55 | Rochester | 6,244 | 5,151 | 82.5% |
| 56 | Greencastle | 9,863 | 8,118 | 82.31% |
| 57 | Princeton | 8,347 | 6,854 | 82.11% |
| 58 | Brownsburg | 30,310 | 24,703 | 81.5% |
| 59 | Dyer | 16,400 | 13,241 | 80.74% |
| 60 | St. John | 21,639 | 17,424 | 80.52% |
| 61 | Valparaiso | 34,377 | 27,644 | 80.41% |
| 62 | Charlestown | 8,118 | 6,501 | 80.08% |
| 63 | New Albany | 37,589 | 30,079 | 80.02% |
| 64 | Kokomo | 59,375 | 47,132 | 79.38% |
| 65 | Richmond | 35,551 | 28,201 | 79.33% |
| 66 | Muncie | 64,739 | 50,988 | 78.76% |
| 67 | Terre Haute | 58,491 | 46,062 | 78.75% |
| 68 | La Porte | 22,125 | 16,799 | 75.93% |
| 69 | Nappanee | 7,040 | 5,340 | 75.85% |
| 70 | Carmel | 100,501 | 76,107 | 75.73% |
| 71 | Mishawaka | 50,907 | 38,511 | 75.65% |
| 72 | Bloomington | 78,791 | 59,518 | 75.54% |
| 73 | Evansville | 116,441 | 87,955 | 75.54% |
| 74 | Warsaw | 16,592 | 12,526 | 75.49% |
| 75 | Greenwood | 64,237 | 48,457 | 75.43% |
| 76 | Marion | 27,384 | 20,501 | 74.86% |
| 77 | Crown Point | 34,042 | 25,388 | 74.58% |
| 78 | Washington | 12,192 | 9,085 | 74.52% |
| 79 | Jeffersonville | 50,176 | 37,046 | 73.83% |
| 80 | Cumberland | 6,154 | 4,529 | 73.59% |
| 81 | Anderson | 54,930 | 39,777 | 72.41% |
| 82 | Plainfield | 35,783 | 25,874 | 72.31% |
| 83 | Columbus | 51,104 | 36,595 | 71.61% |
| 84 | Lafayette | 70,650 | 50,403 | 71.34% |
| 85 | Munster | 23,733 | 16,837 | 70.94% |
| 86 | Clarksville | 22,121 | 15,663 | 70.81% |
| 87 | Schererville | 29,627 | 20,615 | 69.58% |
| 88 | Avon | 22,683 | 15,670 | 69.08% |
| 89 | Plymouth | 10,506 | 7,149 | 68.05% |
| 90 | Highland | 23,749 | 15,945 | 67.14% |
| 91 | Portage | 37,951 | 25,336 | 66.76% |
| 92 | Seymour | 21,536 | 14,345 | 66.61% |
| 93 | West Lafayette | 44,802 | 29,759 | 66.42% |
| 94 | Hobart | 29,646 | 19,445 | 65.59% |
| 95 | Westville | 5,291 | 3,468 | 65.55% |
| 96 | Frankfort | 15,536 | 10,078 | 64.87% |
| 97 | Fort Wayne | 266,235 | 169,757 | 63.76% |
| 98 | Griffith | 16,228 | 10,175 | 62.7% |
| 99 | Huntingburg | 6,504 | 4,004 | 61.56% |
| 100 | Logansport | 17,766 | 10,871 | 61.19% |