
Whitest cities in Iowa research summary. We analyzed Iowa’s most recent Census data to determine the whitest cities in Iowa based on the percentage of White residents. Here are the results of our analysis:
-
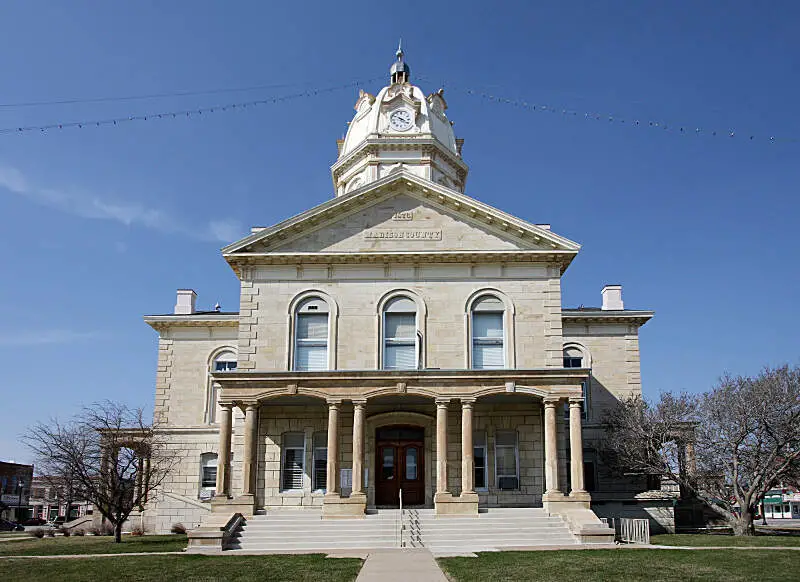
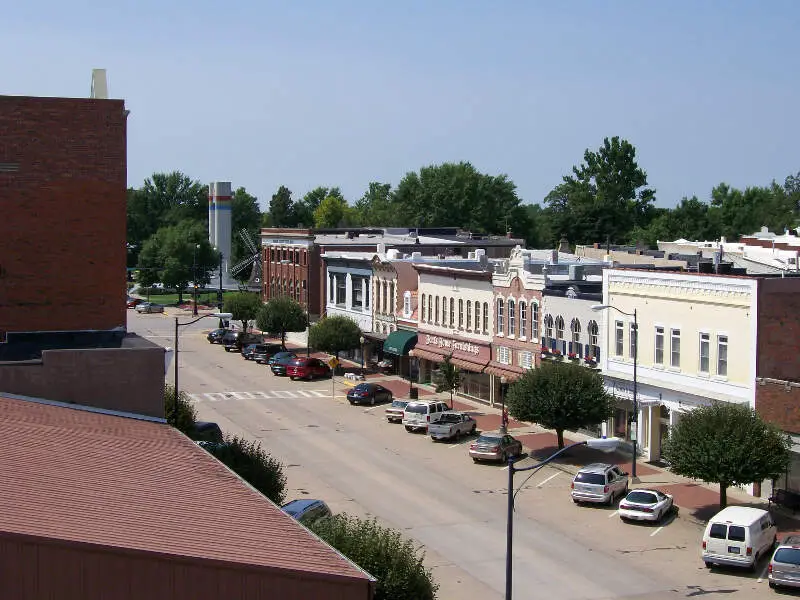
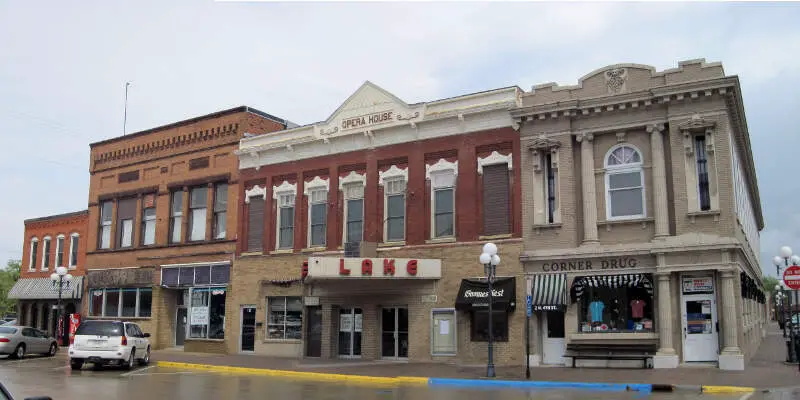
The whitest city in Iowa is Winterset based on the most recent Census data.
-
Winterset is 95.93% White.
-
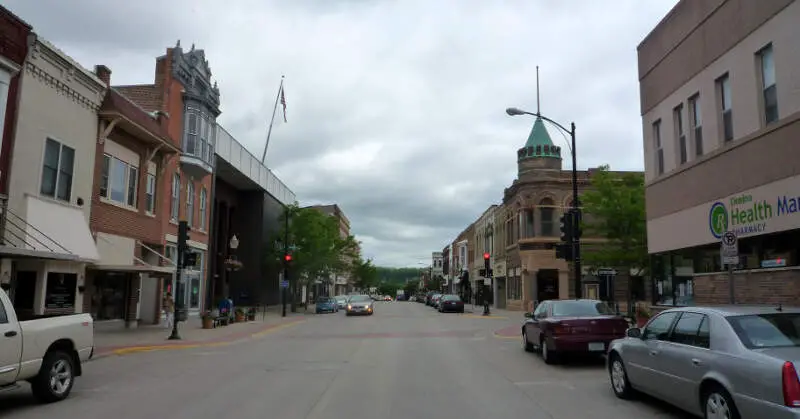
The least White city in Iowa is Storm Lake.
-
Storm Lake is 34.02% White.
-
Iowa is 83.1% White.
-
Iowa is the 6th Whitest state in the United States.
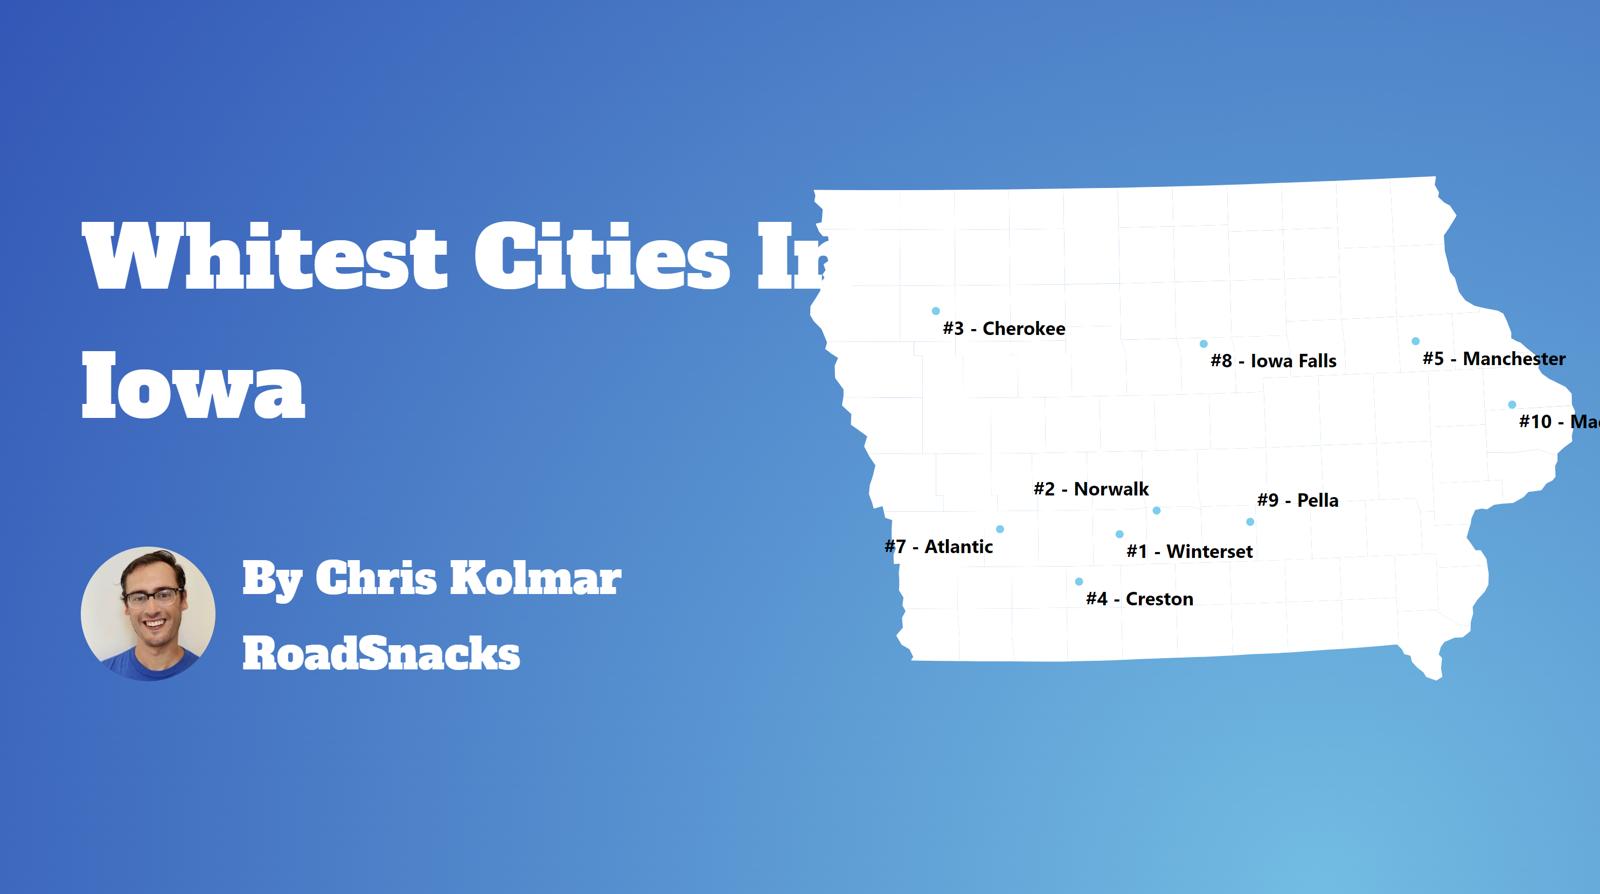
Table Of Contents: Top Ten | Methodology | Summary | Table
Today, we are looking at the whitest places in Iowa. We won’t measure the number of Whole Foods or Pottery Barns per capita. Instead, we’ll focus on the Census data’s report of race by place in Iowa. In particular, we ranked each place in Iowa by the percentage of white people.
So where are the whitest cities you can live in Iowa?
After analyzing cities with populations greater than 5,000, we came up with this list as the whitest cities in Iowa for 2025.
Here are the 10 whites places in Iowa for 2025:
What is the whitest city in Iowa for 2025? According to the most recent census data Winterset ranks as the whitest. If you’re wondering, Storm Lake is the least white city of all those we measured.
Read on below to see where your hometown ranked and why. Or check out the whitest states in America and the most diverse states in America.
For more Iowa reading, check out:
The 10 Whitest Cities In Iowa For 2025
/10
Population: 5,384
% White: 95.93%
More on Winterset: Data

/10
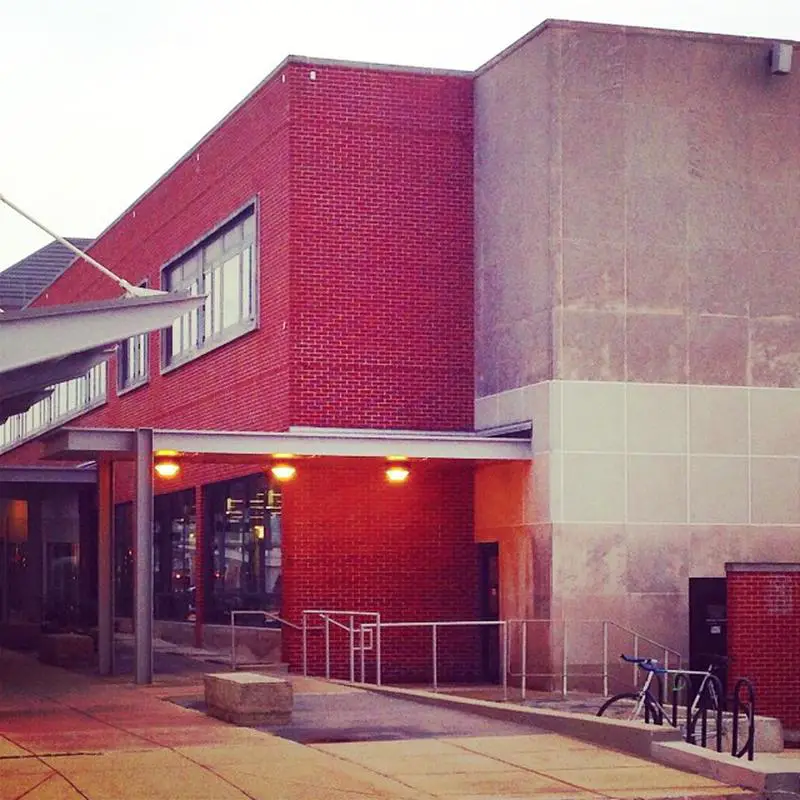
Population: 13,610
% White: 94.88%
More on Norwalk: Data

/10
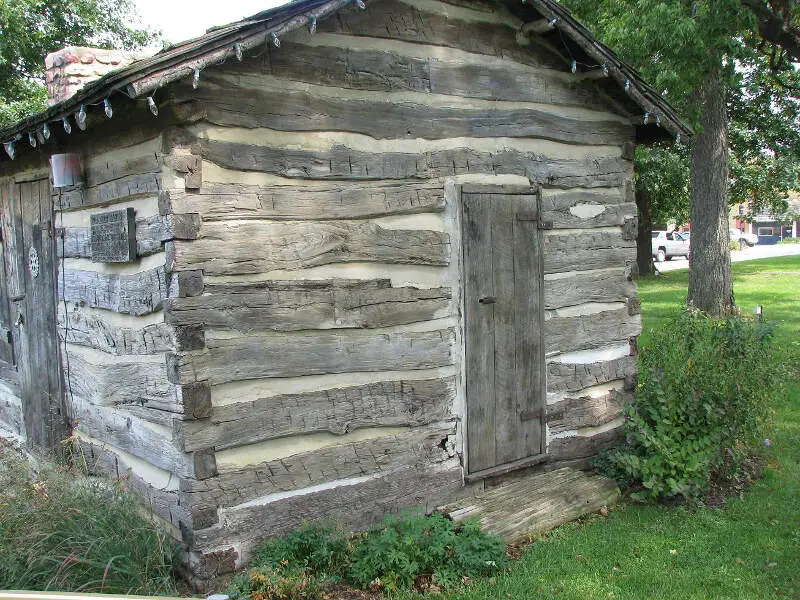
Population: 6,773
% White: 94.6%
More on Atlantic: Data

/10
Population: 6,105
% White: 93.45%
More on Maquoketa: Data

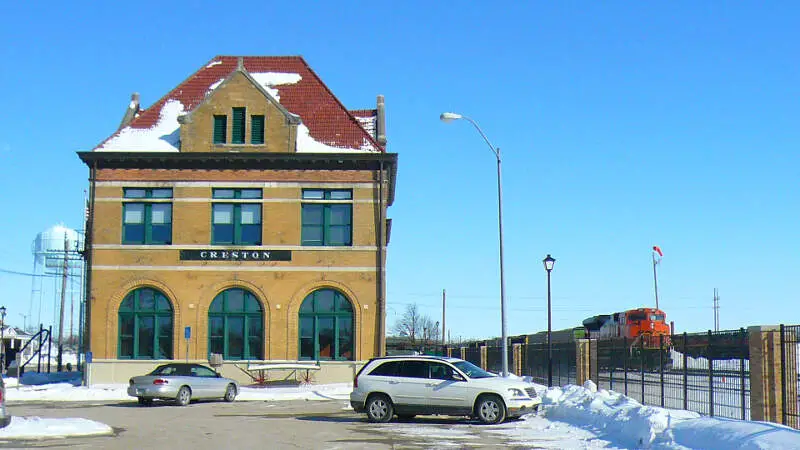
/10
Population: 7,466
% White: 93.42%
More on Creston: Data

/10
Population: 7,493
% White: 93.25%
More on Knoxville: Data
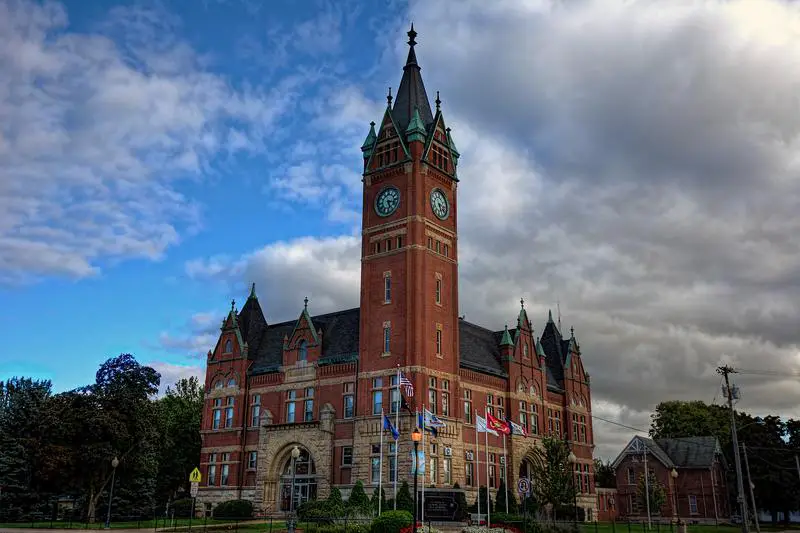
/10
Population: 5,144
% White: 93.08%
More on Manchester: Data

/10
Population: 7,597
% White: 93.04%
More on Decorah: Data

/10
Population: 10,624
% White: 92.97%
More on Pella: Data

/10
Population: 7,603
% White: 92.91%
More on Clear Lake: Data
Methodology: How we determined the whitest places in Iowa for 2025
To rank the whitest places in Iowa, we used Saturday Night Science to look at Census demographic data.
We had to look at the number of white people living in each city in Iowa on a per capita basis. In other words, the percentage of white people living in each city in Iowa.
We looked at table B03002: Hispanic OR LATINO ORIGIN BY RACE. Here are the category names as defined by the Census:
- Hispanic or Latino
- White alone*
- Black or African American alone*
- American Indian and Alaska Native alone*
- Asian alone*
- Native Hawaiian and Other Pacific Islander alone*
- Some other race alone*
- Two or more races*
Our particular column of interest here was the number of people who identified as White alone.
We limited our analysis to town with a population greater than 5,000 people. That left us with 76 cities.
We then calculated the percentage of residents that are White. The percentages ranked from 95.9% to 34.0%.
Finally, we ranked each city based on the percentage of White population, with a higher score being more White than a lower score. Winterset took the distinction of being the most White, while Storm Lake was the least White city.
We updated this article for 2025. This report represents our tenth time ranking the whitest cities in Iowa.
Read on for more information on how the cities in Iowa ranked by population of White residents or, for a more general take on diversity in America, head over to our ranking of the most diverse cities in America.
Summary: White Populations Across Iowa
We measured the locations with the highest percentage of white people in Iowa. According to the most recent data, this list provides accurate information on the whitest places in Iowa.
The most White cities in Iowa are Winterset, Norwalk, Atlantic, Maquoketa, Creston, Knoxville, Manchester, Decorah, Pella, and Clear Lake.
If you’re curious enough, here are the least White places in Iowa:
- Storm Lake
- Denison
- Marshalltown
For more Iowa reading, check out:
White Population By City In Iowa
| Rank | City | Population | White Population | % White |
|---|---|---|---|---|
| 1 | Winterset | 5,384 | 5,165 | 95.93% |
| 2 | Norwalk | 13,610 | 12,913 | 94.88% |
| 3 | Atlantic | 6,773 | 6,407 | 94.6% |
| 4 | Maquoketa | 6,105 | 5,705 | 93.45% |
| 5 | Creston | 7,466 | 6,975 | 93.42% |
| 6 | Knoxville | 7,493 | 6,987 | 93.25% |
| 7 | Manchester | 5,144 | 4,788 | 93.08% |
| 8 | Decorah | 7,597 | 7,068 | 93.04% |
| 9 | Pella | 10,624 | 9,877 | 92.97% |
| 10 | Clear Lake | 7,603 | 7,064 | 92.91% |
| 11 | Independence | 6,149 | 5,712 | 92.89% |
| 12 | Centerville | 5,377 | 4,958 | 92.21% |
| 13 | Carroll | 10,261 | 9,444 | 92.04% |
| 14 | Oskaloosa | 11,492 | 10,548 | 91.79% |
| 15 | Indianola | 15,918 | 14,593 | 91.68% |
| 16 | Orange City | 6,312 | 5,766 | 91.35% |
| 17 | Boone | 12,445 | 11,276 | 90.61% |
| 18 | Glenwood | 5,118 | 4,630 | 90.47% |
| 19 | Spencer | 11,393 | 10,296 | 90.37% |
| 20 | Cedar Falls | 40,662 | 36,575 | 89.95% |
| 21 | Waverly | 10,446 | 9,395 | 89.94% |
| 22 | Iowa Falls | 5,062 | 4,547 | 89.83% |
| 23 | Cherokee | 5,157 | 4,626 | 89.7% |
| 24 | Red Oak | 5,542 | 4,967 | 89.62% |
| 25 | Oelwein | 5,878 | 5,267 | 89.61% |
| 26 | Keokuk | 9,748 | 8,702 | 89.27% |
| 27 | Marion | 41,690 | 36,932 | 88.59% |
| 28 | Newton | 15,696 | 13,901 | 88.56% |
| 29 | Eldridge | 6,743 | 5,964 | 88.45% |
| 30 | Ankeny | 70,542 | 62,046 | 87.96% |
| 31 | Algona | 5,414 | 4,758 | 87.88% |
| 32 | Anamosa | 5,553 | 4,862 | 87.56% |
| 33 | Clinton | 24,425 | 21,198 | 86.79% |
| 34 | Grinnell | 9,527 | 8,250 | 86.6% |
| 35 | Mason City | 27,135 | 23,379 | 86.16% |
| 36 | Charles City | 7,321 | 6,294 | 85.97% |
| 37 | Fort Madison | 10,221 | 8,747 | 85.58% |
| 38 | Dubuque | 59,271 | 50,620 | 85.4% |
| 39 | Grimes | 15,810 | 13,434 | 84.97% |
| 40 | Altoona | 20,592 | 17,389 | 84.45% |
| 41 | Clarinda | 5,366 | 4,511 | 84.07% |
| 42 | Washington | 7,314 | 6,143 | 83.99% |
| 43 | Le Mars | 10,597 | 8,830 | 83.33% |
| 44 | Nevada | 6,952 | 5,791 | 83.3% |
| 45 | Council Bluffs | 62,564 | 51,708 | 82.65% |
| 46 | Burlington | 23,800 | 19,620 | 82.44% |
| 47 | Pleasant Hill | 10,796 | 8,859 | 82.06% |
| 48 | Bettendorf | 39,297 | 32,108 | 81.71% |
| 49 | Estherville | 5,865 | 4,789 | 81.65% |
| 50 | Hiawatha | 7,178 | 5,807 | 80.9% |
| 51 | Fort Dodge | 24,788 | 20,051 | 80.89% |
| 52 | Urbandale | 46,026 | 36,742 | 79.83% |
| 53 | Sioux Center | 8,335 | 6,640 | 79.66% |
| 54 | North Liberty | 20,782 | 16,537 | 79.57% |
| 55 | Johnston | 24,196 | 19,190 | 79.31% |
| 56 | Mount Pleasant | 9,093 | 7,187 | 79.04% |
| 57 | West Des Moines | 69,893 | 54,694 | 78.25% |
| 58 | Sheldon | 5,386 | 4,214 | 78.24% |
| 59 | Ames | 66,112 | 51,321 | 77.63% |
| 60 | Cedar Rapids | 136,859 | 106,028 | 77.47% |
| 61 | Webster City | 7,769 | 5,990 | 77.1% |
| 62 | Waukee | 26,974 | 20,794 | 77.09% |
| 63 | Clive | 18,776 | 14,277 | 76.04% |
| 64 | Fairfield | 9,438 | 7,072 | 74.93% |
| 65 | Iowa City | 75,264 | 54,459 | 72.36% |
| 66 | Muscatine | 23,567 | 16,965 | 71.99% |
| 67 | Davenport | 101,083 | 72,502 | 71.73% |
| 68 | Ottumwa | 25,352 | 17,998 | 70.99% |
| 69 | Waterloo | 66,947 | 44,954 | 67.15% |
| 70 | Perry | 7,928 | 5,230 | 65.97% |
| 71 | Coralville | 22,846 | 14,639 | 64.08% |
| 72 | Sioux City | 85,651 | 54,188 | 63.27% |
| 73 | Des Moines | 212,464 | 131,082 | 61.7% |
| 74 | Marshalltown | 27,491 | 15,384 | 55.96% |
| 75 | Denison | 8,247 | 3,595 | 43.59% |
| 76 | Storm Lake | 11,275 | 3,836 | 34.02% |