
Whitest cities in Minnesota research summary. We analyzed Minnesota’s most recent Census data to determine the whitest cities in Minnesota based on the percentage of White residents. Here are the results of our analysis:
-
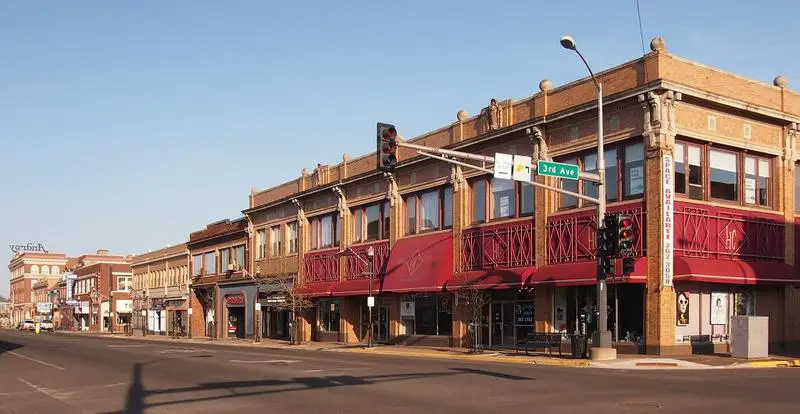
The whitest city in Minnesota is New Prague based on the most recent Census data.
-
New Prague is 95.99% White.
-
The least White city in Minnesota is Brooklyn Center.
-
Brooklyn Center is 30.6% White.
-
Minnesota is 75.9% White.
-
Minnesota is the 14th Whitest state in the United States.
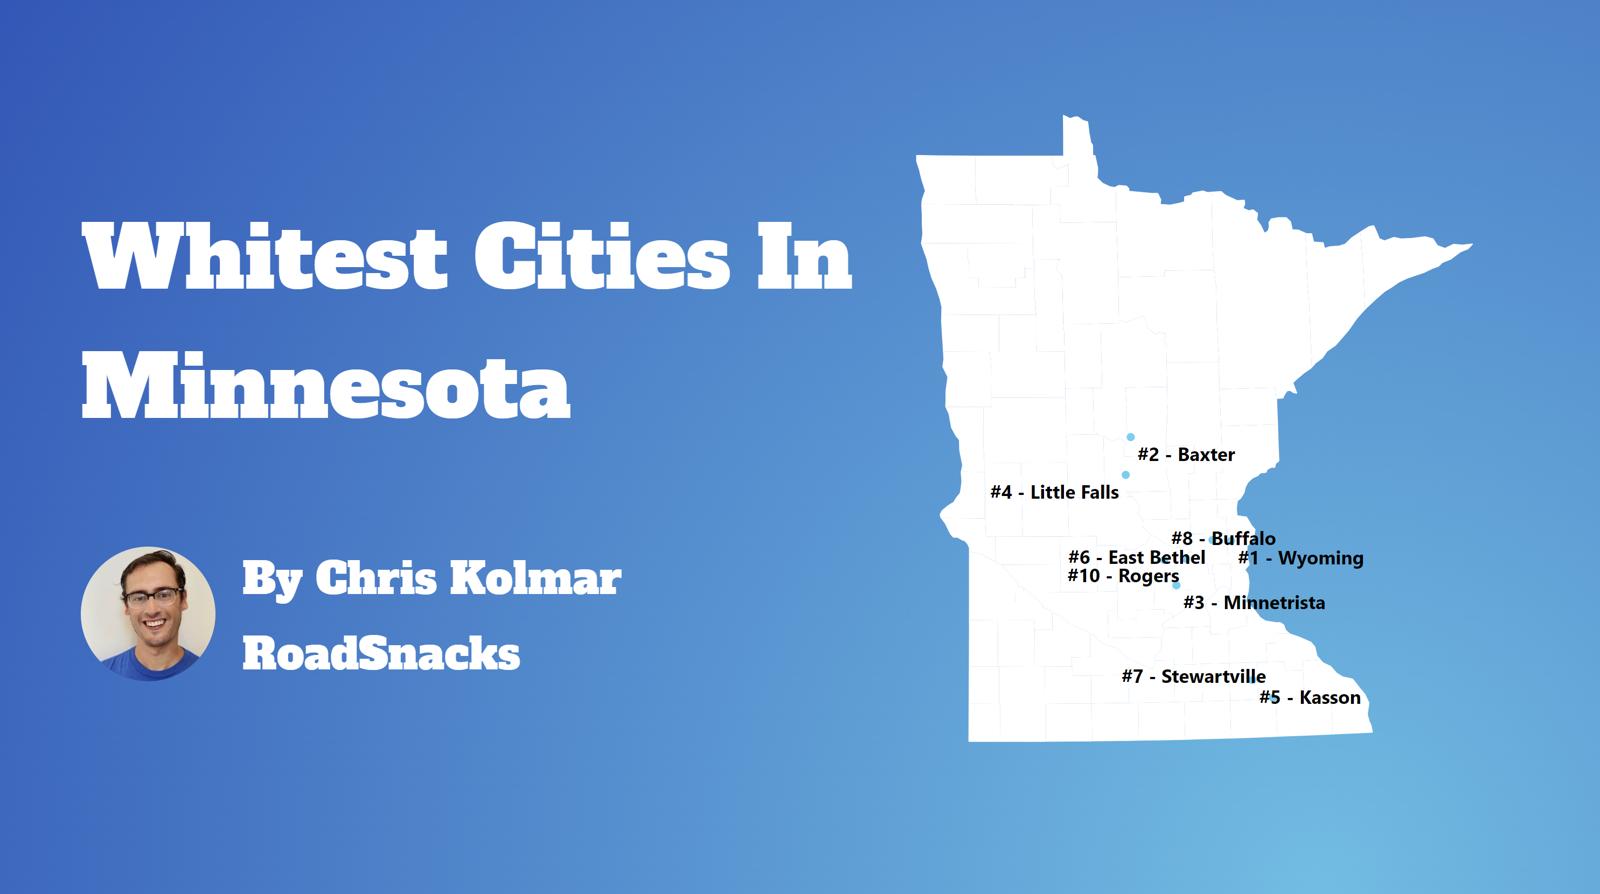
Table Of Contents: Top Ten | Methodology | Summary | Table
Today, we are looking at the whitest places in Minnesota. We won’t measure the number of Whole Foods or Pottery Barns per capita. Instead, we’ll focus on the Census data’s report of race by place in Minnesota. In particular, we ranked each place in Minnesota by the percentage of white people.
So where are the whitest cities you can live in Minnesota?
After analyzing cities with populations greater than 5,000, we came up with this list as the whitest cities in Minnesota for 2026.
Here are the 10 whites places in Minnesota for 2026:
What is the whitest city in Minnesota for 2026? According to the most recent census data New Prague ranks as the whitest. If you’re wondering, Brooklyn Center is the least white city of all those we measured.
Read on below to see where your hometown ranked and why. Or check out the whitest states in America and the most diverse states in America.
For more Minnesota reading, check out:
- Most Dangerous Cities In Minnesota
- Best Places To Raise A Family In Minnesota
- Worst Places To Live In Minnesota
The 10 Whitest Cities In Minnesota For 2026

/10
Population: 8,237
% White: 95.99%
More on New Prague: Data | Crime | Cost Of Living | Movers

/10
Population: 6,942
% White: 95.26%
More on Delano: Data | Cost Of Living | Movers

/10
Population: 8,966
% White: 94.88%
More on Baxter: Data | Crime | Cost Of Living | Movers

/10
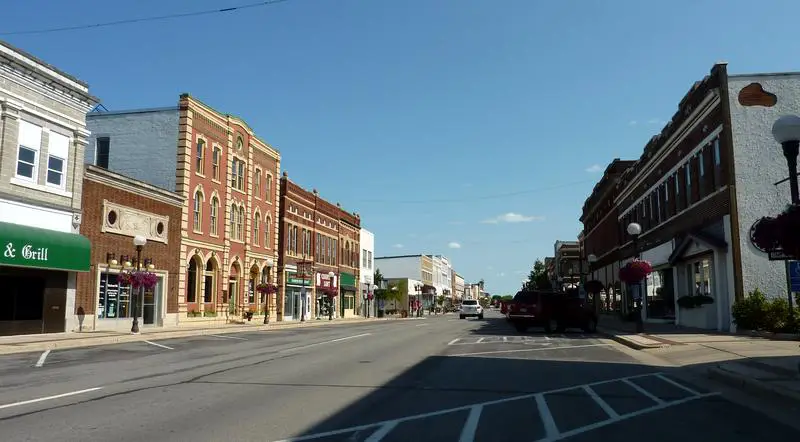
Population: 14,056
% White: 93.55%
More on New Ulm: Data | Crime | Cost Of Living | Movers

/10
Population: 16,057
% White: 93.3%
More on Hibbing: Data | Crime | Cost Of Living | Movers

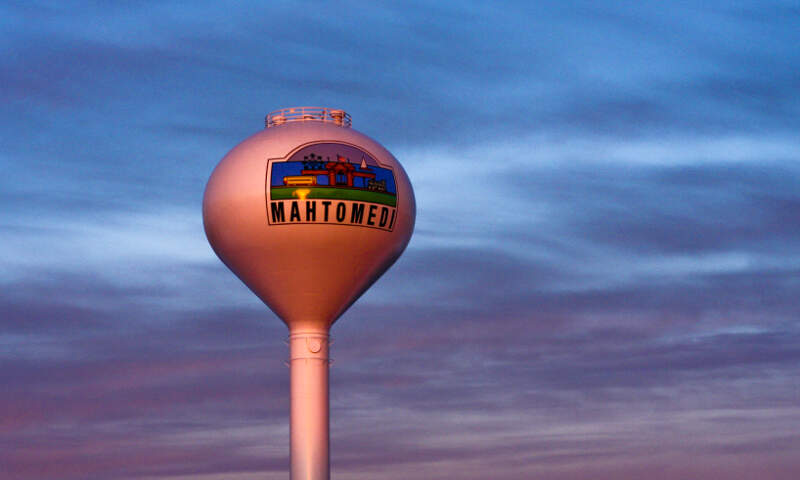
/10
Population: 8,133
% White: 92.87%
More on Mahtomedi: Data | Cost Of Living | Movers
/10
Population: 5,034
% White: 92.55%
More on Lake City: Data | Crime | Cost Of Living | Movers

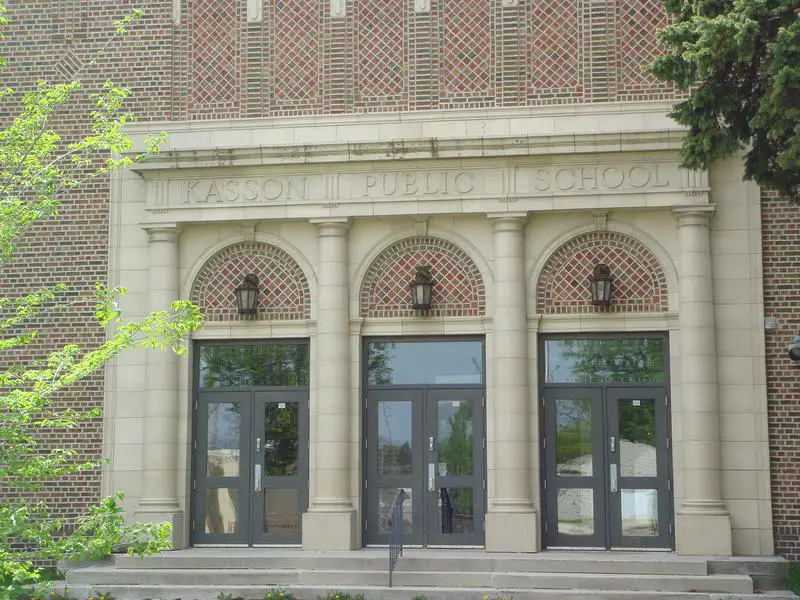
/10
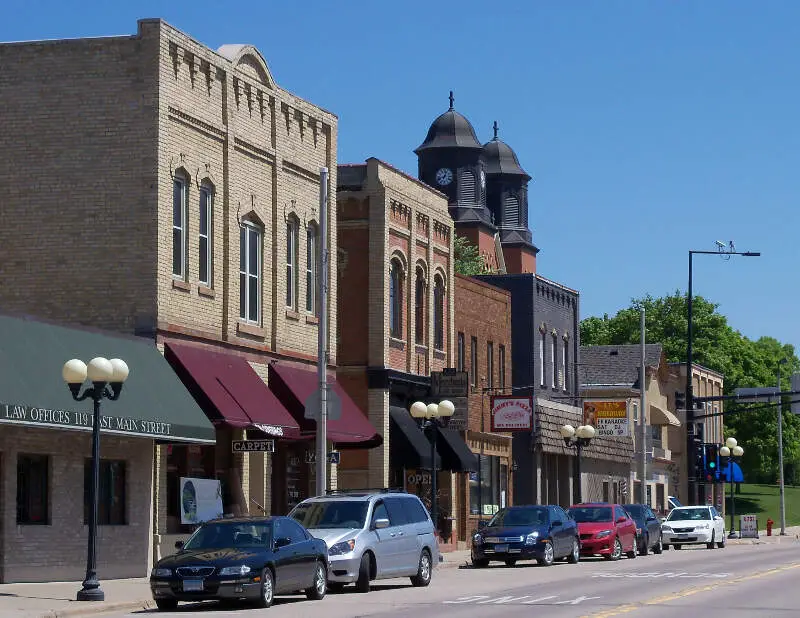
Population: 7,050
% White: 92.41%
More on Kasson: Data | Crime | Cost Of Living | Movers

/10
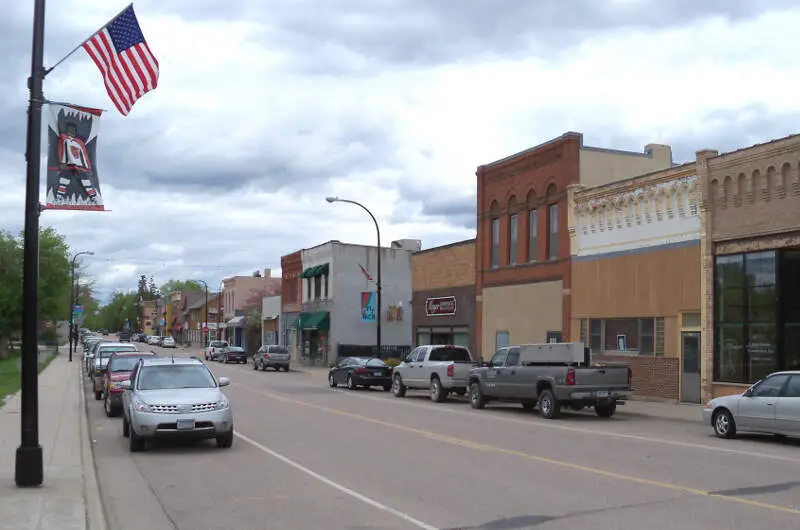
Population: 9,121
% White: 92.23%
More on Little Falls: Data | Crime | Cost Of Living | Movers

/10
Population: 8,708
% White: 92.03%
More on Minnetrista: Data | Crime | Cost Of Living | Movers
Methodology: How we determined the whitest places in Minnesota for 2026
To rank the whitest places in Minnesota, we used Saturday Night Science to look at Census demographic data.
We had to look at the number of white people living in each city in Minnesota on a per capita basis. In other words, the percentage of white people living in each city in Minnesota.
We looked at table B03002: Hispanic OR LATINO ORIGIN BY RACE. Here are the category names as defined by the Census:
- Hispanic or Latino
- White alone*
- Black or African American alone*
- American Indian and Alaska Native alone*
- Asian alone*
- Native Hawaiian and Other Pacific Islander alone*
- Some other race alone*
- Two or more races*
Our particular column of interest here was the number of people who identified as White alone.
We limited our analysis to town with a population greater than 5,000 people. That left us with 139 cities.
We then calculated the percentage of residents that are White. The percentages ranked from 96.0% to 30.6%.
Finally, we ranked each city based on the percentage of White population, with a higher score being more White than a lower score. New Prague took the distinction of being the most White, while Brooklyn Center was the least White city.
We updated this article for 2026. This report represents our eleventh time ranking the whitest cities in Minnesota.
Read on for more information on how the cities in Minnesota ranked by population of White residents or, for a more general take on diversity in America, head over to our ranking of the most diverse cities in America.
Summary: White Populations Across Minnesota
We measured the locations with the highest percentage of white people in Minnesota. According to the most recent data, this list provides accurate information on the whitest places in Minnesota.
The most White cities in Minnesota are New Prague, Delano, Baxter, New Ulm, Hibbing, Mahtomedi, Lake City, Kasson, Little Falls, and Minnetrista.
If you’re curious enough, here are the least White places in Minnesota:
- Brooklyn Center
- Brooklyn Park
- Worthington
For more Minnesota reading, check out:
White Population By City In Minnesota
| Rank | City | Population | White Population | % White |
|---|---|---|---|---|
| 1 | New Prague | 8,237 | 7,907 | 95.99% |
| 2 | Delano | 6,942 | 6,613 | 95.26% |
| 3 | Baxter | 8,966 | 8,507 | 94.88% |
| 4 | New Ulm | 14,056 | 13,150 | 93.55% |
| 5 | Hibbing | 16,057 | 14,981 | 93.3% |
| 6 | Mahtomedi | 8,133 | 7,553 | 92.87% |
| 7 | Lake City | 5,034 | 4,659 | 92.55% |
| 8 | Kasson | 7,050 | 6,515 | 92.41% |
| 9 | Little Falls | 9,121 | 8,412 | 92.23% |
| 10 | Minnetrista | 8,708 | 8,014 | 92.03% |
| 11 | Buffalo | 16,499 | 15,130 | 91.7% |
| 12 | Brainerd | 14,468 | 13,236 | 91.48% |
| 13 | Wyoming | 8,087 | 7,395 | 91.44% |
| 14 | Stewartville | 6,807 | 6,162 | 90.52% |
| 15 | Fergus Falls | 14,181 | 12,837 | 90.52% |
| 16 | Waconia | 13,434 | 12,106 | 90.11% |
| 17 | North Branch | 11,565 | 10,417 | 90.07% |
| 18 | Hutchinson | 14,680 | 13,216 | 90.03% |
| 19 | Oak Grove | 9,130 | 8,217 | 90.0% |
| 20 | East Bethel | 12,115 | 10,884 | 89.84% |
| 21 | Alexandria | 14,735 | 13,203 | 89.6% |
| 22 | Ham Lake | 16,702 | 14,933 | 89.41% |
| 23 | International Falls | 5,642 | 5,023 | 89.03% |
| 24 | Grand Rapids | 11,207 | 9,961 | 88.88% |
| 25 | Virginia | 8,332 | 7,385 | 88.63% |
| 26 | Shorewood | 7,647 | 6,776 | 88.61% |
| 27 | Sauk Rapids | 13,852 | 12,249 | 88.43% |
| 28 | Hermantown | 10,218 | 9,012 | 88.2% |
| 29 | Detroit Lakes | 10,025 | 8,826 | 88.04% |
| 30 | Cambridge | 10,307 | 9,072 | 88.02% |
| 31 | Albertville | 8,207 | 7,196 | 87.68% |
| 32 | Victoria | 11,295 | 9,883 | 87.5% |
| 33 | Litchfield | 6,576 | 5,743 | 87.33% |
| 34 | St. Francis | 8,372 | 7,298 | 87.17% |
| 35 | Redwood Falls | 5,068 | 4,398 | 86.78% |
| 36 | Lake Elmo | 13,140 | 11,401 | 86.77% |
| 37 | Stillwater | 19,355 | 16,785 | 86.72% |
| 38 | Duluth | 87,093 | 75,451 | 86.63% |
| 39 | Winona | 26,009 | 22,498 | 86.5% |
| 40 | Jordan | 6,771 | 5,851 | 86.41% |
| 41 | Belle Plaine | 7,423 | 6,413 | 86.39% |
| 42 | Hugo | 16,340 | 14,058 | 86.03% |
| 43 | Forest Lake | 20,729 | 17,820 | 85.97% |
| 44 | Fairmont | 10,296 | 8,830 | 85.76% |
| 45 | Andover | 33,035 | 28,303 | 85.68% |
| 46 | Mound | 9,107 | 7,802 | 85.67% |
| 47 | St. Michael | 20,010 | 17,109 | 85.5% |
| 48 | Thief River Falls | 8,823 | 7,505 | 85.06% |
| 49 | Sartell | 19,758 | 16,806 | 85.06% |
| 50 | North Mankato | 14,211 | 12,065 | 84.9% |
| 51 | Hastings | 22,117 | 18,758 | 84.81% |
| 52 | Lino Lakes | 22,113 | 18,727 | 84.69% |
| 53 | Waseca | 9,164 | 7,746 | 84.53% |
| 54 | Rogers | 13,685 | 11,552 | 84.41% |
| 55 | Cloquet | 12,537 | 10,572 | 84.33% |
| 56 | Red Wing | 16,758 | 14,035 | 83.75% |
| 57 | Orono | 8,195 | 6,861 | 83.72% |
| 58 | Chanhassen | 26,006 | 21,758 | 83.67% |
| 59 | Elk River | 26,793 | 22,412 | 83.65% |
| 60 | Monticello | 14,858 | 12,403 | 83.48% |
| 61 | Big Lake | 12,367 | 10,323 | 83.47% |
| 62 | Rosemount | 27,562 | 22,655 | 82.2% |
| 63 | Owatonna | 26,498 | 21,749 | 82.08% |
| 64 | Ramsey | 28,421 | 23,257 | 81.83% |
| 65 | Arden Hills | 9,658 | 7,846 | 81.24% |
| 66 | White Bear Lake | 23,908 | 19,413 | 81.2% |
| 67 | Farmington | 23,902 | 19,408 | 81.2% |
| 68 | Mankato | 45,473 | 36,842 | 81.02% |
| 69 | Minnetonka | 53,064 | 42,932 | 80.91% |
| 70 | Crookston | 7,344 | 5,937 | 80.84% |
| 71 | Moorhead | 45,036 | 36,221 | 80.43% |
| 72 | Otsego | 22,245 | 17,887 | 80.41% |
| 73 | Edina | 53,262 | 42,658 | 80.09% |
| 74 | Montevideo | 5,315 | 4,251 | 79.98% |
| 75 | St. Peter | 12,185 | 9,685 | 79.48% |
| 76 | Prior Lake | 28,016 | 22,180 | 79.17% |
| 77 | Mendota Heights | 11,612 | 9,173 | 79.0% |
| 78 | Chaska | 28,706 | 22,546 | 78.54% |
| 79 | Marshall | 13,896 | 10,871 | 78.23% |
| 80 | St. Louis Park | 49,594 | 38,615 | 77.86% |
| 81 | Glencoe | 5,695 | 4,420 | 77.61% |
| 82 | Corcoran | 7,302 | 5,653 | 77.42% |
| 83 | East Grand Forks | 9,028 | 6,942 | 76.89% |
| 84 | St. Joseph | 7,021 | 5,396 | 76.86% |
| 85 | Golden Valley | 21,725 | 16,668 | 76.72% |
| 86 | Maple Grove | 71,173 | 54,575 | 76.68% |
| 87 | Northfield | 20,742 | 15,890 | 76.61% |
| 88 | St. Anthony | 9,671 | 7,371 | 76.22% |
| 89 | Lakeville | 74,354 | 56,663 | 76.21% |
| 90 | Albert Lea | 18,330 | 13,940 | 76.05% |
| 91 | Shoreview | 26,714 | 20,286 | 75.94% |
| 92 | Morris | 5,128 | 3,888 | 75.82% |
| 93 | Champlin | 23,294 | 17,495 | 75.11% |
| 94 | Anoka | 17,970 | 13,468 | 74.95% |
| 95 | Cottage Grove | 40,992 | 30,150 | 73.55% |
| 96 | Inver Grove Heights | 35,906 | 26,404 | 73.54% |
| 97 | Plymouth | 79,220 | 57,940 | 73.14% |
| 98 | Savage | 32,889 | 23,745 | 72.2% |
| 99 | St. Paul Park | 5,457 | 3,891 | 71.3% |
| 100 | Falcon Heights | 5,085 | 3,616 | 71.11% |