
Whitest cities in Mississippi research summary. We analyzed Mississippi’s most recent Census data to determine the whitest cities in Mississippi based on the percentage of White residents. Here are the results of our analysis:
-
The whitest city in Mississippi is Long Beach based on the most recent Census data.
-
Long Beach is 79.06% White.
-
The least White city in Mississippi is Yazoo City.
-
Yazoo City is 9.69% White.
-
Mississippi is 55.2% White.
-
Mississippi is the 39th Whitest state in the United States.
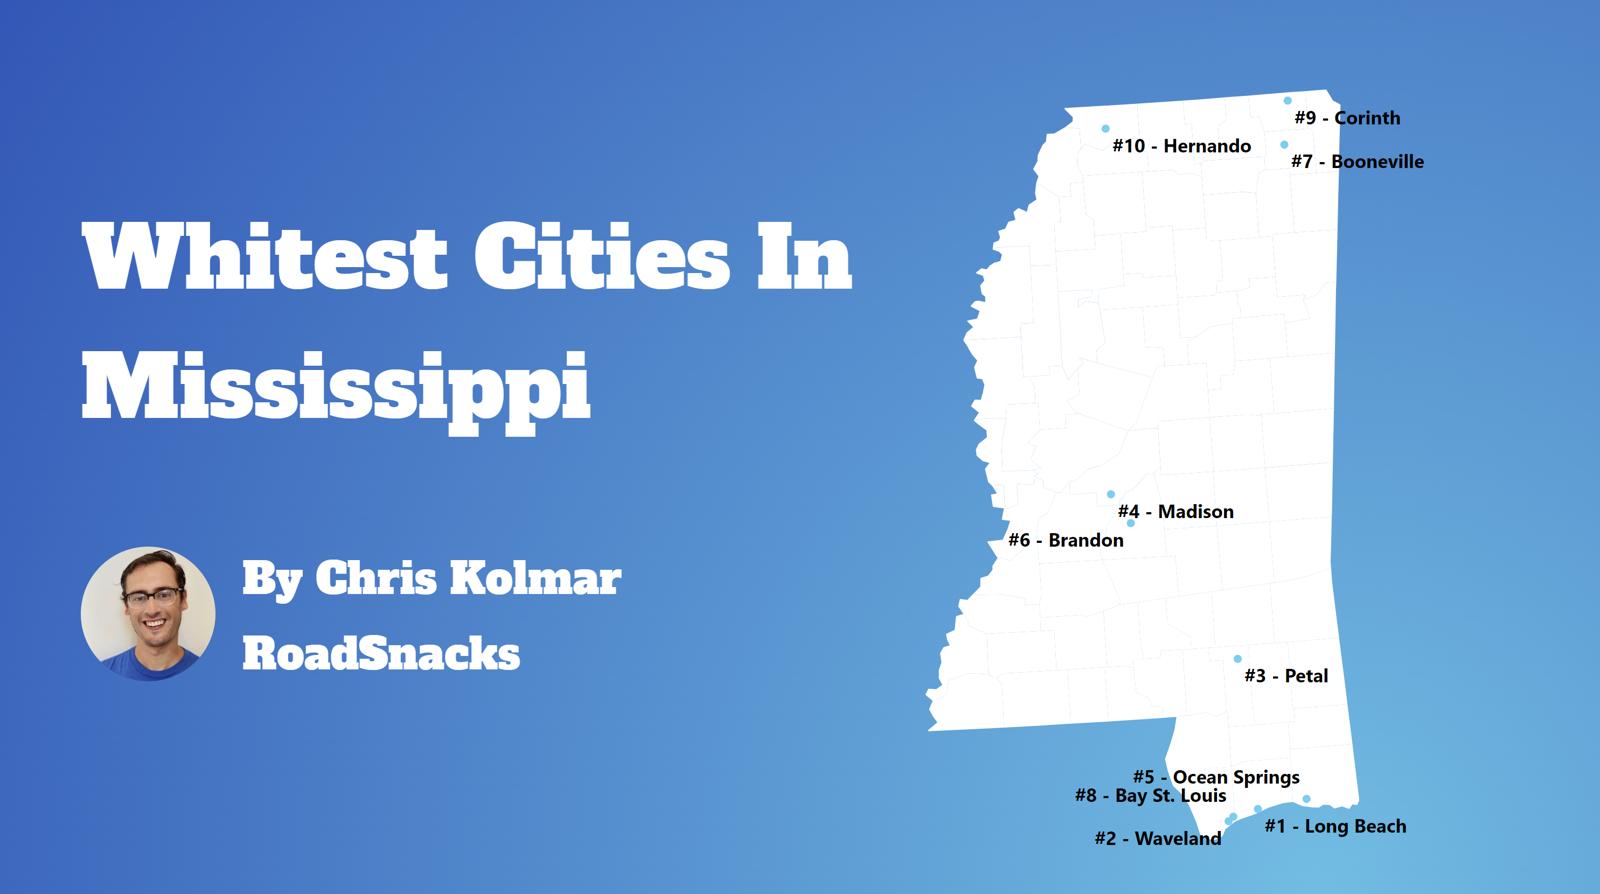
Table Of Contents: Top Ten | Methodology | Summary | Table
Today, we are looking at the whitest places in Mississippi. We won’t measure the number of Whole Foods or Pottery Barns per capita. Instead, we’ll focus on the Census data’s report of race by place in Mississippi. In particular, we ranked each place in Mississippi by the percentage of white people.
So where are the whitest cities you can live in Mississippi?
After analyzing cities with populations greater than 5,000, we came up with this list as the whitest cities in Mississippi for 2026.
Here are the 10 whites places in Mississippi for 2026:
What is the whitest city in Mississippi for 2026? According to the most recent census data Long Beach ranks as the whitest. If you’re wondering, Yazoo City is the least white city of all those we measured.
Read on below to see where your hometown ranked and why. Or check out the whitest states in America and the most diverse states in America.
For more Mississippi reading, check out:
- Safest Places In Mississippi
- Most Dangerous Cities In Mississippi
- Best Places To Raise A Family In Mississippi
The 10 Whitest Cities In Mississippi For 2026

/10
Population: 17,009
% White: 79.06%
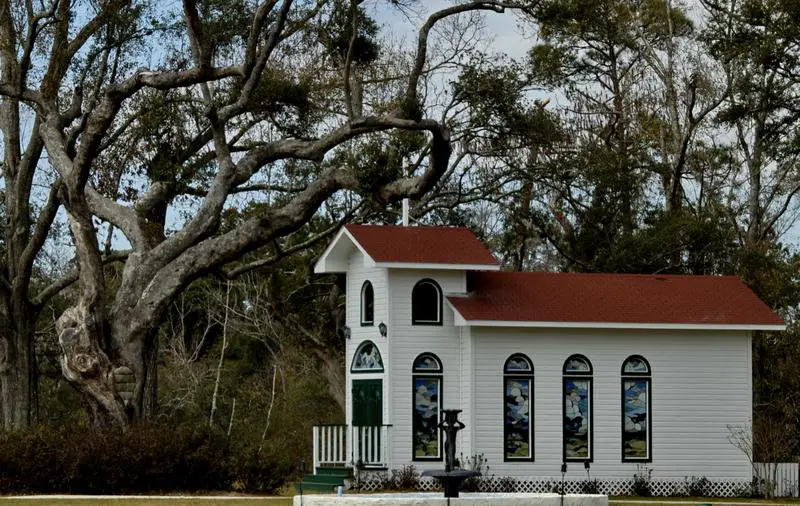
More on Long Beach: Data | Crime | Cost Of Living | Movers

/10
Population: 7,062
% White: 77.7%
More on Waveland: Data | Crime | Cost Of Living | Movers

/10
Population: 27,946
% White: 77.27%
More on Madison: Data | Crime | Cost Of Living | Movers

/10
Population: 18,646
% White: 76.57%
More on Ocean Springs: Data | Crime | Cost Of Living | Movers

/10
Population: 10,188
% White: 75.59%
More on Bay St. Louis: Data | Crime | Cost Of Living | Movers

/10
Population: 17,949
% White: 73.95%
More on Hernando: Data | Crime | Cost Of Living | Movers

/10
Population: 11,294
% White: 72.76%
More on Petal: Data | Crime | Cost Of Living | Movers

/10
Population: 10,587
% White: 70.99%
More on Flowood: Data | Crime | Cost Of Living | Movers

/10
Population: 7,346
% White: 70.24%
More on Richland: Data | Crime | Cost Of Living | Movers

/10
Population: 9,246
% White: 70.17%
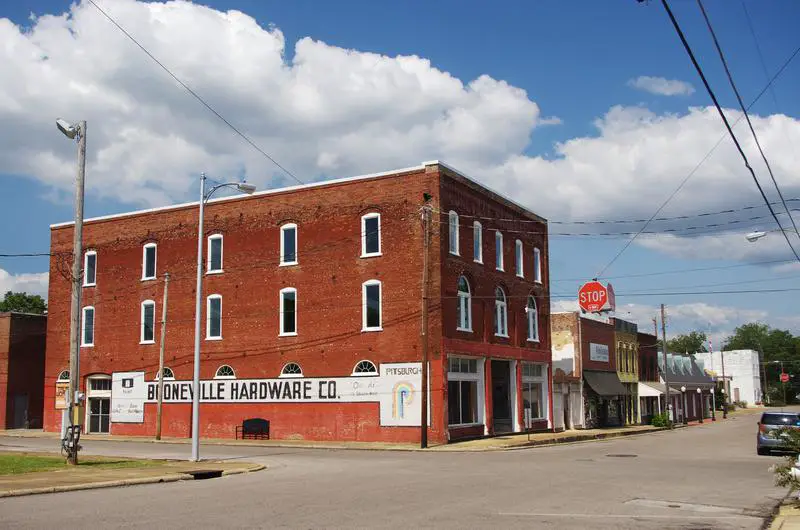
More on Booneville: Data | Crime | Cost Of Living | Movers
Methodology: How we determined the whitest places in Mississippi for 2026
To rank the whitest places in Mississippi, we used Saturday Night Science to look at Census demographic data.
We had to look at the number of white people living in each city in Mississippi on a per capita basis. In other words, the percentage of white people living in each city in Mississippi.
We looked at table B03002: Hispanic OR LATINO ORIGIN BY RACE. Here are the category names as defined by the Census:
- Hispanic or Latino
- White alone*
- Black or African American alone*
- American Indian and Alaska Native alone*
- Asian alone*
- Native Hawaiian and Other Pacific Islander alone*
- Some other race alone*
- Two or more races*
Our particular column of interest here was the number of people who identified as White alone.
We limited our analysis to town with a population greater than 5,000 people. That left us with 59 cities.
We then calculated the percentage of residents that are White. The percentages ranked from 79.1% to 9.7%.
Finally, we ranked each city based on the percentage of White population, with a higher score being more White than a lower score. Long Beach took the distinction of being the most White, while Yazoo City was the least White city.
We updated this article for 2026. This report represents our eleventh time ranking the whitest cities in Mississippi.
Read on for more information on how the cities in Mississippi ranked by population of White residents or, for a more general take on diversity in America, head over to our ranking of the most diverse cities in America.
Summary: White Populations Across Mississippi
We measured the locations with the highest percentage of white people in Mississippi. According to the most recent data, this list provides accurate information on the whitest places in Mississippi.
The most White cities in Mississippi are Long Beach, Waveland, Madison, Ocean Springs, Bay St. Louis, Hernando, Petal, Flowood, Richland, and Booneville.
If you’re curious enough, here are the least White places in Mississippi:
- Yazoo City
- Jackson
- Clarksdale
For more Mississippi reading, check out:
- Worst Places To Live In Mississippi
- Cheapest Places To Live In Mississippi
- Best Places To Live In Mississippi
White Population By City In Mississippi
| Rank | City | Population | White Population | % White |
|---|---|---|---|---|
| 1 | Long Beach | 17,009 | 13,448 | 79.06% |
| 2 | Waveland | 7,062 | 5,487 | 77.7% |
| 3 | Madison | 27,946 | 21,595 | 77.27% |
| 4 | Ocean Springs | 18,646 | 14,278 | 76.57% |
| 5 | Bay St. Louis | 10,188 | 7,701 | 75.59% |
| 6 | Hernando | 17,949 | 13,274 | 73.95% |
| 7 | Petal | 11,294 | 8,217 | 72.76% |
| 8 | Flowood | 10,587 | 7,516 | 70.99% |
| 9 | Richland | 7,346 | 5,160 | 70.24% |
| 10 | Booneville | 9,246 | 6,488 | 70.17% |
| 11 | Brandon | 25,542 | 17,745 | 69.47% |
| 12 | Corinth | 14,323 | 9,813 | 68.51% |
| 13 | Ripley | 5,377 | 3,523 | 65.52% |
| 14 | Oxford | 26,411 | 17,091 | 64.71% |
| 15 | Amory | 6,500 | 4,164 | 64.06% |
| 16 | D’iberville | 13,203 | 8,032 | 60.83% |
| 17 | New Albany | 7,663 | 4,614 | 60.21% |
| 18 | Columbia | 6,632 | 3,950 | 59.56% |
| 19 | Biloxi | 48,861 | 29,020 | 59.39% |
| 20 | Pearl | 27,737 | 16,072 | 57.94% |
| 21 | Pontotoc | 5,806 | 3,128 | 53.88% |
| 22 | Senatobia | 8,380 | 4,461 | 53.23% |
| 23 | Gautier | 19,046 | 10,121 | 53.14% |
| 24 | Olive Branch | 47,019 | 24,779 | 52.7% |
| 25 | Starkville | 25,721 | 13,552 | 52.69% |
| 26 | Picayune | 11,900 | 6,197 | 52.08% |
| 27 | Tupelo | 37,791 | 19,609 | 51.89% |
| 28 | Southaven | 56,226 | 28,531 | 50.74% |
| 29 | Pascagoula | 21,710 | 10,420 | 48.0% |
| 30 | Clinton | 27,195 | 12,875 | 47.34% |
| 31 | Gulfport | 73,003 | 34,523 | 47.29% |
| 32 | Philadelphia | 6,996 | 2,956 | 42.25% |
| 33 | Batesville | 7,387 | 3,115 | 42.17% |
| 34 | Brookhaven | 11,650 | 4,857 | 41.69% |
| 35 | Cleveland | 10,623 | 4,385 | 41.28% |
| 36 | Ridgeland | 24,587 | 9,850 | 40.06% |
| 37 | Hattiesburg | 48,619 | 19,219 | 39.53% |
| 38 | Grenada | 12,375 | 4,822 | 38.97% |
| 39 | Kosciusko | 6,933 | 2,697 | 38.9% |
| 40 | Louisville | 5,983 | 2,269 | 37.92% |
| 41 | Horn Lake | 26,647 | 9,517 | 35.72% |
| 42 | Natchez | 14,192 | 4,891 | 34.46% |
| 43 | West Point | 9,900 | 3,067 | 30.98% |
| 44 | Meridian | 34,137 | 10,343 | 30.3% |
| 45 | Columbus | 23,348 | 6,927 | 29.67% |
| 46 | Laurel | 17,679 | 5,070 | 28.68% |
| 47 | Greenwood | 14,086 | 3,599 | 25.55% |
| 48 | Byram | 12,799 | 3,169 | 24.76% |
| 49 | Holly Springs | 6,704 | 1,606 | 23.96% |
| 50 | Vicksburg | 20,589 | 4,884 | 23.72% |
| 51 | Mccomb | 12,049 | 2,819 | 23.4% |
| 52 | Forest | 5,357 | 1,232 | 23.0% |
| 53 | Moss Point | 11,957 | 2,692 | 22.51% |
| 54 | Canton | 10,811 | 2,118 | 19.59% |
| 55 | Indianola | 9,062 | 1,356 | 14.96% |
| 56 | Greenville | 28,166 | 4,188 | 14.87% |
| 57 | Clarksdale | 14,231 | 1,908 | 13.41% |
| 58 | Jackson | 146,631 | 19,514 | 13.31% |
| 59 | Yazoo City | 10,219 | 990 | 9.69% |