
Irvine’s neighborhoods conjure up too many stereotypes to count. You’ve got hipster areas, preppy places, neighborhoods where college kids thrive, and of course, ghettos.
It seems as if there’s a neighborhood for everyone in Irvine.
And while the city consistently ranks as one of the best places to live in California thanks in part to tons of entertainment and jobs, it’s not all rainbows and sunshine in Irvine. Some neighborhoods aren’t as safe as others.
So the question arises, which Irvine neighborhoods are the most dangerous and which are the safest?
Today, we’ll use Saturday Night Science to determine which Irvine hoods need a little tender loving care – the sore thumbs of the Irvine area if you will. Realistically, you can’t expect all the neighborhoods to be amazing, although Northwood Point ranks way above the rest.
We examined 22 of Irvine’s neighborhoods to find out the most dangerous places to live. These places don’t quite measure up to Irvine’s reputation.
Table Of Contents: Top 10 | Methodology | Summary | Table
So what’s the worst neighborhood to live in Irvine for 2025? According to the most recent census data, San Joaquin Marsh looks to be the worst neighborhood in Irvine.
Read on to see how we determined the places around Irvine that need a pick-me-up. And remember, don’t blame the messenger.
For more California reading, check out:
- Best Places To Live In California
- Cheapest Places To Live In California
- Most Dangerous Cities In California
The 10 Most Dangerous Neighborhoods In Irvine For 2025
1. San Joaquin Marsh
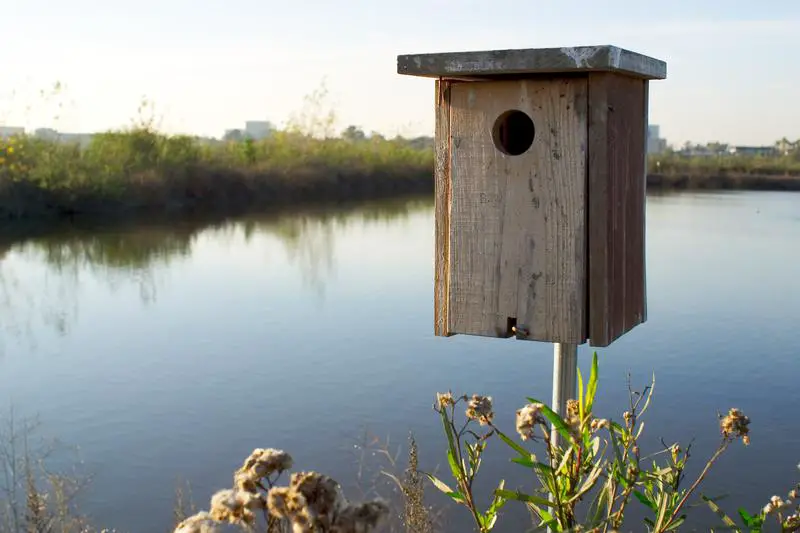
/10
Population: 412
Violent Crimes Per 100k: 64
Property Crime Per 100k: 3,807
Median Home Value: $607,300 (3rd worst)
Median Income: $58,820 (4th worst)
2. Irvine Health And Science Complex
/10
Population: 8,644
Violent Crimes Per 100k: 403
Property Crime Per 100k: 9,088
Median Home Value: $918,700 (16th worst)
Median Income: $88,519 (5th worst)
3. Great Park
/10
Population: 235
Violent Crimes Per 100k: 82
Property Crime Per 100k: 2,398
Median Home Value: $918,700 (16th worst)
Median Income: $54,286 (2nd worst)
4. Rancho San Joaquin
/10
Population: 4,512
Violent Crimes Per 100k: 69
Property Crime Per 100k: 1,760
Median Home Value: $641,200 (4th worst)
Median Income: $58,520 (3rd worst)
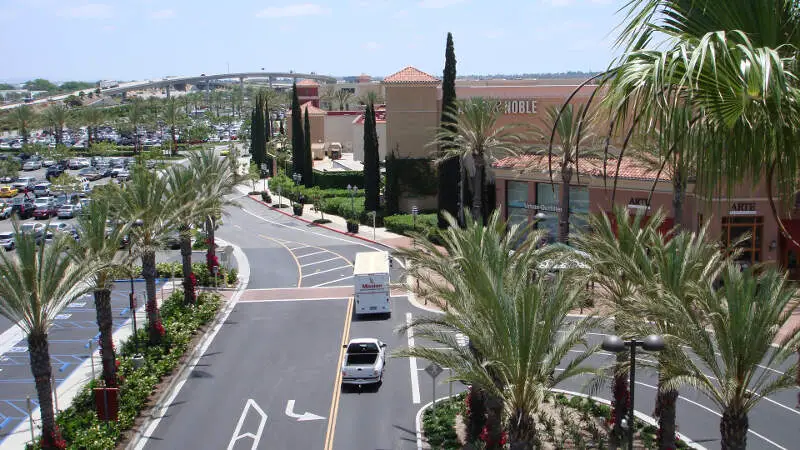
5. Business District
/10
Population: 15,635
Violent Crimes Per 100k: 60
Property Crime Per 100k: 1,766
Median Home Value: $721,271 (6th worst)
Median Income: $93,495 (6th worst)
6. University Town Center
/10
Population: 6,421
Violent Crimes Per 100k: 49
Property Crime Per 100k: 1,441
Median Home Value: $569,733 (2nd worst)
Median Income: $40,539 (worst)
7. East Industrial Complex
/10
Population: 2,182
Violent Crimes Per 100k: 26
Property Crime Per 100k: 4,559
Median Home Value: $777,833 (12th worst)
Median Income: $131,326 (16th worst)
8. Spectrum
/10
Population: 9,610
Violent Crimes Per 100k: 145
Property Crime Per 100k: 2,767
Median Home Value: $969,175 (17th worst)
Median Income: $133,208 (17th worst)
9. El Camino Real
/10
Population: 15,999
Violent Crimes Per 100k: 51
Property Crime Per 100k: 1,201
Median Home Value: $687,291 (5th worst)
Median Income: $104,550 (8th worst)
10. Lower Peters Canyon
/10
Population: 18,938
Violent Crimes Per 100k: 51
Property Crime Per 100k: 1,772
Median Home Value: $759,843 (9th worst)
Median Income: $112,733 (10th worst)
Methodology: How we determined the most dangerous Irvine neighborhoods in 2025
To figure out how bad a place is to live in, we only needed to know what kinds of things people like and then decide what places have the least amount of those things. We plugged the following criteria into Saturday Night Science to get the worst neighborhoods in Irvine:
- High crime (Estimated)
- High unemployment (Less jobs)
- Low median income (Less pay)
- Low population density (No things to do)
- Low home values (No one’s willing to pay to live here)
Then, we ranked each neighborhood in Irvine, California for each of these criteria from worst to best.
Next, we averaged the individual rankings for each criterion into a “Worst Score.”
The neighborhood with the lowest “Worst Score” ranks as the most dangerous neighborhood of Irvine.
The article is an opinion based on facts and is meant as infotainment. We updated this article for 2025. This report is our time ranking the worst neighborhoods to live in Irvine.
Skip to the end to see the list of all 22 neighborhoods ranked from worst to best.
Summary: The Worst Neighborhoods Around Irvine
Well, there you have it — the worst of the neighborhoods in Irvine with San Joaquin Marsh landing at the bottom of the pack.
The worst neighborhoods in Irvine are San Joaquin Marsh, Irvine Health And Science Complex, Great Park, Rancho San Joaquin, Business District, University Town Center, East Industrial Complex, Spectrum, El Camino Real, and Lower Peters Canyon.
As mentioned earlier, the neighborhoods in Irvine aren’t all bad. Northwood Point takes the cake as the best place to live in Irvine.
The best neighborhoods in Irvine are Northwood Point, Shady Canyon, Turtle Rock, West Park, and University Park.
We ranked the neighborhoods from worst to best in the chart below.
For more California reading, check out:
Most Dangerous Neighborhoods To Live In Irvine For 2025?
| Rank | Neighborhood | Population | Home Value | Median Income |
|---|---|---|---|---|
| 1 | San Joaquin Marsh | 412 | $607,300 | $58,820 |
| 2 | Irvine Health And Science Complex | 8,644 | $918,700 | $88,519 |
| 3 | Great Park | 235 | $918,700 | $54,286 |
| 4 | Rancho San Joaquin | 4,512 | $641,200 | $58,520 |
| 5 | Business District | 15,635 | $721,271 | $93,495 |
| 6 | University Town Center | 6,421 | $569,733 | $40,539 |
| 7 | East Industrial Complex | 2,182 | $777,833 | $131,326 |
| 8 | Spectrum | 9,610 | $969,175 | $133,208 |
| 9 | El Camino Real | 15,999 | $687,291 | $104,550 |
| 10 | Lower Peters Canyon | 18,938 | $759,843 | $112,733 |
| 11 | Uc Irvine | 15,807 | $502,167 | $103,800 |
| 12 | Walnut Village | 7,675 | $770,450 | $136,378 |
| 13 | Woodbridge | 24,966 | $745,050 | $114,407 |
| 14 | El Toro Marine Air Station | 5,237 | $1,082,050 | $159,791 |
| 15 | Oak Creek | 10,018 | $768,160 | $114,778 |
| 16 | Northwood | 22,218 | $798,725 | $111,899 |
| 17 | Quail Hill | 7,651 | $1,367,400 | $225,050 |
| 18 | University Park | 7,885 | $732,950 | $115,890 |
| 19 | West Park | 22,993 | $815,446 | $129,158 |
| 20 | Turtle Rock | 10,186 | $1,221,012 | $131,074 |
| 21 | Shady Canyon | 777 | $1,074,500 | $170,363 |
| 22 | Northwood Point | 7,561 | $1,220,300 | $165,372 |