
Kansas City’s neighborhoods conjure up too many stereotypes to count. You’ve got hipster areas, preppy places, neighborhoods where college kids thrive, and of course, ghettos.
It seems as if there’s a neighborhood for everyone in Kansas City.
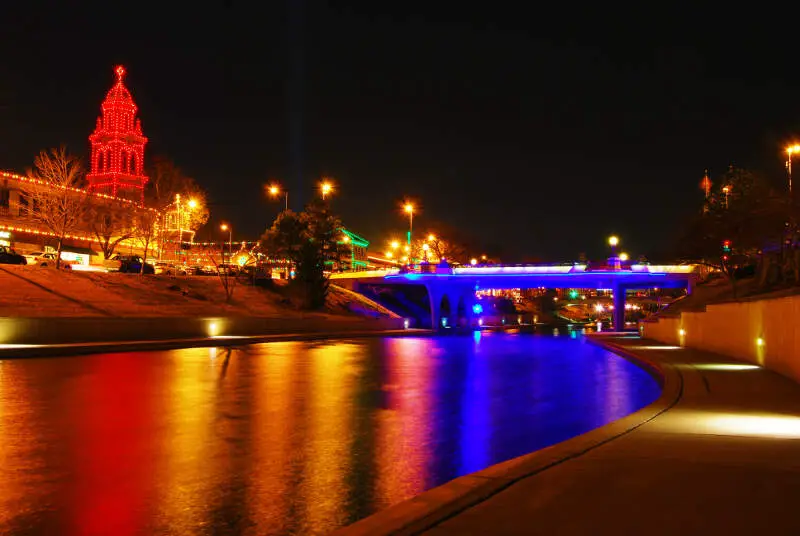
And while the city consistently ranks as one of the best places to live in Missouri thanks in part to tons of entertainment and jobs, it’s not all rainbows and sunshine in Kansas City. Some neighborhoods aren’t as safe as others.
So the question arises, which Kansas City neighborhoods are the most dangerous and which are the safest?
Today, we’ll use Saturday Night Science to determine which Kansas City hoods need a little tender loving care – the sore thumbs of the Kansas City area if you will. Realistically, you can’t expect all the neighborhoods to be amazing, although South Plaza ranks way above the rest.
We examined 117 of Kansas City’s neighborhoods to find out the most dangerous places to live. These places don’t quite measure up to Kansas City’s reputation.
Table Of Contents: Top 10 | Methodology | Summary | Table
So what’s the worst neighborhood to live in Kansas City for 2025? According to the most recent census data, Blue Valley Industrial looks to be the worst neighborhood in Kansas City.
Read on to see how we determined the places around Kansas City that need a pick-me-up. And remember, don’t blame the messenger.
For more Missouri reading, check out:
- Best Places To Live In Missouri
- Cheapest Places To Live In Missouri
- Most Dangerous Cities in Missouri
The 10 Most Dangerous Neighborhoods In Kansas City For 2025
/10
Population: 1,129
Violent Crimes Per 100k: 1,149
Property Crime Per 100k: 11,601
Median Home Value: $47,300 (16th worst)
Median Income: $33,803 (30th worst)
More on Blue Valley Industrial: Data
/10
Population: 2,555
Violent Crimes Per 100k: 2,364
Property Crime Per 100k: 7,934
Median Home Value: $45,167 (13th worst)
Median Income: $32,100 (25th worst)
More on Sheffield: Data
/10
Population: 1,117
Violent Crimes Per 100k: 5,880
Property Crime Per 100k: 8,667
Median Home Value: $78,333 (45th worst)
Median Income: $29,086 (17th worst)
More on Marlborough East: Data
/10
Population: 1,403
Violent Crimes Per 100k: 2,364
Property Crime Per 100k: 7,934
Median Home Value: $46,200 (15th worst)
Median Income: $25,971 (12th worst)
More on South Blue Valley: Data
/10
Population: 1,312
Violent Crimes Per 100k: 3,090
Property Crime Per 100k: 6,655
Median Home Value: $68,600 (36th worst)
Median Income: $18,207 (2nd worst)
More on Legacy East: Data
/10
Population: 1,930
Violent Crimes Per 100k: 4,327
Property Crime Per 100k: 8,262
Median Home Value: $41,200 (9th worst)
Median Income: $25,932 (11th worst)
More on Knoches Park: Data
/10
Population: 4,392
Violent Crimes Per 100k: 3,877
Property Crime Per 100k: 9,206
Median Home Value: $56,100 (25th worst)
Median Income: $23,420 (8th worst)
More on Lykins: Data
/10
Population: 1,462
Violent Crimes Per 100k: 2,331
Property Crime Per 100k: 7,821
Median Home Value: $29,200 (worst)
Median Income: $40,532 (5worst)
More on Eastwood Hills West: Data
/10
Population: 1,999
Violent Crimes Per 100k: 3,245
Property Crime Per 100k: 9,876
Median Home Value: $43,550 (10th worst)
Median Income: $30,520 (20th worst)
More on East Blue Valley: Data
/10
Population: 1,419
Violent Crimes Per 100k: 4,571
Property Crime Per 100k: 6,020
Median Home Value: $51,750 (2worst)
Median Income: $14,866 (worst)
More on Central Blue Valley-Park Tower Grade: Data
Methodology: How we determined the most dangerous Kansas City neighborhoods in 2025
To figure out how bad a place is to live in, we only needed to know what kinds of things people like and then decide what places have the least amount of those things. We plugged the following criteria into Saturday Night Science to get the worst neighborhoods in Kansas City:
- High crime (Estimated)
- High unemployment (Less jobs)
- Low median income (Less pay)
- Low population density (No things to do)
- Low home values (No one’s willing to pay to live here)
Then, we ranked each neighborhood in Kansas City, Missouri for each of these criteria from worst to best.
Next, we averaged the individual rankings for each criterion into a “Worst Score.”
The neighborhood with the lowest “Worst Score” ranks as the most dangerous neighborhood of Kansas City.
The article is an opinion based on facts and is meant as infotainment. We updated this article for 2025. This report is our time ranking the worst neighborhoods to live in Kansas City.
Skip to the end to see the list of all 117 neighborhoods ranked from worst to best.
Summary: The Worst Neighborhoods Around Kansas City
Well, there you have it — the worst of the neighborhoods in Kansas City with Blue Valley Industrial landing at the bottom of the pack.
The worst neighborhoods in Kansas City are Blue Valley Industrial, Sheffield, Marlborough East, South Blue Valley, Legacy East, Knoches Park, Lykins, Eastwood Hills West, East Blue Valley, and Central Blue Valley-Park Tower Grade.
As mentioned earlier, the neighborhoods in Kansas City aren’t all bad. South Plaza takes the cake as the best place to live in Kansas City.
The best neighborhoods in Kansas City are South Plaza, Westwood, Country Club Plaza, West Plaza, and Tower Homes.
We ranked the neighborhoods from worst to best in the chart below.
For more Missouri reading, check out:
Most Dangerous Neighborhoods To Live In Kansas City For 2025?
| Rank | Neighborhood | Population | Home Value | Median Income |
|---|---|---|---|---|
| 1 | Blue Valley Industrial | 1,129 | $47,300 | $33,803 |
| 2 | Sheffield | 2,555 | $45,167 | $32,100 |
| 3 | Marlborough East | 1,117 | $78,333 | $29,086 |
| 4 | South Blue Valley | 1,403 | $46,200 | $25,971 |
| 5 | Legacy East | 1,312 | $68,600 | $18,207 |
| 6 | Knoches Park | 1,930 | $41,200 | $25,932 |
| 7 | Lykins | 4,392 | $56,100 | $23,420 |
| 8 | Eastwood Hills West | 1,462 | $29,200 | $40,532 |
| 9 | East Blue Valley | 1,999 | $43,550 | $30,520 |
| 10 | Central Blue Valley-Park Tower Grade | 1,419 | $51,750 | $14,866 |
| 11 | West Blue Valley | 1,865 | $39,200 | $18,654 |
| 12 | North Blue Ridge | 876 | $44,800 | $30,060 |
| 13 | South Town Fork Creek | 1,067 | $52,900 | $31,216 |
| 14 | Northest Industrial District | 145 | $58,350 | $31,608 |
| 15 | Ingleside | 1,110 | $50,750 | $33,365 |
| 16 | Ashland Ridge | 1,525 | $74,700 | $19,189 |
| 17 | Hidden Valley | 1,558 | $50,300 | $23,533 |
| 18 | Indipendence Plaza | 2,338 | $68,020 | $24,060 |
| 19 | Swope Parkway-Elmwood | 2,541 | $67,933 | $31,053 |
| 20 | Key Coalition | 1,846 | $45,500 | $26,845 |
| 21 | East Community Team North | 3,155 | $74,000 | $33,534 |
| 22 | Wendell Phillips | 1,761 | $158,800 | $38,080 |
| 23 | Washington Weatley | 1,876 | $51,900 | $35,113 |
| 24 | Marlborough Heights-Marlborough Pride | 2,591 | $33,080 | $26,330 |
| 25 | Linwood Homeowner-Ivanhoe | 1,346 | $56,500 | $21,750 |
| 26 | Ivanhoe Southeast | 1,613 | $33,200 | $38,880 |
| 27 | Oak Park Northwest | 2,576 | $47,600 | $23,026 |
| 28 | East Sqope Highlands | 927 | $104,300 | $33,356 |
| 29 | Norble And Gregory Ridge | 1,842 | $66,367 | $36,942 |
| 30 | Riss Lake | 2,564 | $112,200 | $36,372 |
| 31 | Ruskin Heights | 4,791 | $70,825 | $37,661 |
| 32 | Westside South | 1,545 | $142,600 | $42,276 |
| 33 | Santa Fe | 2,103 | $56,775 | $29,174 |
| 34 | Hickman Mills | 3,183 | $111,540 | $35,914 |
| 35 | Vineyard Northwest | 1,054 | $40,800 | $41,277 |
| 36 | East Community Team South | 3,804 | $29,800 | $41,411 |
| 37 | East Meyer | 4,625 | $76,560 | $35,925 |
| 38 | Hickman Mills South | 1,301 | $70,350 | $53,599 |
| 39 | Lewis Heights | 362 | $103,400 | $27,024 |
| 40 | Fairwood And Robandee | 3,165 | $103,825 | $40,445 |
| 41 | Ruskin Hills | 3,088 | $88,300 | $50,824 |
| 42 | Country Valley-Hawthorn Square | 340 | $158,500 | $45,549 |
| 43 | Blue Hills | 4,600 | $52,914 | $40,152 |
| 44 | North Town Fork Creek | 2,979 | $124,514 | $35,811 |
| 45 | Oak Park Southeast | 1,268 | $41,100 | $37,805 |
| 46 | Beacon Hills | 1,198 | $158,800 | $40,562 |
| 47 | Manheim Park | 1,523 | $172,600 | $32,012 |
| 48 | Stanford Estates | 1,771 | $80,300 | $54,219 |
| 49 | Bleheim Square-Research Hospital | 1,652 | $66,000 | $23,264 |
| 50 | Brown Estates | 907 | $115,100 | $52,884 |
| 51 | Ivanhoe Northeast | 866 | $44,900 | $38,728 |
| 52 | Swope Park Campus | 1,042 | $101,833 | $36,687 |
| 53 | Oak Park Southwest | 2,474 | $37,200 | $68,433 |
| 54 | Robandee South | 1,511 | $77,000 | $60,170 |
| 55 | Self Help Neighborhood Council | 2,054 | $67,250 | $35,040 |
| 56 | Palestine West And Oak Park Northeast | 1,209 | $64,500 | $40,926 |
| 57 | Fairlane | 5,035 | $95,675 | $48,856 |
| 58 | Sterling Acres | 766 | $97,500 | $49,100 |
| 59 | Hillcrest | 452 | $127,800 | $40,368 |
| 60 | Sarritt Point | 4,325 | $72,520 | $35,911 |
| 61 | Vineyard | 2,555 | $49,600 | $41,246 |
| 62 | Holmes Park | 932 | $183,600 | $49,125 |
| 63 | Richards Gebaur | 1,125 | $202,350 | $37,652 |
| 64 | Pendleton Heights | 3,798 | $164,225 | $33,780 |
| 65 | Oakwood | 1,007 | $127,350 | $45,714 |
| 66 | Park Farms | 3,340 | $103,850 | $44,742 |
| 67 | South India Mound | 5,458 | $66,050 | $44,198 |
| 68 | Santa Fe Hills | 2,029 | $153,067 | $58,618 |
| 69 | Westside North | 2,059 | $182,233 | $54,386 |
| 70 | Eastwood Hill East | 3,615 | $87,900 | $51,980 |
| 71 | Citadel | 1,889 | $165,700 | $38,155 |
| 72 | Bannister Ares | 1,518 | $121,350 | $50,536 |
| 73 | Lea Manor | 1,900 | $200,000 | $85,491 |
| 74 | South Hyde Park | 1,949 | $193,600 | $56,936 |
| 75 | North India Mound | 5,296 | $75,800 | $36,925 |
| 76 | Little Blue Valley | 3,670 | $195,320 | $81,899 |
| 77 | Bonne Hills | 1,787 | $151,933 | $59,294 |
| 78 | Linden Hills And Indian Heights | 2,401 | $151,250 | $59,897 |
| 79 | Eastern 49-63 | 3,305 | $123,833 | $42,741 |
| 80 | Hanover Place | 2,668 | $221,800 | $43,479 |
| 81 | Union Hill | 505 | $248,100 | $70,612 |
| 82 | Highview Estates | 2,096 | $246,833 | $76,796 |
| 83 | North Hyde Park | 1,875 | $245,150 | $26,801 |
| 84 | Blue Hills Estates | 1,520 | $224,800 | $53,319 |
| 85 | Roanoke | 400 | $600,000 | $85,000 |
| 86 | Saint Catherine’s Gardens | 2,573 | $119,000 | $62,102 |
| 87 | Stayton Meadows | 2,325 | $119,400 | $64,711 |
| 88 | Martin City | 825 | $256,800 | $65,500 |
| 89 | Western Hills | 1,935 | $147,600 | $65,350 |
| 90 | Birdlespur | 1,364 | $168,650 | $89,478 |
| 91 | Southmoreland | 3,950 | $197,680 | $53,798 |
| 92 | Faireway Hills | 2,342 | $128,200 | $74,063 |
| 93 | Mission Lake | 3,585 | $185,800 | $73,739 |
| 94 | White Oak | 2,802 | $112,000 | $58,733 |
| 95 | Valentine | 1,449 | $300,000 | $44,362 |
| 96 | River Market | 2,247 | $438,500 | $76,806 |
| 97 | Willow Creek | 4,014 | $144,350 | $48,485 |
| 98 | Blue Vue Hills | 2,047 | $172,200 | $70,125 |
| 99 | Crown Center | 1,455 | $244,133 | $74,465 |
| 100 | Central Business District-Downtown | 4,364 | $191,233 | $52,423 |
| 101 | Red Ridge South | 2,970 | $227,900 | $46,227 |
| 102 | West Waldo | 1,414 | $180,700 | $67,534 |
| 103 | Royal Oaks | 1,622 | $177,900 | $61,198 |
| 104 | Unity Ridge | 1,150 | $333,300 | $93,542 |
| 105 | Country Lane Estates | 2,053 | $229,300 | $48,938 |
| 106 | Plaza Westport | 1,252 | $271,150 | $86,275 |
| 107 | Ward Parkway | 2,577 | $213,267 | $80,602 |
| 108 | Central Hyde Park | 1,789 | $335,650 | $103,888 |
| 109 | Morningside | 1,534 | $317,250 | $115,357 |
| 110 | Volker | 3,765 | $281,675 | $65,231 |
| 111 | Western 49-63 | 4,461 | $273,525 | $71,579 |
| 112 | Oak Meyer Gardens | 1,513 | $259,400 | $51,154 |
| 113 | Tower Homes | 5,669 | $176,600 | $78,097 |
| 114 | West Plaza | 4,278 | $211,660 | $71,537 |
| 115 | Country Club Plaza | 745 | $1,023,300 | $57,680 |
| 116 | Westwood | 800 | $281,400 | $103,164 |
| 117 | South Plaza | 2,747 | $414,133 | $75,496 |