
Salt Lake City’s neighborhoods conjure up too many stereotypes to count. You’ve got hipster areas, preppy places, neighborhoods where college kids thrive, and of course, ghettos.
It seems as if there’s a neighborhood for everyone in Salt Lake City.
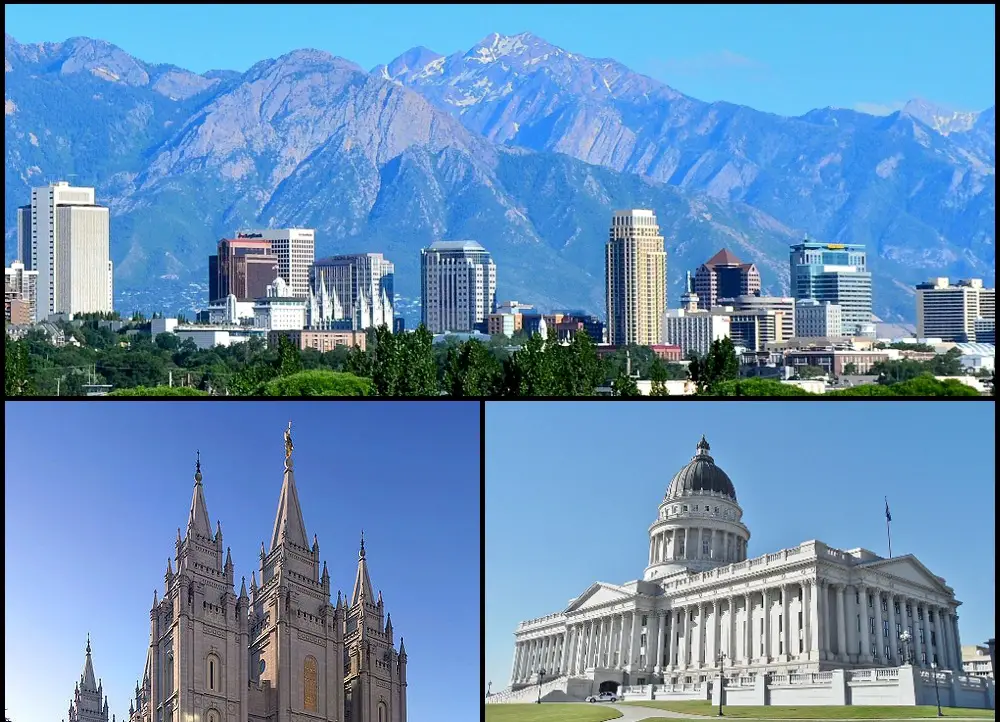
And while the city consistently ranks as one of the best places to live in Utah thanks in part to tons of entertainment and jobs, it’s not all rainbows and sunshine in Salt Lake City. Some neighborhoods aren’t as safe as others.
So the question arises, which Salt Lake City neighborhoods are the most dangerous and which are the safest?
Today, we’ll use Saturday Night Science to determine which Salt Lake City hoods need a little tender loving care – the sore thumbs of the Salt Lake City area if you will. Realistically, you can’t expect all the neighborhoods to be amazing, although Wasatch Hollow ranks way above the rest.
We examined 18 of Salt Lake City’s neighborhoods to find out the most dangerous places to live. These places don’t quite measure up to Salt Lake City’s reputation.
Table Of Contents: Top 10 | Methodology | Summary | Table
So what’s the worst neighborhood to live in Salt Lake City for 2025? According to the most recent census data, Poplar Grove looks to be the worst neighborhood in Salt Lake City.
Read on to see how we determined the places around Salt Lake City that need a pick-me-up. And remember, don’t blame the messenger.
For more Utah reading, check out:
The 10 Most Dangerous Neighborhoods In Salt Lake City For 2025
/10
Population: 15,850
Violent Crimes Per 100k: 2,200
Property Crime Per 100k: 10,523
Median Home Value: $192,100 (worst)
Median Income: $47,916 (3rd worst)
More on Poplar Grove: Data
/10
Population: 7,257
Violent Crimes Per 100k: 1,693
Property Crime Per 100k: 8,268
Median Home Value: $244,880 (6th worst)
Median Income: $64,686 (11th worst)
More on Westpointe: Data
/10
Population: 14,606
Violent Crimes Per 100k: 1,794
Property Crime Per 100k: 10,223
Median Home Value: $204,700 (2nd worst)
Median Income: $57,690 (8th worst)
More on Glendale: Data
/10
Population: 6,142
Violent Crimes Per 100k: 1,109
Property Crime Per 100k: 7,214
Median Home Value: $265,500 (7th worst)
Median Income: $45,552 (worst)
More on People’s Freeway: Data
/10
Population: 6,714
Violent Crimes Per 100k: 891
Property Crime Per 100k: 4,310
Median Home Value: $211,633 (3rd worst)
Median Income: $47,052 (2nd worst)
More on Fairpark: Data
/10
Population: 3,074
Violent Crimes Per 100k: 614
Property Crime Per 100k: 3,978
Median Home Value: $228,383 (5th worst)
Median Income: $49,139 (4th worst)
More on Central City-Liberty Welss: Data
/10
Population: 4,193
Violent Crimes Per 100k: 2,259
Property Crime Per 100k: 5,778
Median Home Value: $295,629 (9th worst)
Median Income: $52,200 (6th worst)
More on Downtown: Data
/10
Population: 11,433
Violent Crimes Per 100k: 865
Property Crime Per 100k: 5,593
Median Home Value: $226,575 (4th worst)
Median Income: $67,497 (12th worst)
More on Rose Park: Data
/10
Population: 9,006
Violent Crimes Per 100k: 590
Property Crime Per 100k: 3,188
Median Home Value: $388,027 (12th worst)
Median Income: $64,235 (10th worst)
More on Capitol Hill: Data
/10
Population: 10,642
Violent Crimes Per 100k: 463
Property Crime Per 100k: 3,340
Median Home Value: $357,675 (10th worst)
Median Income: $49,929 (5th worst)
More on Central City: Data
Methodology: How we determined the most dangerous Salt Lake City neighborhoods in 2025
To figure out how bad a place is to live in, we only needed to know what kinds of things people like and then decide what places have the least amount of those things. We plugged the following criteria into Saturday Night Science to get the worst neighborhoods in Salt Lake City:
- High crime (Estimated)
- High unemployment (Less jobs)
- Low median income (Less pay)
- Low population density (No things to do)
- Low home values (No one’s willing to pay to live here)
Then, we ranked each neighborhood in Salt Lake City, Utah for each of these criteria from worst to best.
Next, we averaged the individual rankings for each criterion into a “Worst Score.”
The neighborhood with the lowest “Worst Score” ranks as the most dangerous neighborhood of Salt Lake City.
The article is an opinion based on facts and is meant as infotainment. We updated this article for 2025. This report is our time ranking the worst neighborhoods to live in Salt Lake City.
Skip to the end to see the list of all 18 neighborhoods ranked from worst to best.
Summary: The Worst Neighborhoods Around Salt Lake City
Well, there you have it — the worst of the neighborhoods in Salt Lake City with Poplar Grove landing at the bottom of the pack.
The worst neighborhoods in Salt Lake City are Poplar Grove, Westpointe, Glendale, People’s Freeway, Fairpark, Central City-Liberty Welss, Downtown, Rose Park, Capitol Hill, and Central City.
As mentioned earlier, the neighborhoods in Salt Lake City aren’t all bad. Wasatch Hollow takes the cake as the best place to live in Salt Lake City.
The best neighborhoods in Salt Lake City are Wasatch Hollow, Yalecrest, Bonneville Hills, East Bench, and Greater Avenues.
We ranked the neighborhoods from worst to best in the chart below.
For more Utah reading, check out:
Most Dangerous Neighborhoods To Live In Salt Lake City For 2025?
| Rank | Neighborhood | Population | Home Value | Median Income |
|---|---|---|---|---|
| 1 | Poplar Grove | 15,850 | $192,100 | $47,916 |
| 2 | Westpointe | 7,257 | $244,880 | $64,686 |
| 3 | Glendale | 14,606 | $204,700 | $57,690 |
| 4 | People’s Freeway | 6,142 | $265,500 | $45,552 |
| 5 | Fairpark | 6,714 | $211,633 | $47,052 |
| 6 | Central City-Liberty Welss | 3,074 | $228,383 | $49,139 |
| 7 | Downtown | 4,193 | $295,629 | $52,200 |
| 8 | Rose Park | 11,433 | $226,575 | $67,497 |
| 9 | Capitol Hill | 9,006 | $388,027 | $64,235 |
| 10 | Central City | 10,642 | $357,675 | $49,929 |
| 11 | Liberty Wells | 8,450 | $279,200 | $56,526 |
| 12 | Sugar House | 33,395 | $387,543 | $88,859 |
| 13 | East Central | 22,855 | $395,884 | $58,891 |
| 14 | Greater Avenues | 17,539 | $442,454 | $100,032 |
| 15 | East Bench | 10,048 | $629,733 | $113,577 |
| 16 | Bonneville Hills | 4,371 | $463,550 | $88,811 |
| 17 | Yalecrest | 4,225 | $694,033 | $127,629 |
| 18 | Wasatch Hollow | 3,455 | $544,067 | $125,469 |