
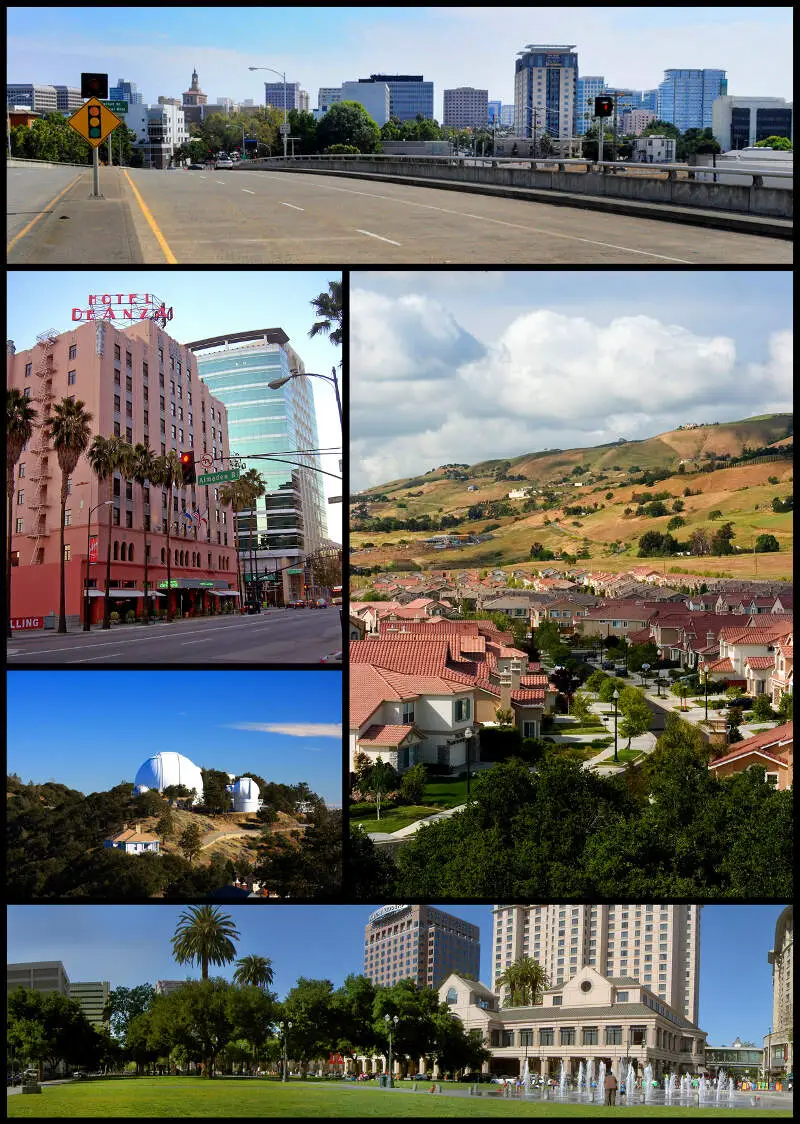
San Jose’s neighborhoods conjure up too many stereotypes to count. You’ve got hipster areas, preppy places, neighborhoods where college kids thrive, and of course, ghettos.
It seems as if there’s a neighborhood for everyone in San Jose.
And while the city consistently ranks as one of the best places to live in California thanks in part to tons of entertainment and jobs, it’s not all rainbows and sunshine in San Jose. Some neighborhoods aren’t as safe as others.
So the question arises, which San Jose neighborhoods are the most dangerous and which are the safest?
Today, we’ll use Saturday Night Science to determine which San Jose hoods need a little tender loving care – the sore thumbs of the San Jose area if you will. Realistically, you can’t expect all the neighborhoods to be amazing, although West San Jose ranks way above the rest.
We examined 18 of San Jose’s neighborhoods to find out the most dangerous places to live. These places don’t quite measure up to San Jose’s reputation.
Table Of Contents: Top 10 | Methodology | Summary | Table
So what’s the worst neighborhood to live in San Jose for 2025? According to the most recent census data, Buena Vista looks to be the worst neighborhood in San Jose.
Read on to see how we determined the places around San Jose that need a pick-me-up. And remember, don’t blame the messenger.
For more California reading, check out:
- Best Places To Live In California
- Cheapest Places To Live In California
- Most Dangerous Cities In California
The 10 Most Dangerous Neighborhoods In San Jose For 2025
/10
Population: 1,423
Violent Crimes Per 100k: 432
Property Crime Per 100k: 1,977
Median Home Value: $420,833 (worst)
Median Income: $44,822 (worst)
More on Buena Vista: Data
Living in Buena Vista, you’ve got a few amenities. You’ll find the tiny Buena Vista Park and a retail strip along San Carlos St. But generally, this area of southwest San Jose exists as a residential enclave. Lots of homes. Well, let’s be more specific: lots of expensive homes.
The main issue here isn’t the modest lack of amenities, though that can certainly get annoying for locals. No, the real issue comes down to the high cost of living. And that starts with real estate prices. The median home value in Buena Vista stands at $420,833. Compare the to a median income of $44,822 and you can see the problem.
/10
Population: 5,274
Violent Crimes Per 100k: 386
Property Crime Per 100k: 1,769
Median Home Value: $556,183 (3rd worst)
Median Income: $57,932 (2nd worst)
More on Burbank: Data
In a different Burbank, they film lots of TV shows and movies. But that’s located about 350 miles to the south, near Los Angeles. This Burbank sits to the southwest of downtown San Jose, nestled into the intersection of I-880 and I-280.
Fewer celebrity sightings, true. But you wouldn’t be able to tell that from the real estate listings. Following the trend of most of the areas on this list, Burbank counts as the number 2 worst part of San Jose for 2025 largely because of its high home prices. The median home value reaches more than $550,000. This figure compares to a median income of just about one tenth that number. You can do the math on that.
/10
Population: 41,443
Violent Crimes Per 100k: 420
Property Crime Per 100k: 1,922
Median Home Value: $469,583 (2nd worst)
Median Income: $73,072 (4th worst)
More on Edenvale-Seven Trees: Data
By now, you’re accustomed to the pattern that has dominated this list so far. Start with a nice neighborhood. Add in a good economy. Yet, somehow, you end up with one of the worst areas of San Jose for 2025. The culprit each time: Bay Area real estate prices just push most people out of the market.
That trend holds for Edenvale-Seven Trees. A charming enough spot in the southern part of the city. A median income of $73,072 and an unemployment rate of 7.1%. Those home prices, though. Here, the median home value reaches $469,583, forcing the cost of living beyond what an average local can afford.
Population: 115,325
Violent Crimes Per 100k: 374
Property Crime Per 100k: 1,714
Median Home Value: $645,096 (5th worst)
Median Income: $96,615 (7th worst)
More on East San Jose: Data
This section of town sits along the border of the sprawling Bay Area megalopolis. It’s not just East San Jose…it counts as the southeastern edge of the entire Bay Area. A quick ride further east and you’ll be out of the city entirely, enjoying nature in spots like Joseph D. Grant County Park.
This provides a best-of-both-worlds situation. You’ve got access to one of the top urban areas in the U.S. At the same time, you can take advantage of a quick escape to the country. The problem? This sweet location comes at a price. The median home value of $645,096 puts home ownership out of the reach of many locals, even with a median income of $96,615.
/10
Population: 56,423
Violent Crimes Per 100k: 382
Property Crime Per 100k: 1,747
Median Home Value: $560,385 (4th worst)
Median Income: $72,752 (3rd worst)
More on Fairgrounds: Data
This isn’t false advertising. There really is a fairground in this part of San Jose. The Santa Clara County Fairgrounds hosts events like ski and snowboard festivals, cat shows, and, of course, the county fair. Meanwhile, the site used to host the San Jose Speedway…you can decide if you’d rather live in a neighborhood called “Speedway.”
So why wouldn’t you want to live in an area that contains a literal carnival for part of the year? Well, a few trip on the Ferris Wheel can’t completely remove financial panic from the locals’ minds. Specifically, the panic about keeping up with house payments. This concern comes as the median home price hovers at $560,385 versus a median income of $72,752.
/10
Population: 29,934
Violent Crimes Per 100k: 351
Property Crime Per 100k: 1,609
Median Home Value: $680,715 (6th worst)
Median Income: $94,629 (5th worst)
More on Alum Rock-East Foothills: Data
As you’d guess from the name, Alum Rock-East Foothills sits on the eastern side of town, along the foothills. It houses the San Jose Country Club. But if you get tired of the manicured greens and delectable lunch selections, you can head out to Alum Rock Park for something a little more raw and unkempt.
The presence of a country club tips off the fact that this is a relatively affluent area. The median income stands at $94,629. However, the country club also suggests the main drawback of the neighborhood: you have to be pretty rich to afford it. Like most of the entries on this list, high real estate prices make this a stretch for anyone but high-paycheck players.
/10
Population: 80,651
Violent Crimes Per 100k: 332
Property Crime Per 100k: 1,520
Median Home Value: $731,928 (7th worst)
Median Income: $105,663 (8th worst)
More on North Valley: Data
Excellent schools. Nice place to raise a family. Plenty of nearby restaurants and shops. Even a few green spots, like Penitencia Creek County Park, to enjoy the beautiful Northern California weather. Who wouldn’t want to live here?
But hold on a second. Do you have half a million bucks handy? Then you might not want to call in the movers just yet.
North Valley might have a lot going for it. But it has the same affordability problems that dog most of the neighborhoods on this list. In this case, a home will run a median price of $731,928. That comes in an area that supports a median income of “just” $105,663.
/10
Population: 38,763
Violent Crimes Per 100k: 272
Property Crime Per 100k: 1,247
Median Home Value: $957,650 (13th worst)
Median Income: $135,823 (12th worst)
More on Berryessa: Data
/10
Population: 58,064
Violent Crimes Per 100k: 279
Property Crime Per 100k: 1,275
Median Home Value: $818,408 (9th worst)
Median Income: $141,919 (13th worst)
More on Santa Teresa: Data
/10
Population: 84,990
Violent Crimes Per 100k: 292
Property Crime Per 100k: 1,335
Median Home Value: $844,232 (11th worst)
Median Income: $95,888 (6th worst)
More on Downtown: Data
In most cities, downtown ranks as one of the nicest parts of town. Here, the central district ranks number 10 on the list of San Jose’s worst neighborhoods for 2025. How did that happen?
It’s certainly not a lack of amenities. As you’d expect, there’s a lot to do downtown. This includes special features like the Children’s Discovery Museum of San Jose. The economy also doesn’t pose much of a problem. The median income sits at $95,888.
The real issue, as we’ve already seen so far on this list, comes from real estate prices. A median home price of $844,232 just makes this a difficult neighborhood to afford.
Methodology: How we determined the most dangerous San Jose neighborhoods in 2025
To figure out how bad a place is to live in, we only needed to know what kinds of things people like and then decide what places have the least amount of those things. We plugged the following criteria into Saturday Night Science to get the worst neighborhoods in San Jose:
- High crime (Estimated)
- High unemployment (Less jobs)
- Low median income (Less pay)
- Low population density (No things to do)
- Low home values (No one’s willing to pay to live here)
Then, we ranked each neighborhood in San Jose, California for each of these criteria from worst to best.
Next, we averaged the individual rankings for each criterion into a “Worst Score.”
The neighborhood with the lowest “Worst Score” ranks as the most dangerous neighborhood of San Jose.
The article is an opinion based on facts and is meant as infotainment. We updated this article for 2025. This report is our time ranking the worst neighborhoods to live in San Jose.
Skip to the end to see the list of all 18 neighborhoods ranked from worst to best.
Summary: The Worst Neighborhoods Around San Jose
Well, there you have it — the worst of the neighborhoods in San Jose with Buena Vista landing at the bottom of the pack.
The worst neighborhoods in San Jose are Buena Vista, Burbank, Edenvale-Seven Trees, East San Jose, Fairgrounds, Alum Rock-East Foothills, North Valley, Berryessa, Santa Teresa, and Downtown.
As mentioned earlier, the neighborhoods in San Jose aren’t all bad. West San Jose takes the cake as the best place to live in San Jose.
The best neighborhoods in San Jose are West San Jose, Almaden Valley, Cambrian Park, Willow Glen, and Rose Garden.
We ranked the neighborhoods from worst to best in the chart below.
For more California reading, check out:
Most Dangerous Neighborhoods To Live In San Jose For 2025?
| Rank | Neighborhood | Population | Home Value | Median Income |
|---|---|---|---|---|
| 1 | Buena Vista | 1,423 | $420,833 | $44,822 |
| 2 | Burbank | 5,274 | $556,183 | $57,932 |
| 3 | Edenvale-Seven Trees | 41,443 | $469,583 | $73,072 |
| 4 | East San Jose | 115,325 | $645,096 | $96,615 |
| 5 | Fairgrounds | 56,423 | $560,385 | $72,752 |
| 6 | Alum Rock-East Foothills | 29,934 | $680,715 | $94,629 |
| 7 | North Valley | 80,651 | $731,928 | $105,663 |
| 8 | Berryessa | 38,763 | $957,650 | $135,823 |
| 9 | Santa Teresa | 58,064 | $818,408 | $141,919 |
| 10 | Downtown | 84,990 | $844,232 | $95,888 |
| 11 | Blossom Valley | 71,983 | $809,087 | $118,432 |
| 12 | Evergreen | 81,105 | $896,235 | $159,304 |
| 13 | North San Jose | 35,478 | $826,107 | $144,769 |
| 14 | Rose Garden | 14,537 | $1,066,850 | $118,739 |
| 15 | Willow Glen | 77,437 | $1,088,590 | $130,927 |
| 16 | Cambrian Park | 70,045 | $1,139,062 | $145,893 |
| 17 | Almaden Valley | 46,778 | $1,176,574 | $181,680 |
| 18 | West San Jose | 96,997 | $1,301,833 | $143,421 |