
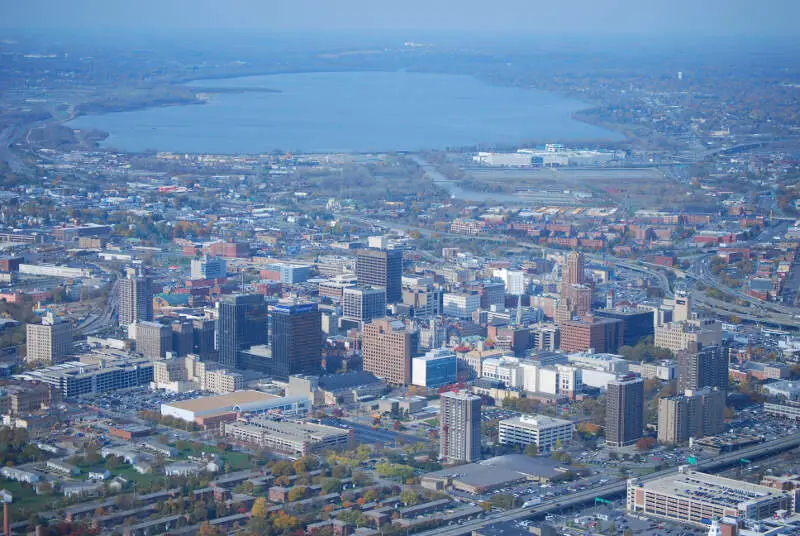
Syracuse’s neighborhoods conjure up too many stereotypes to count. You’ve got hipster areas, preppy places, neighborhoods where college kids thrive, and of course, ghettos.
It seems as if there’s a neighborhood for everyone in Syracuse.
And while the city consistently ranks as one of the best places to live in New York thanks in part to tons of entertainment and jobs, it’s not all rainbows and sunshine in Syracuse. Some neighborhoods aren’t as safe as others.
So the question arises, which Syracuse neighborhoods are the most dangerous and which are the safest?
Today, we’ll use Saturday Night Science to determine which Syracuse hoods need a little tender loving care – the sore thumbs of the Syracuse area if you will. Realistically, you can’t expect all the neighborhoods to be amazing, although Sedgewick ranks way above the rest.
We examined 24 of Syracuse’s neighborhoods to find out the most dangerous places to live. These places don’t quite measure up to Syracuse’s reputation.
Table Of Contents: Top 10 | Methodology | Summary | Table
So what’s the worst neighborhood to live in Syracuse for 2025? According to the most recent census data, Westside looks to be the worst neighborhood in Syracuse.
Read on to see how we determined the places around Syracuse that need a pick-me-up. And remember, don’t blame the messenger.
For more New York reading, check out:
- Best Places To Live In New York
- Cheapest Places To Live In New York
- Most Dangerous Places In New York
The 10 Most Dangerous Neighborhoods In Syracuse For 2025
/10
Population: 2,594
Violent Crimes Per 100k: 677
Property Crime Per 100k: 6,015
Median Home Value: $62,450 (3rd worst)
Median Income: $29,010 (4th worst)
More on Westside: Data
/10
Population: 6,228
Violent Crimes Per 100k: 1,888
Property Crime Per 100k: 4,103
Median Home Value: $66,829 (5th worst)
Median Income: $27,170 (3rd worst)
More on Near Westside: Data
/10
Population: 5,082
Violent Crimes Per 100k: 1,755
Property Crime Per 100k: 3,414
Median Home Value: $64,867 (4th worst)
Median Income: $19,981 (2nd worst)
More on Southwest: Data
/10
Population: 8,794
Violent Crimes Per 100k: 1,568
Property Crime Per 100k: 3,747
Median Home Value: $58,542 (worst)
Median Income: $30,302 (6th worst)
More on Brighton: Data
/10
Population: 2,727
Violent Crimes Per 100k: 1,140
Property Crime Per 100k: 5,031
Median Home Value: $105,020 (15th worst)
Median Income: $35,847 (9th worst)
More on Near Eastside: Data
/10
Population: 1,719
Violent Crimes Per 100k: 786
Property Crime Per 100k: 2,817
Median Home Value: $69,933 (6th worst)
Median Income: $45,367 (15th worst)
More on Elmwood: Data
/10
Population: 5,355
Violent Crimes Per 100k: 505
Property Crime Per 100k: 3,642
Median Home Value: $70,075 (7th worst)
Median Income: $34,589 (8th worst)
More on North Valley: Data
/10
Population: 13,088
Violent Crimes Per 100k: 1,146
Property Crime Per 100k: 4,172
Median Home Value: $76,371 (8th worst)
Median Income: $31,744 (7th worst)
More on Washington Square: Data
/10
Population: 5,199
Violent Crimes Per 100k: 598
Property Crime Per 100k: 3,725
Median Home Value: $91,929 (12th worst)
Median Income: $42,440 (12th worst)
More on Salt Springs: Data
/10
Population: 9,327
Violent Crimes Per 100k: 1,492
Property Crime Per 100k: 4,514
Median Home Value: $82,343 (9th worst)
Median Income: $39,879 (11th worst)
More on Near Northeast: Data
Methodology: How we determined the most dangerous Syracuse neighborhoods in 2025
To figure out how bad a place is to live in, we only needed to know what kinds of things people like and then decide what places have the least amount of those things. We plugged the following criteria into Saturday Night Science to get the worst neighborhoods in Syracuse:
- High crime (Estimated)
- High unemployment (Less jobs)
- Low median income (Less pay)
- Low population density (No things to do)
- Low home values (No one’s willing to pay to live here)
Then, we ranked each neighborhood in Syracuse, New York for each of these criteria from worst to best.
Next, we averaged the individual rankings for each criterion into a “Worst Score.”
The neighborhood with the lowest “Worst Score” ranks as the most dangerous neighborhood of Syracuse.
The article is an opinion based on facts and is meant as infotainment. We updated this article for 2025. This report is our time ranking the worst neighborhoods to live in Syracuse.
Skip to the end to see the list of all 24 neighborhoods ranked from worst to best.
Summary: The Worst Neighborhoods Around Syracuse
Well, there you have it — the worst of the neighborhoods in Syracuse with Westside landing at the bottom of the pack.
The worst neighborhoods in Syracuse are Westside, Near Westside, Southwest, Brighton, Near Eastside, Elmwood, North Valley, Washington Square, Salt Springs, and Near Northeast.
As mentioned earlier, the neighborhoods in Syracuse aren’t all bad. Sedgewick takes the cake as the best place to live in Syracuse.
The best neighborhoods in Syracuse are Sedgewick, Eastwood, Meadowbrook, University, and South Valley.
We ranked the neighborhoods from worst to best in the chart below.
For more New York reading, check out:
- Richest Cities In New York
- Safest Places In New York According To Science
- Worst Places To Live In New York State
Most Dangerous Neighborhoods To Live In Syracuse For 2025?
| Rank | Neighborhood | Population | Home Value | Median Income |
|---|---|---|---|---|
| 1 | Westside | 2,594 | $62,450 | $29,010 |
| 2 | Near Westside | 6,228 | $66,829 | $27,170 |
| 3 | Southwest | 5,082 | $64,867 | $19,981 |
| 4 | Brighton | 8,794 | $58,542 | $30,302 |
| 5 | Near Eastside | 2,727 | $105,020 | $35,847 |
| 6 | Elmwood | 1,719 | $69,933 | $45,367 |
| 7 | North Valley | 5,355 | $70,075 | $34,589 |
| 8 | Washington Square | 13,088 | $76,371 | $31,744 |
| 9 | Salt Springs | 5,199 | $91,929 | $42,440 |
| 10 | Near Northeast | 9,327 | $82,343 | $39,879 |
| 11 | Skunk City | 2,257 | $60,550 | $29,846 |
| 12 | Outer Comstock | 4,522 | $118,750 | $37,740 |
| 13 | Lakefront | 913 | $136,267 | $49,131 |
| 14 | Wescott | 2,892 | $129,267 | $44,748 |
| 15 | University Hill | 8,566 | $156,300 | $12,277 |
| 16 | Lincoln Park | 2,012 | $162,800 | $97,531 |
| 17 | Strathmore | 6,277 | $83,714 | $61,697 |
| 18 | Far West-Side | 5,954 | $92,417 | $54,356 |
| 19 | Northside | 9,055 | $84,880 | $54,301 |
| 20 | South Valley | 5,019 | $234,267 | $52,706 |
| 21 | University | 4,373 | $180,300 | $52,506 |
| 22 | Meadowbrook | 4,632 | $172,367 | $75,346 |
| 23 | Eastwood | 13,236 | $99,475 | $45,204 |
| 24 | Sedgewick | 2,136 | $196,850 | $106,808 |