
Most Americans have never been to small town Illinois. However, as the Illinoisan who live there know, small town Illinois is an awesome place to call home.
But is it all roses? Definitely not. Just like any other state, Illinois has its trouble spots. This article aims to determine, using Saturday Night Science, the absolute worst small towns to live in the Prairie State. Don’t freak out, we will use data to show which places have high crime, poverty, and unemployment.
After analyzing more than 358 of Illinois’s smallest cities, we came up with this list as the 10 worst small towns in Illinois where you’d never want to live:
Table Of Contents: Top Ten | Methodology | Summary | Table
These are the worst small towns in Illinois for 2025:
- Cairo
- Madison
- Ina
- Ford Heights
- Grayville
- De Pue
- Venice
- Thomson
- Washington Park
- Sheldon
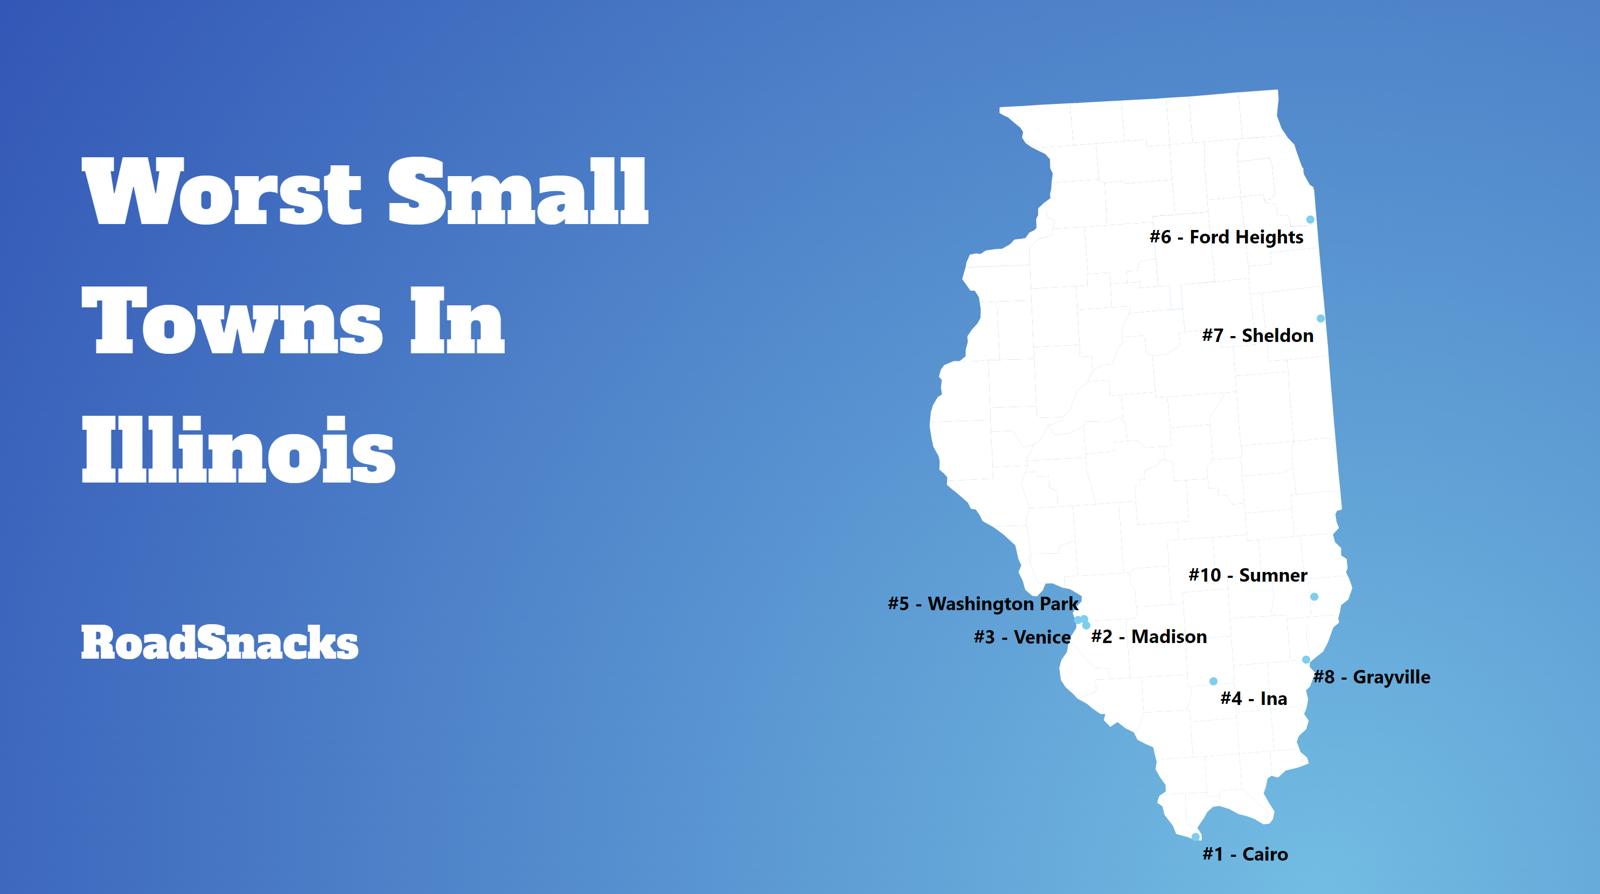
So what is the worst small town to call home in Illinois for 2025? According to the most recent census data, Cairo is the worst small town to live in Illinois.
While many of these small towns have seen better days, they have wonderful communities and people. This report in no way means to knock the folks that call towns like Cairo home. Everyone
Read on below to see how we crunched the numbers, or scroll to the bottom to see how your town ranked.
And if you already know about the small towns, check out the best places to live in Illinois or the worst places to live in Illinois.
If you’re looking for something more national, check out the worst cities in America or the worst states in America.
The 10 Worst Small Towns In Illinois For 2025
1. Cairo
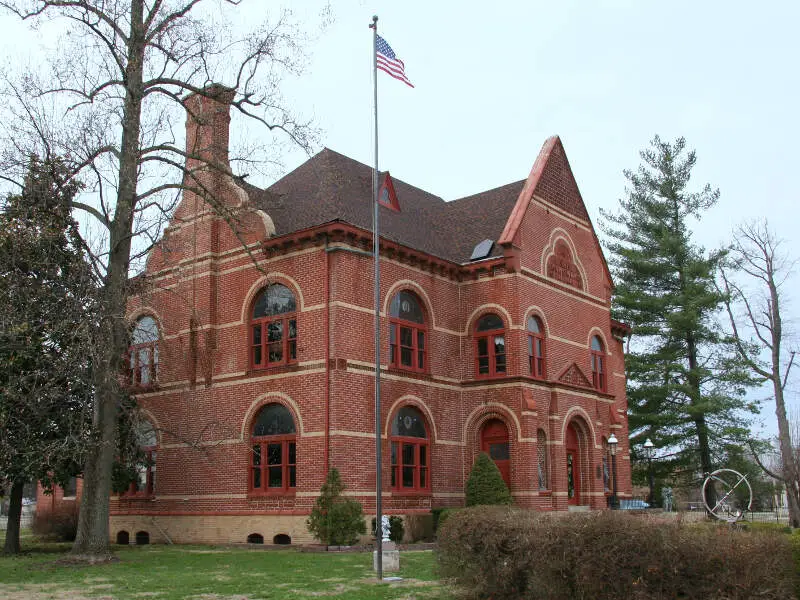
/10
Population: 1,699
Median Home Value: $28,200
Median Income: $35,493
Unemployment Rate: 17.5%
2. Madison

/10
Population: 2,788
Median Home Value: $51,200
Median Income: $44,181
Unemployment Rate: 21.4%
3. Ina
/10
Population: 1,600
Median Home Value: $88,500
Median Income: $46,250
Unemployment Rate: 13.7%
4. Ford Heights
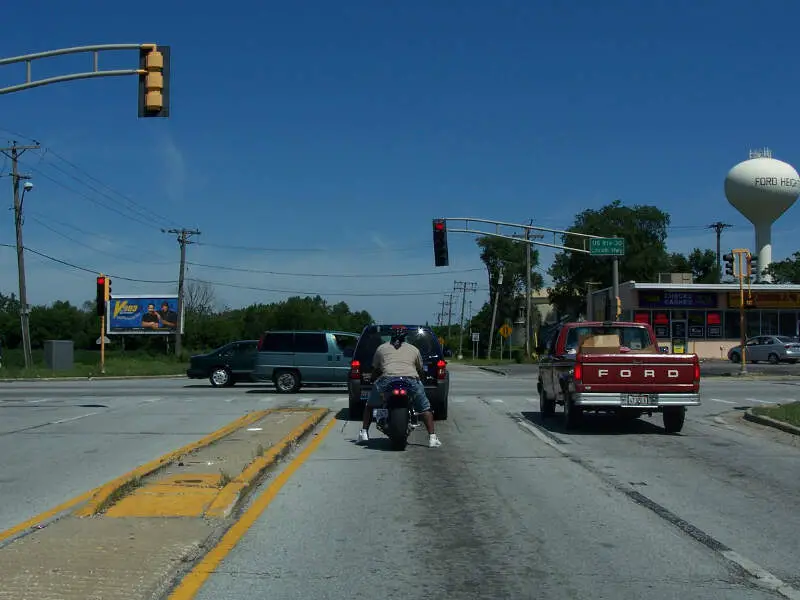
/10
Population: 1,587
Median Home Value: $48,000
Median Income: $34,323
Unemployment Rate: 11.0%
5. Grayville
/10
Population: 1,515
Median Home Value: $76,000
Median Income: $47,308
Unemployment Rate: 6.8%
6. De Pue
/10
Population: 1,594
Median Home Value: $63,600
Median Income: $56,176
Unemployment Rate: 7.0%
7. Venice
/10
Population: 1,682
Median Home Value: $54,000
Median Income: $34,609
Unemployment Rate: 19.8%
8. Thomson
Population: 1,526
Median Home Value: $122,300
Median Income: $54,063
Unemployment Rate: 13.1%
9. Washington Park
/10
Population: 1,728
Median Home Value: $43,200
Median Income: $42,008
Unemployment Rate: 21.7%
10. Sheldon
/10
Population: 1,309
Median Home Value: $75,200
Median Income: $43,942
Unemployment Rate: 16.4%
Methodology: How do you decide if a small place in Illinois is lousy or not?
To rank the worst small towns to live in Illinois, we had to determine what criteria people like or dislike about a place. Assuming that people like low crime, solid education, things to do, and a stable economy isn’t a stretch.
We then analyzed the criteria using Saturday Night Science, the thinking you’d use at a bar. It seems like even your crazy Uncle would agree that a town with high crime is worse than a town with low crime; all else the same.
Using FBI crime data and the Census’s 2019-2023 American Community Survey, this is the criteria we used:
- Population Density (The lower, the worse)
- Highest Unemployment Rates
- Low housing costs (meaning there’s no demand)
- Adjusted Median Income (Median income adjusted for the cost of living)
- Education (Number of high school dropouts)
- High Crime
We looked at cities with populations between 1,000 and 5,000 people, of which there were many – 358 to be exact.
We get the crime numbers from the FBI, which gets them from the cities. Dropout numbers are based on the adult population, not just the current graduation rates of teenagers.
We base all our research on facts, which is meant as infotainment. We updated this article for 2025, which is our tenth time ranking the worst small places to live in Illinois.
There You Have It – The Worst Small Towns In Illinois
If you’re analyzing teeny places in the Prairie State with the worst economic situations, where there’s high crime and there’s not a lot to do, this is an accurate list.
The worst small towns in Illinois are Cairo, Madison, Ina, Ford Heights, Grayville, De Pue, Venice, Thomson, Washington Park, and Sheldon.
If you’re curious enough, here are the best small towns to live in Illinois, according to science:
- Third Lake (Pop. 1,203)
- Kenilworth (Pop. 2,543)
- Prestbury (Pop. 2,174)
For more Illinois reading, check out:
Worst Small Towns In Illinois
| Rank | Town | Population | Unemployment Rate | Home Value | Median Income |
|---|---|---|---|---|---|
| 1 | Cairo | 1,699 | 17.5% | $28,200 | $35,493 |
| 2 | Madison | 2,788 | 21.4% | $51,200 | $44,181 |
| 3 | Ina | 1,600 | 13.7% | $88,500 | $46,250 |
| 4 | Ford Heights | 1,587 | 11.0% | $48,000 | $34,323 |
| 5 | Grayville | 1,515 | 6.8% | $76,000 | $47,308 |
| 6 | De Pue | 1,594 | 7.0% | $63,600 | $56,176 |
| 7 | Venice | 1,682 | 19.8% | $54,000 | $34,609 |
| 8 | Thomson | 1,526 | 13.1% | $122,300 | $54,063 |
| 9 | Washington Park | 1,728 | 21.7% | $43,200 | $42,008 |
| 10 | Sheldon | 1,309 | 16.4% | $75,200 | $43,942 |
| 11 | Fairmont City | 2,354 | 0.6% | $65,500 | $43,333 |
| 12 | Louisville | 1,288 | 10.6% | $86,300 | $44,318 |
| 13 | Hartford | 1,456 | 6.3% | $65,800 | $39,364 |
| 14 | Zeigler | 1,325 | 10.4% | $52,000 | $39,148 |
| 15 | Sumner | 2,229 | 11.7% | $61,200 | $51,458 |
| 16 | Tilton | 2,537 | 7.9% | $71,700 | $53,246 |
| 17 | Phoenix | 1,284 | 23.3% | $86,300 | $25,703 |
| 18 | Dixmoor | 2,962 | 6.8% | $75,500 | $39,861 |
| 19 | Robbins | 4,956 | 17.4% | $114,200 | $37,594 |
| 20 | Bridgeport | 1,819 | 11.9% | $57,500 | $50,284 |
| 21 | White Hall | 2,354 | 5.1% | $72,500 | $52,685 |
| 22 | Norris City | 1,613 | 14.2% | $80,800 | $37,778 |
| 23 | South Roxana | 2,180 | 6.1% | $87,200 | $56,364 |
| 24 | Vienna | 2,115 | 0.6% | $77,400 | $39,471 |
| 25 | Caseyville | 4,170 | 5.7% | $94,900 | $57,919 |
| 26 | Carbon Cliff | 2,248 | 6.5% | $124,600 | $55,000 |
| 27 | Griggsville | 1,272 | 2.9% | $84,400 | $37,457 |
| 28 | Onarga | 1,362 | 9.7% | $96,500 | $64,286 |
| 29 | Marissa | 1,133 | 20.0% | $87,000 | $48,393 |
| 30 | Cambria | 1,271 | 8.2% | $140,100 | $51,042 |
| 31 | Barry | 1,442 | 5.3% | $88,600 | $66,017 |
| 32 | Cobden | 1,064 | 3.5% | $106,400 | $42,250 |
| 33 | Warsaw | 1,511 | 13.8% | $90,700 | $58,074 |
| 34 | Hodgkins | 1,766 | 2.1% | $39,200 | $63,056 |
| 35 | Lawrenceville | 4,241 | 6.5% | $77,600 | $44,885 |
| 36 | Gibson City | 3,609 | 8.3% | $138,400 | $47,104 |
| 37 | Christopher | 2,413 | 6.6% | $68,800 | $42,244 |
| 38 | Savanna | 2,851 | 5.8% | $75,000 | $46,094 |
| 39 | Havana | 3,176 | 8.4% | $95,200 | $55,428 |
| 40 | Watseka | 4,630 | 6.8% | $104,400 | $42,794 |
| 41 | Anna | 4,222 | 6.5% | $128,200 | $36,238 |
| 42 | Central City | 1,123 | 4.8% | $43,900 | $47,750 |
| 43 | De Soto | 1,701 | 7.3% | $88,800 | $52,131 |
| 44 | Chatsworth | 1,161 | 8.1% | $103,000 | $61,731 |
| 45 | St. Elmo | 1,401 | 4.5% | $80,300 | $47,115 |
| 46 | Mcleansboro | 2,750 | 1.0% | $72,200 | $46,589 |
| 47 | Casey | 2,258 | 9.4% | $86,000 | $48,631 |
| 48 | Benld | 1,535 | 5.3% | $83,000 | $45,667 |
| 49 | Milford | 1,136 | 5.1% | $65,300 | $45,000 |
| 50 | Carrier Mills | 1,702 | 5.5% | $57,300 | $50,269 |
| 51 | Sparta | 4,070 | 9.9% | $120,500 | $63,401 |
| 52 | Lewistown | 1,828 | 10.6% | $84,600 | $49,022 |
| 53 | Oblong | 1,617 | 4.8% | $78,400 | $52,702 |
| 54 | Percy | 1,014 | 0.2% | $88,500 | $42,813 |
| 55 | Toulon | 1,390 | 3.5% | $96,100 | $51,316 |
| 56 | Martinsville | 1,212 | 4.4% | $73,600 | $65,000 |
| 57 | Roodhouse | 1,662 | 11.9% | $70,300 | $51,667 |
| 58 | Lovington | 1,120 | 4.3% | $90,400 | $54,394 |
| 59 | Flora | 4,860 | 6.3% | $78,400 | $50,588 |
| 60 | Albion | 2,107 | 9.2% | $93,000 | $56,172 |
| 61 | South Chicago Heights | 3,934 | 6.7% | $136,000 | $56,250 |
| 62 | Fairmont | 2,409 | 8.7% | $147,400 | $59,244 |
| 63 | Sheridan | 2,610 | 7.5% | $183,200 | $73,214 |
| 64 | Rockdale | 2,598 | 8.4% | $183,500 | $56,799 |
| 65 | Dupo | 3,914 | 5.6% | $109,000 | $57,899 |
| 66 | Royalton | 1,076 | 0.0% | $51,900 | $49,625 |
| 67 | Bushnell | 2,763 | 6.3% | $69,100 | $55,368 |
| 68 | Minonk | 1,909 | 7.3% | $120,600 | $62,000 |
| 69 | Johnston City | 3,351 | 3.9% | $84,500 | $46,629 |
| 70 | Fairfield | 4,658 | 3.2% | $91,800 | $41,026 |
| 71 | Preston Heights | 2,318 | 8.9% | $141,400 | $51,970 |
| 72 | Burnham | 3,978 | 9.9% | $146,400 | $55,708 |
| 73 | Eldorado | 3,762 | 1.3% | $68,600 | $39,766 |
| 74 | Arthur | 2,024 | 5.7% | $146,200 | $52,115 |
| 75 | Chrisman | 1,352 | 15.7% | $82,200 | $58,250 |
| 76 | Girard | 1,740 | 7.9% | $96,300 | $40,250 |
| 77 | Rushville | 2,668 | 7.0% | $91,000 | $57,589 |
| 78 | Polo | 2,495 | 4.7% | $108,500 | $52,976 |
| 79 | Roxana | 1,626 | 4.9% | $101,800 | $66,125 |
| 80 | Winchester | 1,543 | 4.9% | $96,000 | $54,286 |
| 81 | Gilman | 1,576 | 5.4% | $108,900 | $65,729 |
| 82 | Grandview | 1,077 | 7.3% | $72,900 | $48,906 |
| 83 | Wenona | 1,006 | 1.1% | $88,900 | $40,921 |
| 84 | Southern View | 1,838 | 8.2% | $104,700 | $53,774 |
| 85 | Astoria | 1,094 | 4.3% | $63,700 | $49,345 |
| 86 | Jonesboro | 1,912 | 4.7% | $114,400 | $58,309 |
| 87 | La Harpe | 1,085 | 3.4% | $84,200 | $49,028 |
| 88 | Earlville | 2,015 | 6.0% | $127,300 | $62,763 |
| 89 | Greenup | 1,678 | 2.9% | $90,900 | $48,516 |
| 90 | Shawneetown | 1,167 | 4.1% | $80,400 | $51,089 |
| 91 | Hillcrest | 1,679 | 5.6% | $151,900 | $77,609 |
| 92 | Galva | 2,543 | 2.2% | $77,800 | $55,446 |
| 93 | Virginia | 1,491 | 4.4% | $93,500 | $51,818 |
| 94 | Sesser | 1,919 | 5.5% | $79,800 | $52,326 |
| 95 | Thornton | 1,876 | 7.3% | $146,600 | $61,111 |
| 96 | Beckemeyer | 1,024 | 10.8% | $112,500 | $64,231 |
| 97 | Assumption | 1,117 | 11.8% | $72,100 | $55,764 |
| 98 | Wayne City | 1,050 | 3.5% | $108,600 | $58,208 |
| 99 | Amboy | 2,396 | 5.4% | $132,600 | $76,667 |
| 100 | Arcola | 2,867 | 6.3% | $122,800 | $85,697 |
See how many empty homes you can find in Grand Tower today(good luck- extremely few); it is a very tight-knit community where we go above and beyond to help our neighbors. It is beautiful, the people are great, and while we may not be wealthy, we have it a dozen times better than anyone living in a bigger town.
AMEN!
Bud Tappan, your opinion is bs. You don’t know anything about what your talking about. Sure every town has their drunks , unemployed, and dropouts. But you took this to the next level with your disrespect. I know personally 6 of these towns on your list of 10 and they are great places and I was born and raised in one further down on your list. I’m guessing that you either live in Chicago or some other miserable city. These towns you call horrible places, are really quiet farm towns, that provide crops on a major scale for this state and country. We don’t get large grants every year or every decade. So yeah there are no jobs. But Chicago sure does they get all the handouts.
Take your opinion and shove it up your ass city bitch.
Yeah, what Micah said!
I bet you guys think everything south of Chicago is crap because it’s not glamorous. Everyone in Illinois knows Chicago is a FAR different place from downstate, or anywhere outside of Cook County for that matter. I live in Chicagoland and I’d hazard a guess Chicago has more drug dealers, prostitutes, and criminals than any one of these communities. Maybe if you knew the people of the communities you write arbitrarily about you’d think about what you write.
Oh, and “opinions based on data”? That’s a load of steaming bull.
BOOM!
I am proud of the little town of Gorham, from which I graduated from High School. I have shown many people where I came from, on google maps. A lot of people I have had the privilege of meeting over the years told me how lucky I was to grow up in a farming community. The area landscape is one of the most beautiful I have seen. Neighbors were not close by but they were awesome people, and they treated my Grandparents with respect and love. I have lived within City limits, but I would take the Country Road any day.
I don’t live in any of these towns/villages/burgs, but have been to most of them…and EVERYONE of them would be 10 times better to live in than ANYWHERE in Crook, oops, Cook county!!!!
I personally consider low population density to be a major positive. This usually means larger lots and fewer people around! Most of these are actually rather nice places to live, and those low property values mean a normal person can actually own a nice home and still afford to eat. I myself live in a slightly larger small town and love it. By the way, there is no such place as Old Shawne. I assume you mean Old Shawneetown, one of the oldest communities in the state which has the unfortunate habit of flooding occasionally, which is why they established a new Shawneetown a couple of miles west on higher ground.