
Most Americans have never been to small town Massachusetts. However, as the Bay Stater who live there know, small town Massachusetts is an awesome place to call home.
But is it all roses? Definitely not. Just like any other state, Massachusetts has its trouble spots. This article aims to determine, using Saturday Night Science, the absolute worst small towns to live in the Bay State. Don’t freak out, we will use data to show which places have high crime, poverty, and unemployment.
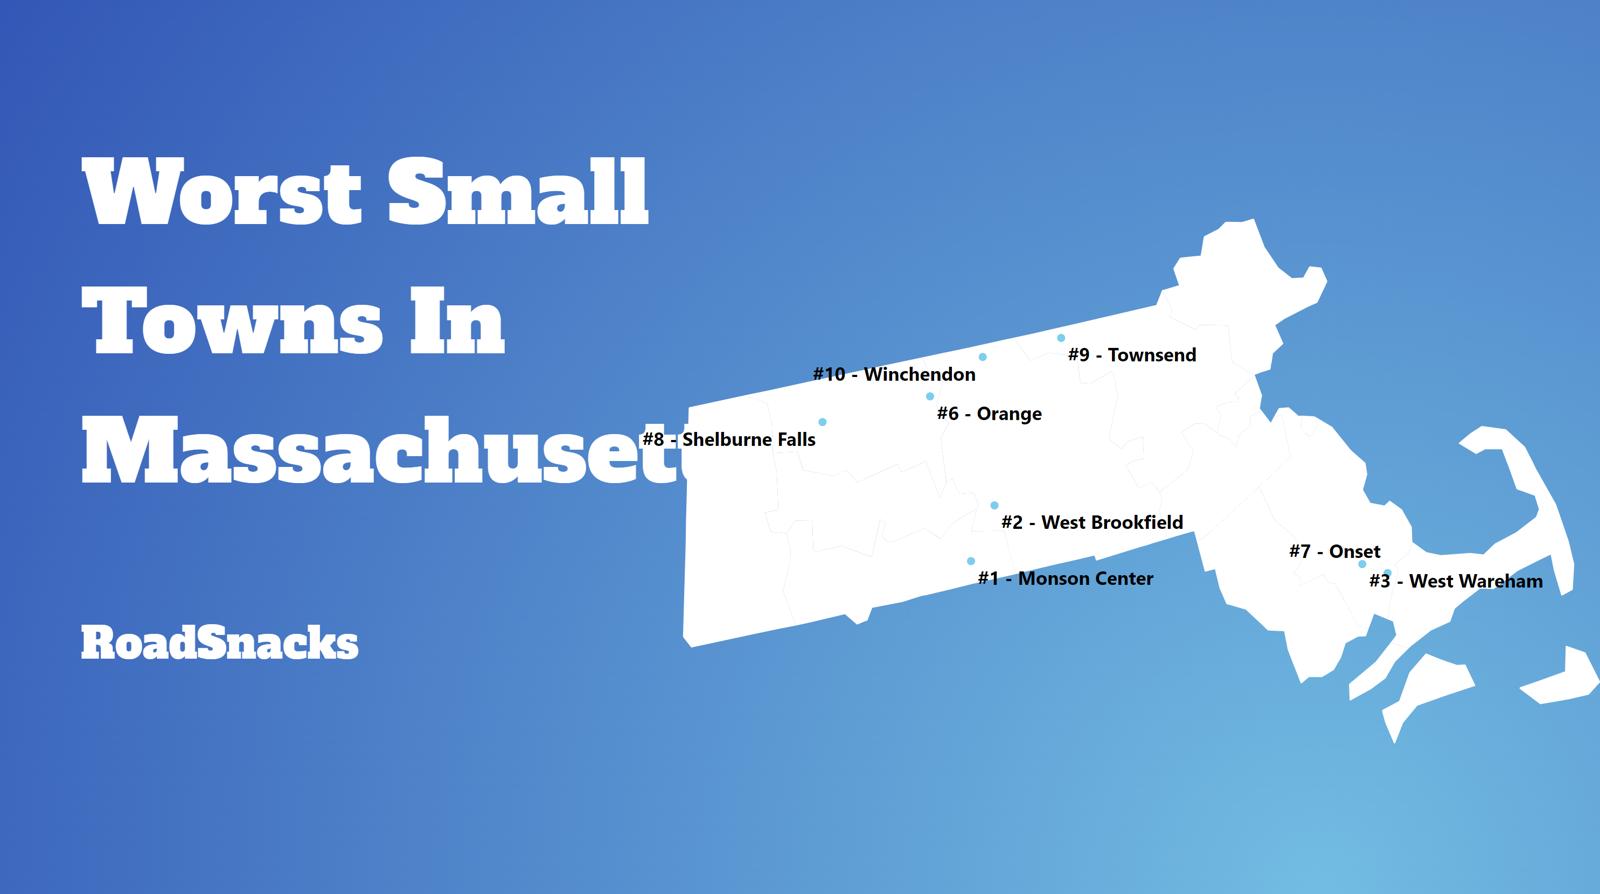
After analyzing more than 104 of Massachusetts’s smallest cities, we came up with this list as the 10 worst small towns in Massachusetts where you’d never want to live:
Table Of Contents: Top Ten | Methodology | Summary | Table
These are the worst small towns in Massachusetts for 2025:
- West Wareham
- Monson Center
- Orange
- Baldwinville
- Shelburne Falls
- Townsend
- West Brookfield
- Winchendon
- Smith Mills
- Dennis Port
So what is the worst small town to call home in Massachusetts for 2025? According to the most recent census data, West Wareham is the worst small town to live in Massachusetts.
While many of these small towns have seen better days, they have wonderful communities and people. This report in no way means to knock the folks that call towns like West Wareham home. Everyone
Read on below to see how we crunched the numbers, or scroll to the bottom to see how your town ranked.
And if you already know about the small towns, check out the best places to live in Massachusetts or the worst places to live in Massachusetts.
If you’re looking for something more national, check out the worst cities in America or the worst states in America.
The 10 Worst Small Towns In Massachusetts For 2025
1. West Wareham
/10
Population: 2,776
Median Home Value: $204,200
Median Income: $55,900
Unemployment Rate: 11.4%
2. Monson Center
/10
Population: 1,794
Median Home Value: $279,500
Median Income: $58,603
Unemployment Rate: 16.6%
3. Orange
/10
Population: 3,793
Median Home Value: $217,200
Median Income: $53,014
Unemployment Rate: 14.1%
4. Baldwinville
/10
Population: 2,454
Median Home Value: $284,900
Median Income: $56,957
Unemployment Rate: 21.2%
5. Shelburne Falls
/10
Population: 1,755
Median Home Value: $296,000
Median Income: $52,604
Unemployment Rate: 7.2%
6. Townsend
/10
Population: 1,082
Median Home Value: $344,400
Median Income: $56,726
Unemployment Rate: 2.2%
7. West Brookfield
/10
Population: 1,518
Median Home Value: $282,900
Median Income: $59,734
Unemployment Rate: 9.1%
8. Winchendon
/10
Population: 4,407
Median Home Value: $258,300
Median Income: $67,188
Unemployment Rate: 6.2%
9. Smith Mills
/10
Population: 4,467
Median Home Value: $384,600
Median Income: $56,250
Unemployment Rate: 6.4%
10. Dennis Port
/10
Population: 3,439
Median Home Value: $450,500
Median Income: $61,974
Unemployment Rate: 7.2%
Methodology: How do you decide if a small place in Massachusetts is lousy or not?
To rank the worst small towns to live in Massachusetts, we had to determine what criteria people like or dislike about a place. Assuming that people like low crime, solid education, things to do, and a stable economy isn’t a stretch.
We then analyzed the criteria using Saturday Night Science, the thinking you’d use at a bar. It seems like even your crazy Uncle would agree that a town with high crime is worse than a town with low crime; all else the same.
Using FBI crime data and the Census’s 2019-2023 American Community Survey, this is the criteria we used:
- Population Density (The lower, the worse)
- Highest Unemployment Rates
- Low housing costs (meaning there’s no demand)
- Adjusted Median Income (Median income adjusted for the cost of living)
- Education (Number of high school dropouts)
- High Crime
We looked at cities with populations between 1,000 and 5,000 people, of which there were many – 104 to be exact.
We get the crime numbers from the FBI, which gets them from the cities. Dropout numbers are based on the adult population, not just the current graduation rates of teenagers.
We base all our research on facts, which is meant as infotainment. We updated this article for 2025, which is our tenth time ranking the worst small places to live in Massachusetts.
There You Have It – The Worst Small Towns In Massachusetts
If you’re analyzing teeny places in the Bay State with the worst economic situations, where there’s high crime and there’s not a lot to do, this is an accurate list.
The worst small towns in Massachusetts are West Wareham, Monson Center, Orange, Baldwinville, Shelburne Falls, Townsend, West Brookfield, Winchendon, Smith Mills, and Dennis Port.
If you’re curious enough, here are the best small towns to live in Massachusetts, according to science:
- Sagamore (Pop. 3,958)
- Topsfield (Pop. 2,573)
- Hopkinton (Pop. 3,142)
For more Massachusetts reading, check out:
Worst Small Towns In Massachusetts
| Rank | Town | Population | Unemployment Rate | Home Value | Median Income |
|---|---|---|---|---|---|
| 1 | West Wareham | 2,776 | 11.4% | $204,200 | $55,900 |
| 2 | Monson Center | 1,794 | 16.6% | $279,500 | $58,603 |
| 3 | Orange | 3,793 | 14.1% | $217,200 | $53,014 |
| 4 | Baldwinville | 2,454 | 21.2% | $284,900 | $56,957 |
| 5 | Shelburne Falls | 1,755 | 7.2% | $296,000 | $52,604 |
| 6 | Townsend | 1,082 | 2.2% | $344,400 | $56,726 |
| 7 | West Brookfield | 1,518 | 9.1% | $282,900 | $59,734 |
| 8 | Winchendon | 4,407 | 6.2% | $258,300 | $67,188 |
| 9 | Smith Mills | 4,467 | 6.4% | $384,600 | $56,250 |
| 10 | Dennis Port | 3,439 | 7.2% | $450,500 | $61,974 |
| 11 | Devens | 1,871 | 4.4% | $464,000 | $113,125 |
| 12 | North Plymouth | 4,458 | 16.5% | $456,600 | $71,205 |
| 13 | North Eastham | 1,958 | 10.2% | $641,200 | $80,375 |
| 14 | Holland | 1,313 | 3.8% | $281,000 | $83,382 |
| 15 | Millers Falls | 1,081 | 5.5% | $222,600 | $63,646 |
| 16 | North Brookfield | 2,477 | 4.0% | $235,000 | $75,956 |
| 17 | Groton | 1,571 | 5.1% | $736,800 | $1,000 |
| 18 | South Ashburnham | 1,174 | 0.0% | $323,400 | $82,006 |
| 19 | Pepperell | 1,887 | 6.4% | $399,700 | $76,196 |
| 20 | Wilbraham | 4,247 | 4.1% | $361,600 | $88,409 |
| 21 | Belchertown | 2,299 | 1.1% | $331,500 | $68,393 |
| 22 | North Westport | 4,995 | 2.0% | $389,300 | $85,120 |
| 23 | Acushnet Center | 2,792 | 6.7% | $313,100 | $69,159 |
| 24 | Turners Falls | 3,949 | 3.0% | $235,500 | $56,729 |
| 25 | South Lancaster | 1,991 | 17.1% | $370,200 | $104,745 |
| 26 | Marshfield | 4,698 | 5.1% | $646,400 | $99,537 |
| 27 | Onset | 1,561 | 18.2% | $415,500 | $1,000 |
| 28 | Granby | 1,127 | 4.7% | $299,700 | $126,136 |
| 29 | Ocean Grove | 3,099 | 8.4% | $337,800 | $97,109 |
| 30 | Lenox | 1,809 | 0.0% | $411,700 | $58,920 |
| 31 | Fiskdale | 2,564 | 8.5% | $359,200 | $92,273 |
| 32 | Northwest Harwich | 4,205 | 10.4% | $596,800 | $89,063 |
| 33 | Ayer | 3,012 | 2.9% | $417,300 | $81,286 |
| 34 | Falmouth | 3,996 | 3.4% | $745,900 | $68,267 |
| 35 | Great Barrington | 1,953 | 2.2% | $459,000 | $57,071 |
| 36 | Wareham Center | 2,737 | 1.1% | $411,500 | $88,424 |
| 37 | Bellingham | 4,939 | 10.5% | $385,300 | $88,731 |
| 38 | Provincetown | 3,466 | 8.5% | $786,900 | $123,456 |
| 39 | South Deerfield | 1,822 | 5.1% | $419,100 | $97,250 |
| 40 | Weweantic | 1,384 | 14.0% | $418,700 | $1,000 |
| 41 | Lee | 1,522 | 4.3% | $265,900 | $70,306 |
| 42 | Chatham | 1,614 | 8.5% | $1,550,000 | $82,269 |
| 43 | South Dennis | 3,190 | 3.4% | $454,400 | $86,500 |
| 44 | Norton Center | 2,526 | 3.6% | $418,400 | $114,051 |
| 45 | Hopedale | 4,126 | 4.4% | $399,100 | $111,016 |
| 46 | Harwich Port | 2,011 | 3.7% | $654,900 | $64,813 |
| 47 | North Lakeville | 3,602 | 2.1% | $488,400 | $88,750 |
| 48 | Rutland | 1,796 | 4.8% | $357,700 | $102,885 |
| 49 | Harwich Center | 1,620 | 3.4% | $546,600 | $76,944 |
| 50 | Buzzards Bay | 2,941 | 2.4% | $453,500 | $95,847 |
| 51 | Raynham Center | 4,871 | 4.9% | $510,800 | $120,913 |
| 52 | Sandwich | 2,976 | 4.6% | $511,000 | $108,583 |
| 53 | East Dennis | 3,685 | 4.5% | $658,500 | $100,504 |
| 54 | East Brookfield | 1,349 | 2.2% | $337,500 | $70,625 |
| 55 | West Falmouth | 1,655 | 10.3% | $734,000 | $115,735 |
| 56 | Mattapoisett Center | 2,573 | 3.0% | $649,200 | $99,864 |
| 57 | Orleans | 1,618 | 0.0% | $542,500 | $76,768 |
| 58 | East Pepperell | 1,984 | 4.4% | $415,200 | $111,736 |
| 59 | Teaticket | 1,728 | 1.4% | $488,700 | $85,669 |
| 60 | West Chatham | 1,337 | 6.0% | $743,100 | $135,199 |
| 61 | Brewster | 1,711 | 6.7% | $702,000 | $75,481 |
| 62 | Forestdale | 3,716 | 2.7% | $462,500 | $105,368 |
| 63 | Lunenburg | 2,163 | 1.9% | $439,600 | $112,422 |
| 64 | Millis-Clicquot | 4,479 | 2.2% | $487,700 | $116,324 |
| 65 | Rockport | 4,795 | 8.8% | $694,300 | $86,250 |
| 66 | White Island Shores | 1,880 | 6.7% | $366,800 | $104,940 |
| 67 | Littleton Common | 2,838 | 7.6% | $551,800 | $129,347 |
| 68 | West Dennis | 2,586 | 0.7% | $580,900 | $93,958 |
| 69 | Williamstown | 4,352 | 1.9% | $436,900 | $82,917 |
| 70 | Hatfield | 1,361 | 1.4% | $460,300 | $109,625 |
| 71 | East Sandwich | 3,597 | 2.9% | $651,900 | $128,750 |
| 72 | Westborough | 4,234 | 2.5% | $540,600 | $100,037 |
| 73 | North Pembroke | 3,924 | 1.9% | $521,400 | $177,703 |
| 74 | Pocasset | 2,375 | 0.9% | $607,700 | $84,544 |
| 75 | Hanson | 2,002 | 6.0% | $490,700 | $115,109 |
| 76 | Sturbridge | 2,277 | 0.0% | $404,700 | $129,413 |
| 77 | North Seekonk | 2,903 | 6.2% | $417,300 | $110,541 |
| 78 | Ipswich | 4,806 | 3.4% | $570,500 | $92,969 |
| 79 | Bourne | 1,765 | 6.2% | $521,100 | $125,366 |
| 80 | Boxford | 2,325 | 4.5% | $977,400 | $238,375 |
| 81 | Shirley | 1,256 | 8.1% | $378,700 | $1,000 |
| 82 | Dennis | 1,903 | 3.1% | $835,300 | $127,292 |
| 83 | Monument Beach | 3,067 | 1.6% | $540,600 | $86,953 |
| 84 | Marion Center | 1,159 | 5.9% | $622,600 | $180,130 |
| 85 | Upton | 2,985 | 5.5% | $474,600 | $109,925 |
| 86 | East Douglas | 2,842 | 1.6% | $400,900 | $141,042 |
| 87 | Ocean Bluff-Brant Rock | 4,695 | 3.7% | $483,600 | $118,625 |
| 88 | Duxbury | 1,620 | 4.4% | $1,386,200 | $126,750 |
| 89 | Vineyard Haven | 2,672 | 0.9% | $815,000 | $73,917 |
| 90 | Nahant | 3,328 | 5.1% | $686,000 | $111,004 |
| 91 | Mashpee Neck | 1,071 | 4.2% | $578,400 | $131,250 |
| 92 | North Falmouth | 2,558 | 6.0% | $656,400 | $133,571 |
| 93 | Dover | 2,386 | 13.2% | $1,230,600 | $250,001 |
| 94 | Marshfield Hills | 2,121 | 0.0% | $750,600 | $210,096 |
| 95 | Cordaville | 3,076 | 4.1% | $730,600 | $161,023 |
| 96 | Housatonic | 1,054 | 0.0% | $429,200 | $86,920 |
| 97 | Hanscom Afb | 1,745 | 1.1% | $1,000 | $101,194 |
| 98 | South Duxbury | 3,272 | 4.6% | $987,500 | $206,111 |
| 99 | The Pinehills | 4,988 | 3.9% | $669,100 | $121,792 |
| 100 | Essex | 1,775 | 1.4% | $774,400 | $156,094 |