
The unfortunate fact of the matter is that some places in the Show Me State have a larger percent of their population that never graduated from high school.
While the emphasis on going to college might be overblown, the fact is that not graduating from high school puts you at a significant disadvantage on average. Educational attainment might not be the best way to measure one person’s intelligence, but it does shine a light on the state.
We will use Saturday Night Science to determine what places in Missouri have the highest percentage of adults without a high school degree.
A recent study we published found that Missouri is the 27th smartest state in the United States, with an average IQ of 99.
But that doesn’t mean that a few cities in Missouri are a bit slower than others due to a lack of basic education.
Table Of Contents: Top Ten | Methodology | Summary | Table
The 10 Dumbest Places In Missouri
Don’t freak out.
Some places are just smarter than others, but that says nothing about the character of the people living there. It’s another data point a real estate agent would never tell you.
For this ranking, we only looked at cities with populations greater than 5,000, leaving us 124 cities in Missouri to rank. You can take a look at the data below.
For more Missouri reading, check out:
The 10 Dumbest Places In Missouri For 2025

/10
% Adult High School Dropout: 21.0%
% Highly Educated: 8.0%
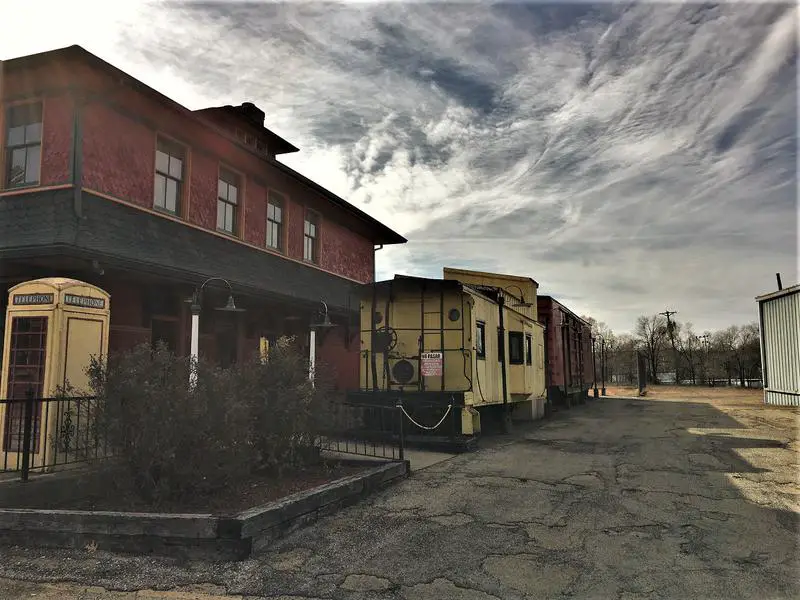
More on Bonne Terre: Data

/10
% Adult High School Dropout: 19.0%
% Highly Educated: 10.0%
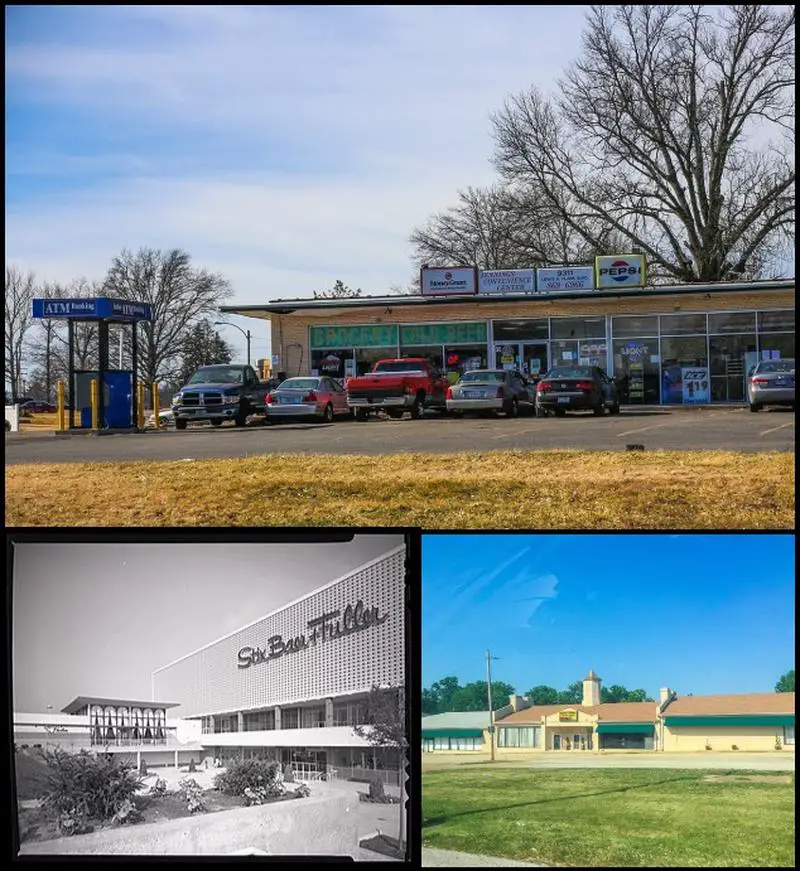
More on Jennings: Data

/10

/10

/10
% Adult High School Dropout: 19.0%
% Highly Educated: 13.0%
More on Caruthersville: Data

/10
% Adult High School Dropout: 20.0%
% Highly Educated: 15.0%
More on Kennett: Data

/10
/10
% Adult High School Dropout: 14.0%
% Highly Educated: 14.0%
More on St. John: Data

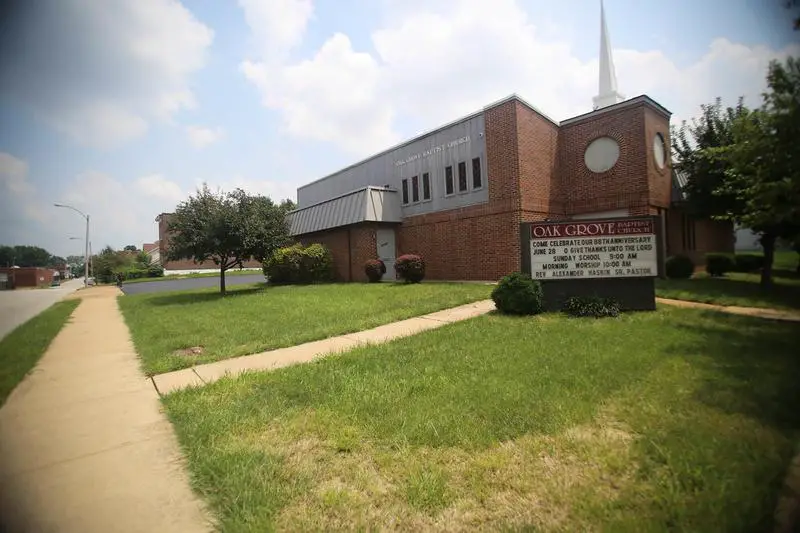
/10
% Adult High School Dropout: 14.0%
% Highly Educated: 15.0%
More on Oak Grove: Data

/10
% Adult High School Dropout: 16.0%
% Highly Educated: 16.0%
More on Poplar Bluff: Data
Methodology: How we determined the dumbest cities in the Show Me State
We realize that formal education is only part of it when it comes to being intelligent, but on the other hand, knowing the difference between they’re, their, and there is always going to make you look pretty stupid.
So, we used Saturday Night Science to narrow down our criteria to focus on a city’s educational opportunities and what percentage of the population takes advantage of those opportunities.
In short, we came up with these criteria to determine the dumbest cities in Missouri:
- % of the city’s population with less than a high school education (Age 25+)
- % of city’s population with a college degree (Age 25+)
We got the data from the U.S. Census 2019-2023 American Community Survey.
Then, our algorithm generates a rank for each place in these categories. After crunching all the numbers, a ranking of the cities in Missouri from dumbest to brightest.
For this ranking, we used every Missouri city with at least 5,000 residents. We updated this article for 2025, and it’s our tenth time ranking the dumbest cities in Missouri.
There You Have It – Now That You’re Asleep
If you’re measuring the locations in Missouri where there are a high number of dropouts and adults who never received a formal education, this is an accurate ranking.
The dumbest cities in Missouri are Bonne Terre, Jennings, Aurora, Monett, Caruthersville, Kennett, De Soto, St. John, Oak Grove, and Poplar Bluff.
If you’re also curious enough, here are the smartest places in Missouri, according to science:
- Ladue
- Glendale
- Chesterfield
For more Missouri reading, check out:
- Best Places To Live In Missouri
- Cheapest Places To Live In Missouri
- Most Dangerous Cities in Missouri
- Richest Cities In Missouri
- Safest Places In Missouri
- Worst Places To Live In Missouri
- Most Expensive Places To Live In Missouri
Dumbest Cities In Missouri For 2025
| Rank | City | Population | % Adult High School Dropout | % Highly Educated |
|---|---|---|---|---|
| 1 | Bonne Terre, MO | 6,773 | 21.0% | 8.0% |
| 2 | Jennings, MO | 12,900 | 19.0% | 10.0% |
| 3 | Aurora, MO | 7,331 | 19.0% | 12.0% |
| 4 | Monett, MO | 9,734 | 17.0% | 12.0% |
| 5 | Caruthersville, MO | 5,426 | 19.0% | 13.0% |
| 6 | Kennett, MO | 10,236 | 20.0% | 15.0% |
| 7 | De Soto, MO | 6,452 | 13.0% | 11.0% |
| 8 | St. John, MO | 6,562 | 14.0% | 14.0% |
| 9 | Oak Grove, MO | 8,477 | 14.0% | 15.0% |
| 10 | Poplar Bluff, MO | 16,243 | 16.0% | 16.0% |
| 11 | West Plains, MO | 12,341 | 16.0% | 17.0% |
| 12 | Moberly, MO | 13,634 | 13.0% | 15.0% |
| 13 | Chillicothe, MO | 9,129 | 14.0% | 17.0% |
| 14 | Cameron, MO | 8,721 | 11.0% | 12.0% |
| 15 | Farmington, MO | 17,999 | 12.0% | 15.0% |
| 16 | Warrenton, MO | 8,870 | 11.0% | 14.0% |
| 17 | Sedalia, MO | 21,869 | 14.0% | 18.0% |
| 18 | Park Hills, MO | 8,667 | 12.0% | 16.0% |
| 19 | Trenton, MO | 5,542 | 13.0% | 17.0% |
| 20 | Carthage, MO | 15,513 | 25.0% | 23.0% |
| 21 | Berkeley, MO | 8,149 | 12.0% | 16.0% |
| 22 | Excelsior Springs, MO | 10,502 | 12.0% | 16.0% |
| 23 | Dexter, MO | 7,906 | 12.0% | 17.0% |
| 24 | Lebanon, MO | 15,157 | 13.0% | 19.0% |
| 25 | Mexico, MO | 11,487 | 11.0% | 15.0% |
| 26 | Harrisonville, MO | 10,002 | 11.0% | 16.0% |
| 27 | Hannibal, MO | 16,825 | 13.0% | 21.0% |
| 28 | Clinton, MO | 9,047 | 10.0% | 15.0% |
| 29 | Neosho, MO | 12,857 | 15.0% | 24.0% |
| 30 | Fulton, MO | 12,611 | 15.0% | 25.0% |
| 31 | Perryville, MO | 8,530 | 12.0% | 21.0% |
| 32 | Richmond, MO | 5,979 | 8.0% | 12.0% |
| 33 | Bellefontaine Neighbors, MO | 10,562 | 11.0% | 18.0% |
| 34 | Marshfield, MO | 7,599 | 11.0% | 19.0% |
| 35 | Sullivan, MO | 6,355 | 10.0% | 19.0% |
| 36 | Pacific, MO | 7,299 | 10.0% | 19.0% |
| 37 | St. Joseph, MO | 71,542 | 11.0% | 23.0% |
| 38 | Black Jack, MO | 6,606 | 13.0% | 27.0% |
| 39 | Savannah, MO | 5,062 | 11.0% | 23.0% |
| 40 | Nevada, MO | 7,998 | 10.0% | 19.0% |
| 41 | St. Ann, MO | 12,865 | 9.0% | 18.0% |
| 42 | Festus, MO | 12,965 | 11.0% | 22.0% |
| 43 | Overland, MO | 15,762 | 12.0% | 26.0% |
| 44 | Sikeston, MO | 16,231 | 12.0% | 25.0% |
| 45 | Pevely, MO | 6,037 | 9.0% | 18.0% |
| 46 | Marshall, MO | 13,699 | 14.0% | 31.0% |
| 47 | Ferguson, MO | 18,350 | 10.0% | 22.0% |
| 48 | Troy, MO | 13,467 | 6.0% | 13.0% |
| 49 | Independence, MO | 121,944 | 9.0% | 22.0% |
| 50 | Boonville, MO | 7,682 | 10.0% | 24.0% |
| 51 | Bolivar, MO | 10,996 | 11.0% | 26.0% |
| 52 | Macon, MO | 5,457 | 9.0% | 22.0% |
| 53 | Grandview, MO | 25,821 | 10.0% | 25.0% |
| 54 | Arnold, MO | 20,884 | 9.0% | 24.0% |
| 55 | Peculiar, MO | 5,815 | 8.0% | 22.0% |
| 56 | Raytown, MO | 29,593 | 8.0% | 23.0% |
| 57 | Florissant, MO | 51,915 | 8.0% | 23.0% |
| 58 | Joplin, MO | 52,218 | 9.0% | 27.0% |
| 59 | Union, MO | 12,560 | 8.0% | 26.0% |
| 60 | Branson, MO | 12,760 | 9.0% | 29.0% |
| 61 | Belton, MO | 24,618 | 7.0% | 25.0% |
| 62 | St. Robert, MO | 5,327 | 9.0% | 33.0% |
| 63 | Hazelwood, MO | 25,214 | 8.0% | 29.0% |
| 64 | Springfield, MO | 169,432 | 8.0% | 30.0% |
| 65 | Bridgeton, MO | 11,372 | 9.0% | 36.0% |
| 66 | Grain Valley, MO | 15,967 | 6.0% | 28.0% |
| 67 | Ozark, MO | 21,953 | 8.0% | 33.0% |
| 68 | St. Louis, MO | 293,109 | 9.0% | 40.0% |
| 69 | Gladstone, MO | 27,069 | 7.0% | 31.0% |
| 70 | Republic, MO | 19,233 | 5.0% | 27.0% |
| 71 | Smithville, MO | 10,552 | 6.0% | 30.0% |
| 72 | Washington, MO | 14,948 | 6.0% | 32.0% |
| 73 | Pleasant Hill, MO | 8,853 | 5.0% | 29.0% |
| 74 | Odessa, MO | 5,589 | 4.0% | 26.0% |
| 75 | Kirksville, MO | 17,493 | 8.0% | 38.0% |
| 76 | Jackson, MO | 15,532 | 6.0% | 35.0% |
| 77 | Cape Girardeau, MO | 40,047 | 8.0% | 37.0% |
| 78 | Maryville, MO | 10,556 | 4.0% | 31.0% |
| 79 | Rolla, MO | 20,144 | 6.0% | 36.0% |
| 80 | Willard, MO | 6,418 | 5.0% | 34.0% |
| 81 | Warrensburg, MO | 19,437 | 6.0% | 37.0% |
| 82 | Nixa, MO | 24,131 | 5.0% | 36.0% |
| 83 | Valley Park, MO | 6,817 | 7.0% | 45.0% |
| 84 | O’fallon, MO | 92,697 | 6.0% | 41.0% |
| 85 | Blue Springs, MO | 59,416 | 4.0% | 35.0% |
| 86 | St. Peters, MO | 58,200 | 5.0% | 39.0% |
| 87 | Greenwood, MO | 6,000 | 4.0% | 36.0% |
| 88 | St. Charles, MO | 71,048 | 6.0% | 44.0% |
| 89 | Wentzville, MO | 45,734 | 5.0% | 40.0% |
| 90 | Raymore, MO | 23,849 | 4.0% | 38.0% |
| 91 | Maryland Heights, MO | 27,981 | 5.0% | 51.0% |
| 92 | Waynesville, MO | 5,422 | 3.0% | 37.0% |
| 93 | Liberty, MO | 30,446 | 3.0% | 40.0% |
| 94 | Carl Junction, MO | 8,257 | 3.0% | 41.0% |
| 95 | Kearney, MO | 10,696 | 2.0% | 35.0% |
| 96 | Eureka, MO | 12,371 | 4.0% | 50.0% |
| 97 | Lake St. Louis, MO | 17,538 | 3.0% | 49.0% |
| 98 | Dardenne Prairie, MO | 13,137 | 3.0% | 52.0% |
| 99 | Columbia, MO | 127,200 | 4.0% | 57.0% |
| 100 | Battlefield, MO | 6,095 | 2.0% | 40.0% |
The drop out rate quoted for Carthage Mo is entirely inaccurate. In 2014, our graduation rate was greater than 93%. If you are going to label towns as dumb, perhaps you should do some accurate research.
Data is taken directly from the 2010-2014 american community survey for people ages 16-19. Don’t blame the messenger if you don’t like the data!
I’ve looked all over the link you shared and I can’t seem to find the data you quoted for teenage high school dropouts ages 16-18. Could you link it directly for us to see?
Because it’s ages 16-19 like it says in the article. You can create the query in American Fact Finder; it’s just specific so I can’t link directly to it. It would look something like this.
You should know that the ACS stands for the “American Community Survey 5-year Estimates.” The key word being “ESTIMATES”. The data you are using is NOT from the decennial census that attempts to survey all Americans. Rather, according to the United States Census Bureau’s own website, “We randomly sample addresses in every state, the District of Columbia, and Puerto Rico.” Again, a key word is “RANDOMLY”. Another key word is “SAMPLE”. Also found on the US Census Bureau’s site is the following, ” The ACS . . . is a survey sent to a small percentage of our population.” The key words are “SMALL PERCENTAGE”.
You fail to mention this fact to your readers. Many of your readers might not be aware of the difference between the 10 year census and the limited sample data taken from the ACS ESTIMATE.
If you fully read the stats it says adults with hs diploma % and % of hs drop outs. Has nothing to do with % who graduated. …. only thoes who dropped out….
Yea there are a lot of dumb cities in Missouri, and Iowa, and New York. It’s a reflection of our society overall. Especially when the writers of the article can’t assemble sentences.
FOUL!!! Bonne Terre and Desloge (pop 5000) SHARE a High School. You took the number of dropouts from our shared High School and divided it into Bonne Terre’s population giving you an incredibly inaccurate percentage. You make it sound like almost half the kids drop out. Do your research right before posting next time!!
North County High School is made up from kids from Bonne Terre, Desloge and Valle Mines area. Since the school is in Bonne Terre they are technically correct. Desloge is probably on par with Park Hills at #20.
FOUL! The data DOES NOT mention “Aurora High School” as stated on the “roadsnacks website”, but rather, only the limited “civilian population 16 to 19 years.” Of course, this population could include persons who had attended schools in another community, persons who were home schooled or who had never attended school after the mandatory legal age.
Frank due to your city’s lack of education our site is gonna have to assume that you are a drop out aswell and can not speak on the subject matter thanks again for your opinion.
The graduation rate for Carthage is totally inaccurate. I’m also curious as to whether the fact that Carthage has a sizeable adult Hispanic immigrant population who did not have the opportunity for secondary educational opportunities before coming to the US was factored in.
Carthage is now overrun with Mexican adults and children who do not speak English. Mainly due to the chicken/turkey plants hiring them illegally. They don’t want to become “Americanized”, so when schools tests the minimal English speaking students, they fail. Then they drop out.
A piece on being dumb with this many typos is something I would be ashamed to publish. Pot meet kettle.
The writer reveals his own low IQ by equating intelligence with education.
The lack of educational achievement certainly does not make a person “dumb.” There are many successful people who did not finish high school and certainly weren’t “dumb”. A short list follows. . .
Abraham Lincoln
Henry Ford
Thomas Edison
Walt Disney
Al Pacino
John D. Rockefeller, Sr.
Benjamin Franklin
Richard Branson
Louis Armstrong
Jim Carrey
Guys, the author even admitted that formal education doesn’t define whether or not a city is dumb. You’re making yourselves look worse for attacking the credibility of the study (even if it is basic) because the writer made typos. Most of the cities are very rural, and demographically speaking, the study isn’t inaccurate when you consider the dominating demographic of rural areas. Stop being butthurt.
Another way to view the situation:
10 cities in Missouri = dumb.
RoadSnacks = dumber.
Sam Sparkes = dumbest.
Another way to view the situation:
10 cities in Missouri = dumb.
RoadSnacks = dumber.
Sam Sparkes = dumbest.
Totally inaccurate and unnecessary article. Why waste our time? Attractive pictures though! If you have time to gather these facts, best for all if they are true. You had to have included the population of both prisons in our small community. Cameron’s population is 9,868. Of this number, 3,475 are prison inmates. Our graduation rate is 89% which is over the state’s average of 87%. If it’s going to be in writing…..get it right please!
Charleston (ranked 14th) is in the same position. About 1/3 of our city population is made of offenders housed in MoDOC’s Southeast Correctional Facility.
One of the dumbest listicles ever…
You forgot a town in the bottom. My town, Silex.