
Gayest places in Indiana research summary. We used Saturday Night Science to research the cities in Indiana with the highest percent of same-sex households for 2025. The data comes from the American Community Survey 2013-2018 vintage, which breaks down sex by household status. Unfortunately, the Census has stopped reporting at the city level, so this report reflects the most recent data.
-
The city with the highest rate of same-sex houesholds in Indiana is Chandler. 2.75% of households in Chandler are gay.
-
The city in Indiana with the most same-sex houesholds is Indianapolis with 2,131 gay households.
-
Indiana is the 31st most gay in the United States.
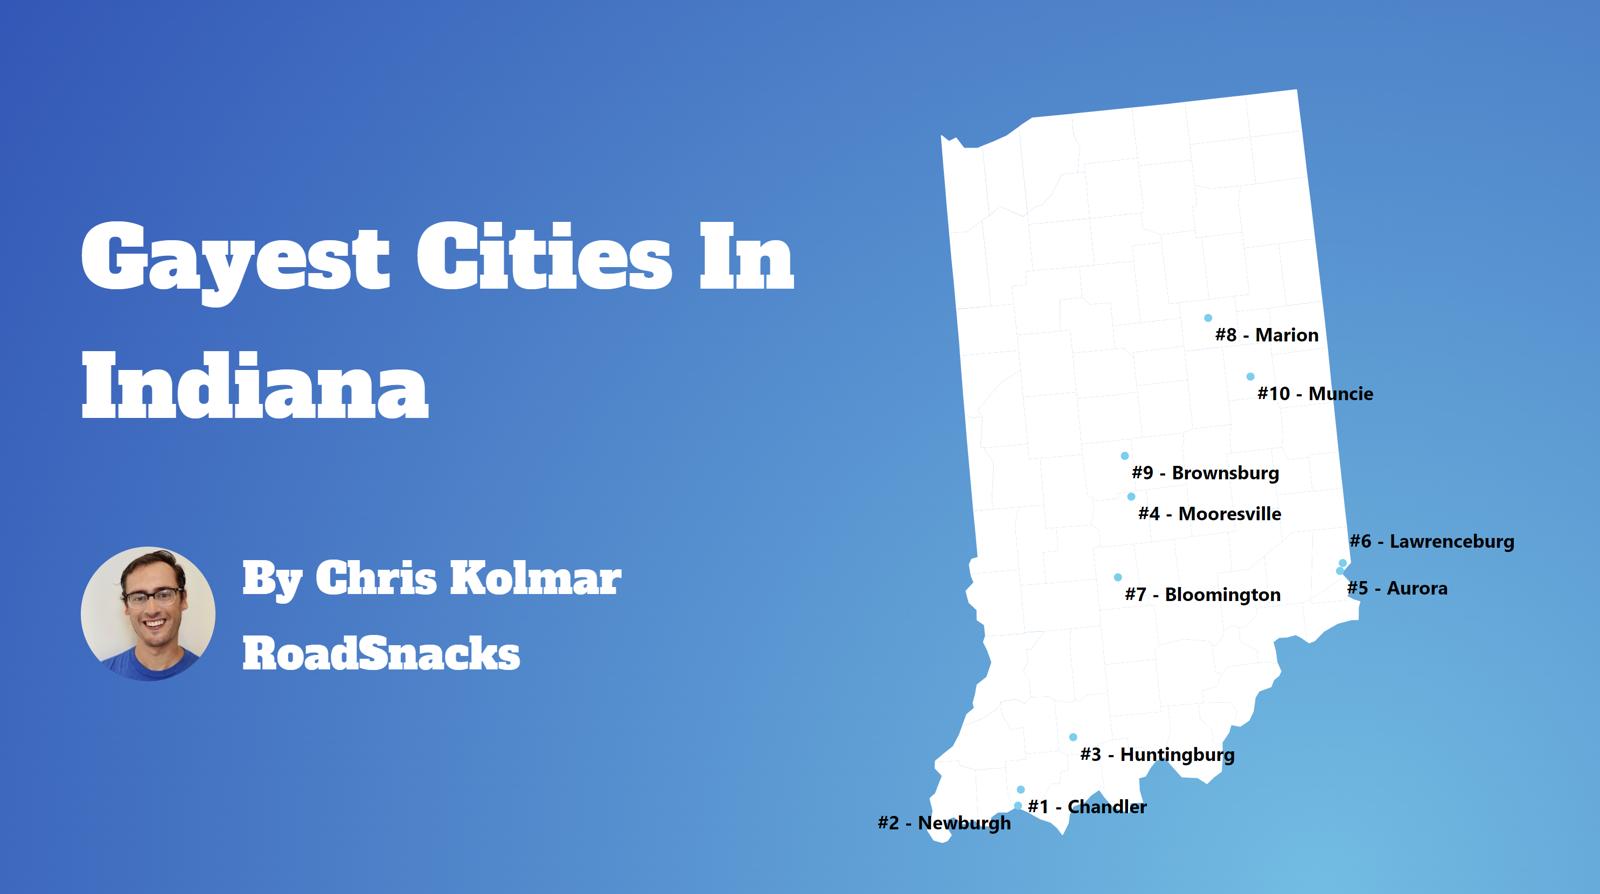
Table Of Contents: Top Ten | Methodology | Summary | Table
An estimated 5.4% of Indiana residents are gay.
That means there are a total of 277,100 gay households in The Hoosier State.
Our goal with this post is to use Saturday Night Science and data to determine the gayest cities in Indiana.
After analyzing 172 cities with over 1,000 households, we’ve determined these are The Gayest Cities in Indiana for 2025.
The 10 Gayest Places In Indiana For 2025
What’s the gayest place in Indiana? According to the facts, Chandler is the gayest place in Indiana for 2025.
For more on how we calculated the top ten, and for more information about these places, read on.
For more Indiana reading, check out:
- Gayest cities in the United States
- Best Places To Live In Indiana
- Cheapest Places To Live In Indiana
- Most Dangerous Cities In Indiana
The 10 Gayest Cities In Indiana For 2025
/10
Households: 1,311
Gay Households: 18 (54th highest)
% Gay Households: 2.75% (1st highest)
More on Chandler: Data
/10
Households: 1,408
Gay Households: 19 (52nd highest)
% Gay Households: 2.7% (2nd highest)
More on Newburgh: Data

/10
Households: 2,456
Gay Households: 17 (56th highest)
% Gay Households: 1.38% (3rd highest)
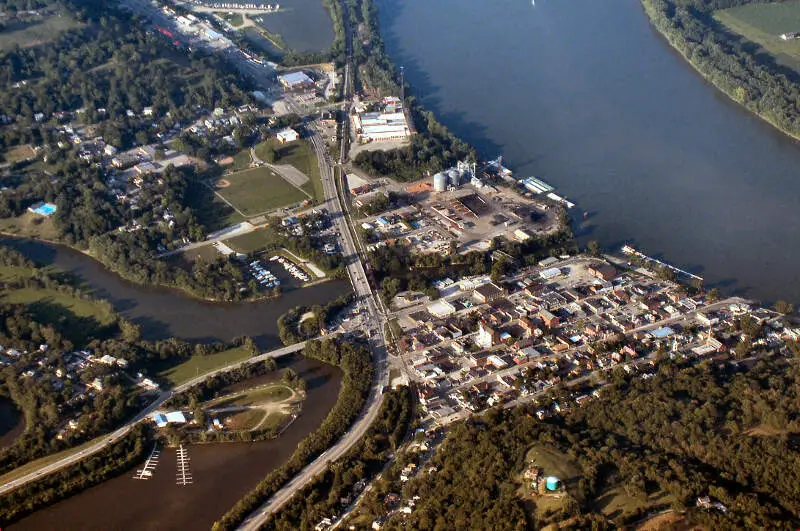
More on Huntingburg: Data

/10
Households: 3,779
Gay Households: 42 (28th highest)
% Gay Households: 1.38% (4th highest)
More on Mooresville: Data
/10
Households: 1,504
Gay Households: 10 (68th highest)
% Gay Households: 1.33% (5th highest)
More on Aurora: Data
/10
Households: 2,098
Gay Households: 11 (62nd highest)
% Gay Households: 1.05% (6th highest)
More on Lawrenceburg: Data

/10
Households: 30,897
Gay Households: 218 (3rd highest)
% Gay Households: 0.98% (7th highest)
More on Bloomington: Data

/10
Households: 10,953
Gay Households: 77 (13th highest)
% Gay Households: 0.91% (8th highest)
More on Marion: Data

/10
Households: 9,332
Gay Households: 38 (30th highest)
% Gay Households: 0.81% (9th highest)
More on Brownsburg: Data

/10
Households: 27,481
Gay Households: 176 (5th highest)
% Gay Households: 0.68% (10th highest)
More on Muncie: Data
How do you determine the best cities for same-sex households in Indiana for 2025
In order to rank the gayest cities in Indiana, we used Saturday Night Science and the 2013-2018 American Community Survey from the U.S. Census. We looked at:
- Percentage of all households that are unmarried, same sex partners
We limited the analysis to non-CDPs that have over 1,000 households.
We ranked each place from 1 to 172 with the city containing the highest percentage of unmarried, same sex partners households being the most gay.
In the end, ended up being the the most gay place with 2.75% gay households.
Skip to the end to see the list of all the places in the state from gayest to straighest.
We updated this report for 2025. This report is our tenth time ranking the gayest places in Indiana.
There You Have It – The Most LGBT Friendly Cities In Indiana For 2025
If you’re looking at the number of gay households in Indiana, this is an accurate list.
The gayest cities in Indiana are .
If you’re curious enough, here are the least gay places in Indiana:
- Lowell
- Bedford
- Nappanee
For more Indiana reading, check out:
- Richest Cities In Indiana
- Safest Places In Indiana
- Worst Places To Live In Indiana
- Most Expensive Places To Live In Indiana
Table: Gayest Places To Live In Indiana
| Rank | City | Households | % Gay Households |
|---|---|---|---|
| 1 | Chandler | 1,311 | 2.75% |
| 2 | Newburgh | 1,408 | 2.7% |
| 3 | Huntingburg | 2,456 | 1.38% |
| 4 | Mooresville | 3,779 | 1.38% |
| 5 | Aurora | 1,504 | 1.33% |
| 6 | Lawrenceburg | 2,098 | 1.05% |
| 7 | Bloomington | 30,897 | 0.98% |
| 8 | Marion | 10,953 | 0.91% |
| 9 | Brownsburg | 9,332 | 0.81% |
| 10 | Muncie | 27,481 | 0.68% |
| 11 | Portage | 14,570 | 0.67% |
| 12 | Terre Haute | 23,186 | 0.66% |
| 13 | Franklin | 9,234 | 0.65% |
| 14 | Logansport | 6,851 | 0.64% |
| 15 | Lawrence | 18,113 | 0.61% |
| 16 | Centerville | 1,000 | 0.6% |
| 17 | Indianapolis | 335,373 | 0.59% |
| 18 | Elwood | 3,433 | 0.58% |
| 19 | Jeffersonville | 18,457 | 0.57% |
| 20 | East Chicago | 10,160 | 0.53% |
| 21 | Mishawaka | 21,141 | 0.48% |
| 22 | Elkhart | 20,018 | 0.47% |
| 23 | St. John | 5,684 | 0.46% |
| 24 | Fort Wayne | 105,174 | 0.43% |
| 25 | Plainfield | 11,936 | 0.37% |
| 26 | Warsaw | 6,029 | 0.36% |
| 27 | South Bend | 38,601 | 0.3% |
| 28 | Dyer | 6,042 | 0.3% |
| 29 | Auburn | 5,705 | 0.28% |
| 30 | Beech Grove | 5,862 | 0.27% |
| 31 | Merrillville | 13,884 | 0.26% |
| 32 | Kokomo | 25,477 | 0.26% |
| 33 | Lafayette | 30,942 | 0.26% |
| 34 | Tell City | 3,095 | 0.26% |
| 35 | Noblesville | 22,532 | 0.25% |
| 36 | Evansville | 51,660 | 0.24% |
| 37 | Hobart | 10,922 | 0.24% |
| 38 | Frankfort | 6,034 | 0.23% |
| 39 | New Albany | 15,158 | 0.22% |
| 40 | La Porte | 9,214 | 0.22% |
| 41 | Highland | 9,473 | 0.21% |
| 42 | Gary | 31,389 | 0.2% |
| 43 | Richmond | 14,418 | 0.19% |
| 44 | Michigan City | 12,439 | 0.19% |
| 45 | Clarksville | 8,795 | 0.16% |
| 46 | Speedway | 5,186 | 0.12% |
| 47 | Hammond | 28,301 | 0.11% |
| 48 | Vincennes | 7,087 | 0.11% |
| 49 | Anderson | 23,086 | 0.09% |
| 50 | Valparaiso | 13,129 | 0.08% |
| 51 | Carmel | 33,738 | 0.07% |
| 52 | Columbus | 18,716 | 0.05% |
| 53 | Whiting | 1,798 | 0.0% |
| 54 | White | 2,652 | 0.0% |
| 55 | Greendale | 1,798 | 0.0% |
| 56 | Schererville | 11,734 | 0.0% |
| 57 | Salem | 2,687 | 0.0% |
| 58 | Cicero | 2,064 | 0.0% |
| 59 | Fowler | 1,022 | 0.0% |
| 60 | Zionsville | 9,346 | 0.0% |
| 61 | Danville | 3,633 | 0.0% |
| 62 | Brazil | 3,208 | 0.0% |
| 63 | New Castle | 7,308 | 0.0% |
| 64 | Middl | 1,026 | 0.0% |
| 65 | Fortville | 1,793 | 0.0% |
| 66 | De Motte | 1,753 | 0.0% |
| 67 | Austin | 1,453 | 0.0% |
| 68 | Tipton | 2,155 | 0.0% |
| 69 | Paoli | 1,480 | 0.0% |
| 70 | Bargersville | 2,492 | 0.0% |
| 71 | Hebron | 1,319 | 0.0% |
| 72 | Hunte | 2,312 | 0.0% |
| 73 | Mccordsville | 2,237 | 0.0% |
| 74 | Greenfield | 8,965 | 0.0% |
| 75 | Winfield | 1,841 | 0.0% |
| 76 | Whiteland | 1,510 | 0.0% |
| 77 | Mitchell | 1,713 | 0.0% |
| 78 | Porter | 1,580 | 0.0% |
| 79 | Greenwood | 21,793 | 0.0% |
| 80 | New Whiteland | 2,210 | 0.0% |
| 81 | Sheridan | 1,196 | 0.0% |
| 82 | Griffith | 6,620 | 0.0% |
| 83 | Pittsboro | 1,157 | 0.0% |
| 84 | Brookville | 1,193 | 0.0% |
| 85 | Bicknell | 1,264 | 0.0% |
| 86 | Corydon | 1,294 | 0.0% |
| 87 | Connersville | 5,665 | 0.0% |
| 88 | Lake Station | 4,086 | 0.0% |
| 89 | Martinsville | 4,349 | 0.0% |
| 90 | Charlestown | 3,054 | 0.0% |
| 91 | Avon | 5,946 | 0.0% |
| 92 | Crown Point | 11,184 | 0.0% |
| 93 | Munster | 8,697 | 0.0% |
| 94 | Cumberland | 2,073 | 0.0% |
| 95 | Bloomfield | 1,033 | 0.0% |
| 96 | Lapel | 1,041 | 0.0% |
| 97 | Scottsburg | 2,637 | 0.0% |
| 98 | Alexandria | 1,987 | 0.0% |
| 99 | Georg | 1,083 | 0.0% |
| 100 | Pendleton | 1,736 | 0.0% |