
Gayest places in Indiana research summary. We used Saturday Night Science to research the cities in Indiana with the highest percent of same-sex households for 2026. The data comes from the American Community Survey 2020-2024 5-year vintage, which counts same-sex married spouses and same-sex unmarried partners at the city level.
-
The city with the highest rate of same-sex houesholds in Indiana is Corydon. 5.3% of households in Corydon are gay.
-
The city in Indiana with the most same-sex houesholds is Indianapolis with 5,437 gay households.
-
Indiana is the 31st most gay in the United States.
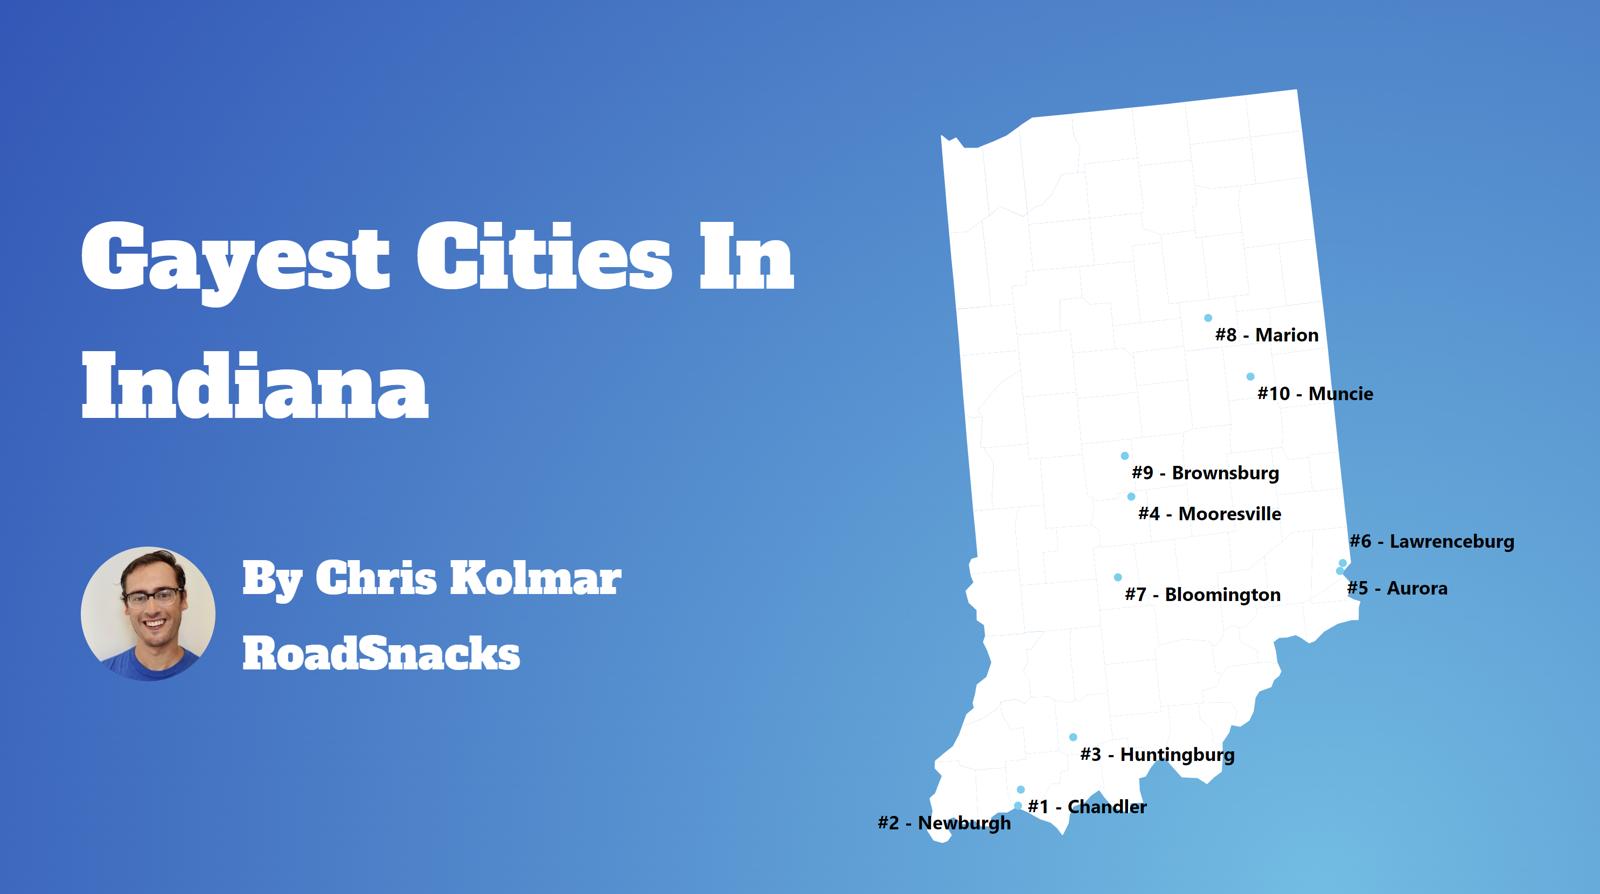
Table Of Contents: Top Ten | Methodology | Summary | Table
An estimated 0.81% of Indiana residents are gay.
That means there are a total of 22,001 gay households in The Hoosier State.
Our goal with this post is to use Saturday Night Science and data to determine the gayest cities in Indiana.
After analyzing 177 cities with over 1,000 households, we’ve determined these are The Gayest Cities in Indiana for 2026.
The 10 Gayest Places In Indiana For 2026
- Corydon
- Porter
- Syracuse
- Boonville
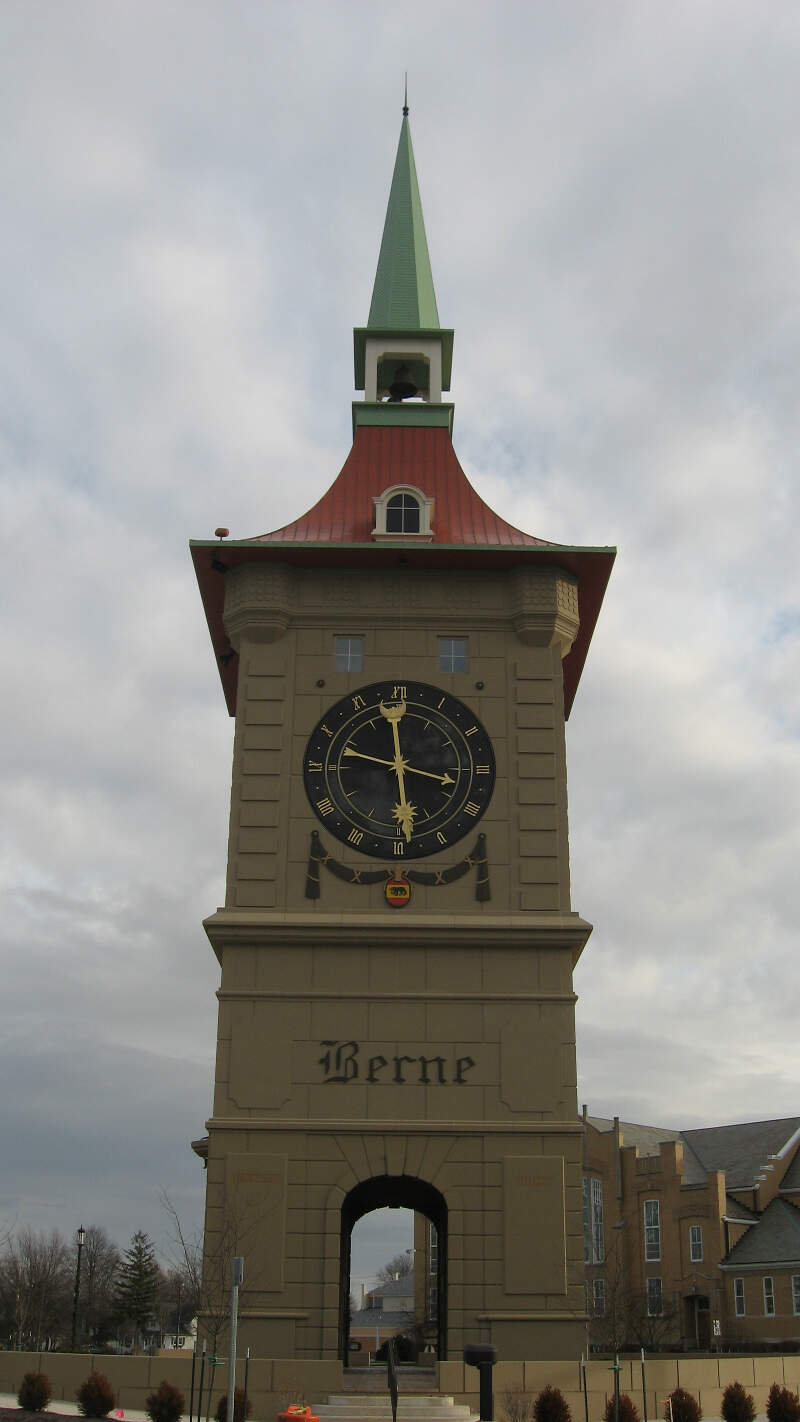
- Berne
- McCordsville
- New Palestine
- Lebanon
- Vincennes
- Mooresville
What’s the gayest place in Indiana? According to the facts, Corydon is the gayest place in Indiana for 2026.
For more on how we calculated the top ten, and for more information about these places, read on.
For more Indiana reading, check out:
- Gayest cities in the United States
- Best Places To Live In Indiana
- Cheapest Places To Live In Indiana
- Most Dangerous Cities In Indiana
The 10 Gayest Cities In Indiana For 2026
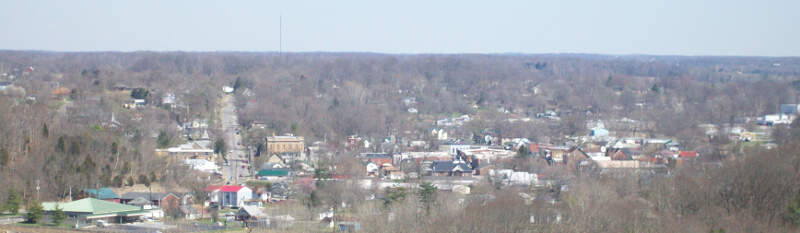
1. Corydon
/10
Households: 1,359
Gay Households: 72 (48th highest)
% Gay Households: 5.3% (1st highest)
More on Corydon: Movers
/10
/10

/10
Households: 2,672
Gay Households: 83 (40th highest)
% Gay Households: 3.11% (4th highest)
More on Boonville: Data | Crime | Cost Of Living | Movers
/10
Households: 1,488
Gay Households: 38 (64th highest)
% Gay Households: 2.55% (5th highest)
More on Berne: Data | Movers

/10
Households: 4,136
Gay Households: 94 (34th highest)
% Gay Households: 2.27% (6th highest)
More on Mccordsville: Data | Crime | Cost Of Living | Movers
7. New Palestine
/10
Households: 1,272
Gay Households: 26 (72nd highest)
% Gay Households: 2.04% (7th highest)
More on New Palestine: Movers

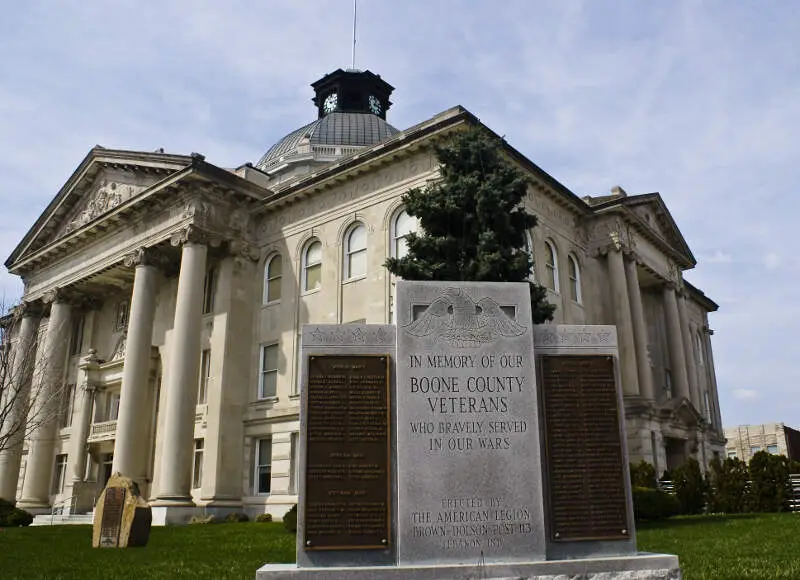
/10
Households: 7,371
Gay Households: 145 (24th highest)
% Gay Households: 1.97% (8th highest)
More on Lebanon: Data | Crime | Cost Of Living | Movers

/10
Households: 7,227
Gay Households: 140 (25th highest)
% Gay Households: 1.94% (9th highest)
More on Vincennes: Data | Crime | Cost Of Living | Movers

/10
Households: 3,924
Gay Households: 75 (47th highest)
% Gay Households: 1.91% (10th highest)
More on Mooresville: Data | Cost Of Living | Movers
How do you determine the best cities for same-sex households in Indiana for 2026
In order to rank the gayest cities in Indiana, we used Saturday Night Science and the 2020-2024 American Community Survey 5-year estimates from the U.S. Census. We looked at:
- Percentage of all households that are unmarried, same sex partners
We limited the analysis to non-CDPs that have over 1,000 households.
We ranked each place from 1 to 177 with the city containing the highest percentage of unmarried, same sex partners households being the most gay.
In the end, ended up being the the most gay place with 5.3% gay households.
Skip to the end to see the list of all the places in the state from gayest to straighest.
We updated this report for 2026. This report is our eleventh time ranking the gayest places in Indiana.
There You Have It – The Most LGBT Friendly Cities In Indiana For 2026
If you’re looking at the number of gay households in Indiana, this is an accurate list.
The gayest cities in Indiana are .
If you’re curious enough, here are the least gay places in Indiana:
- Linton
- White
- Mitchell
For more Indiana reading, check out:
- Richest Cities In Indiana
- Safest Places In Indiana
- Worst Places To Live In Indiana
- Most Expensive Places To Live In Indiana
Table: Gayest Places To Live In Indiana
| Rank | City | Households | % Gay Households |
|---|---|---|---|
| 1 | Corydon | 1,359 | 5.3% |
| 2 | Porter | 2,128 | 4.32% |
| 3 | Syracuse | 1,506 | 4.12% |
| 4 | Boonville | 2,672 | 3.11% |
| 5 | Berne | 1,488 | 2.55% |
| 6 | Mccordsville | 4,136 | 2.27% |
| 7 | New Palestine | 1,272 | 2.04% |
| 8 | Lebanon | 7,371 | 1.97% |
| 9 | Vincennes | 7,227 | 1.94% |
| 10 | Mooresville | 3,924 | 1.91% |
| 11 | Brazil | 3,319 | 1.75% |
| 12 | Scottsburg | 3,149 | 1.71% |
| 13 | Lagrange | 1,117 | 1.7% |
| 14 | Chesterfield | 1,006 | 1.69% |
| 15 | Madison | 4,924 | 1.62% |
| 16 | Shelbyville | 8,718 | 1.58% |
| 17 | New Albany | 16,389 | 1.56% |
| 18 | Lawrence | 19,579 | 1.52% |
| 19 | Indianapolis | 362,961 | 1.5% |
| 20 | Beech Grove | 6,798 | 1.46% |
| 21 | Aurora | 1,653 | 1.45% |
| 22 | Winchester | 2,139 | 1.45% |
| 23 | Garrett | 2,827 | 1.41% |
| 24 | North Vernon | 2,940 | 1.39% |
| 25 | South Bend | 41,282 | 1.39% |
| 26 | Fairmount | 1,010 | 1.39% |
| 27 | Sullivan | 1,749 | 1.37% |
| 28 | Plainfield | 12,809 | 1.34% |
| 29 | Brown | 1,296 | 1.31% |
| 30 | Evansville | 53,095 | 1.26% |
| 31 | Zionsville | 11,822 | 1.26% |
| 32 | Middlebury | 1,283 | 1.25% |
| 33 | Warsaw | 7,089 | 1.23% |
| 34 | Logansport | 6,768 | 1.21% |
| 35 | New Haven | 6,627 | 1.19% |
| 36 | Speedway | 6,095 | 1.18% |
| 37 | Spencer | 1,193 | 1.17% |
| 38 | Delphi | 1,067 | 1.12% |
| 39 | Bloomington | 34,514 | 1.12% |
| 40 | Fort Wayne | 110,929 | 1.11% |
| 41 | Brownsburg | 11,345 | 1.09% |
| 42 | Lawrenceburg | 2,294 | 1.09% |
| 43 | Sheridan | 1,379 | 1.09% |
| 44 | Attica | 1,291 | 1.08% |
| 45 | Greenfield | 10,666 | 1.08% |
| 46 | Columbus | 21,726 | 1.07% |
| 47 | La Porte | 8,951 | 1.03% |
| 48 | Franklin | 9,590 | 0.98% |
| 49 | Kokomo | 26,241 | 0.98% |
| 50 | Hammond | 29,797 | 0.96% |
| 51 | Georg | 1,279 | 0.94% |
| 52 | Salem | 2,706 | 0.92% |
| 53 | Pendleton | 2,060 | 0.92% |
| 54 | Noblesville | 27,115 | 0.88% |
| 55 | Greendale | 1,713 | 0.88% |
| 56 | Bicknell | 1,372 | 0.87% |
| 57 | Connersville | 5,409 | 0.85% |
| 58 | Winamac | 1,084 | 0.83% |
| 59 | Mishawaka | 22,850 | 0.82% |
| 60 | Bedford | 6,353 | 0.82% |
| 61 | Munster | 9,471 | 0.8% |
| 62 | Batesville | 3,002 | 0.8% |
| 63 | Highland | 10,440 | 0.8% |
| 64 | Wabash | 4,433 | 0.79% |
| 65 | Jeffersonville | 22,196 | 0.78% |
| 66 | Terre Haute | 23,220 | 0.78% |
| 67 | Santa Claus | 1,048 | 0.76% |
| 68 | Richmond | 14,849 | 0.76% |
| 69 | Elkhart | 21,552 | 0.74% |
| 70 | Avilla | 1,087 | 0.74% |
| 71 | Clarksville | 9,392 | 0.69% |
| 72 | Liberty | 1,016 | 0.69% |
| 73 | Hobart | 12,226 | 0.69% |
| 74 | Gary | 27,227 | 0.69% |
| 75 | Muncie | 26,479 | 0.68% |
| 76 | Westfield | 20,984 | 0.66% |
| 77 | Greenwood | 26,415 | 0.65% |
| 78 | Valparaiso | 14,611 | 0.64% |
| 79 | West Lafayette | 15,062 | 0.63% |
| 80 | Michigan City | 13,008 | 0.63% |
| 81 | Lafayette | 32,242 | 0.63% |
| 82 | Huntington | 7,009 | 0.63% |
| 83 | Anderson | 24,218 | 0.6% |
| 84 | Carmel | 38,426 | 0.6% |
| 85 | Sellersburg | 4,278 | 0.56% |
| 86 | Hartford City | 2,717 | 0.55% |
| 87 | St. John | 7,844 | 0.54% |
| 88 | Griffith | 6,969 | 0.53% |
| 89 | Brookville | 1,158 | 0.52% |
| 90 | Angola | 3,513 | 0.51% |
| 91 | Jasper | 6,548 | 0.47% |
| 92 | Crawfordsville | 6,782 | 0.46% |
| 93 | Alexandria | 2,191 | 0.46% |
| 94 | Lowell | 4,204 | 0.45% |
| 95 | Cumberland | 2,586 | 0.43% |
| 96 | Ellettsville | 2,610 | 0.42% |
| 97 | Decatur | 4,389 | 0.41% |
| 98 | Martinsville | 4,907 | 0.41% |
| 99 | Bargersville | 3,738 | 0.4% |
| 100 | Chesterton | 6,004 | 0.4% |