
Gayest places in Iowa research summary. We used Saturday Night Science to research the cities in Iowa with the highest percent of same-sex households for 2025. The data comes from the American Community Survey 2013-2018 vintage, which breaks down sex by household status. Unfortunately, the Census has stopped reporting at the city level, so this report reflects the most recent data.
-
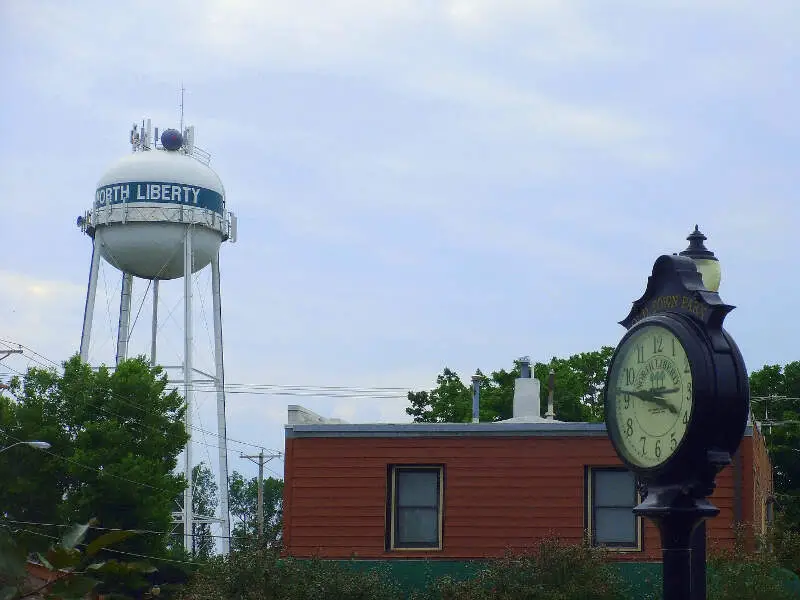
The city with the highest rate of same-sex houesholds in Iowa is North Liberty. 2.43% of households in North Liberty are gay.
-
The city in Iowa with the most same-sex houesholds is Des Moines with 414 gay households.
-
Iowa is the 45th most gay in the United States.
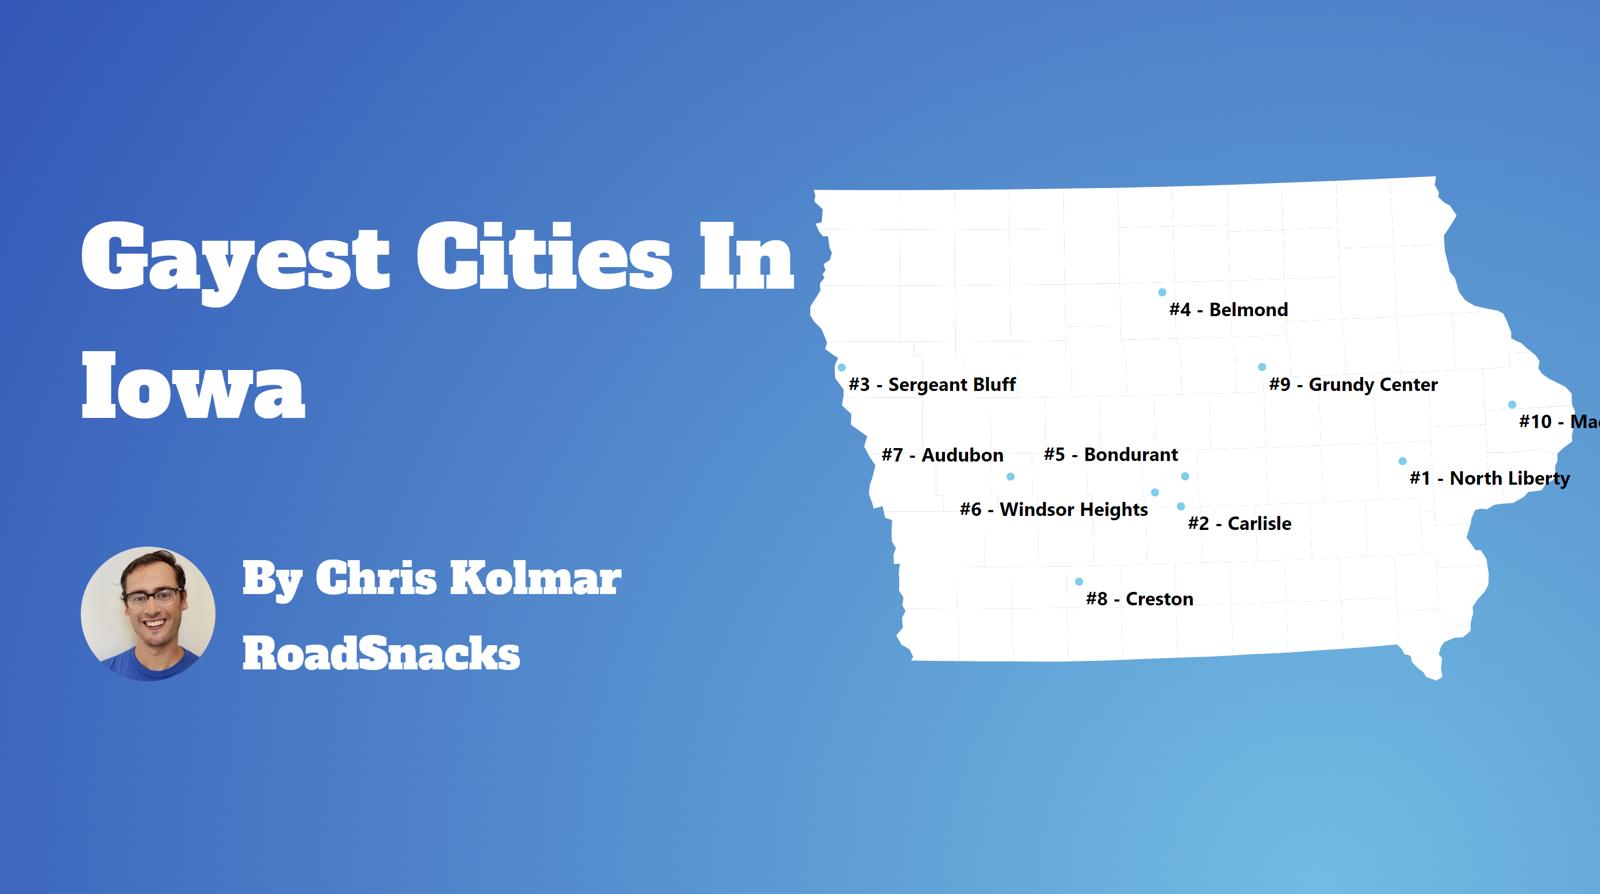
Table Of Contents: Top Ten | Methodology | Summary | Table
An estimated 4.7% of Iowa residents are gay.
That means there are a total of 113,600 gay households in The Hawkeye State.
Our goal with this post is to use Saturday Night Science and data to determine the gayest cities in Iowa.
After analyzing 137 cities with over 1,000 households, we’ve determined these are The Gayest Cities in Iowa for 2025.
The 10 Gayest Places In Iowa For 2025
- North Liberty
- Carlisle
- Sergeant Bluff
- Belmond
- Bondurant
- Windsor Heights
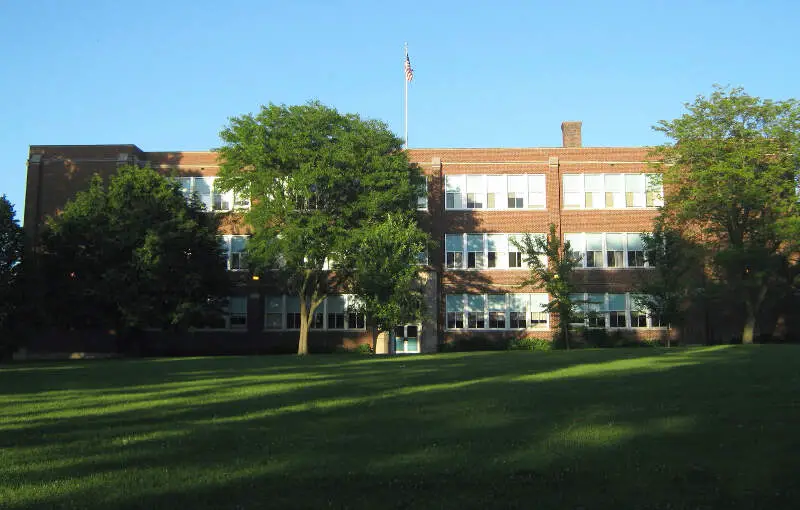
- Audubon
- Creston
- Grundy Center
- Maquoketa
What’s the gayest place in Iowa? According to the facts, North Liberty is the gayest place in Iowa for 2025.
For more on how we calculated the top ten, and for more information about these places, read on.
For more Iowa reading, check out:
- Gayest cities in the United States
- Best Places To Live In Iowa
- Cheapest Places To Live In Iowa
- Most Dangerous Cities In Iowa
The 10 Gayest Cities In Iowa For 2025

/10
Households: 7,075
Gay Households: 139 (3rd highest)
% Gay Households: 2.43% (1st highest)
More on North Liberty: Data
2. Carlisle
/10
Households: 1,547
Gay Households: 14 (30th highest)
% Gay Households: 1.81% (2nd highest)
More on Carlisle:
3. Sergeant Bluff
/10
Households: 1,779
Gay Households: 15 (26th highest)
% Gay Households: 1.69% (3rd highest)
More on Sergeant Bluff:
4. Belmond
/10
Households: 1,111
Gay Households: 13 (35th highest)
% Gay Households: 1.44% (4th highest)
More on Belmond:
5. Bondurant
/10
Households: 1,992
Gay Households: 14 (30th highest)
% Gay Households: 1.41% (5th highest)
More on Bondurant:
6. Windsor Heights
/10
Households: 2,160
Gay Households: 14 (30th highest)
% Gay Households: 1.3% (6th highest)
More on Windsor Heights:
7. Audubon
/10
Households: 1,003
Gay Households: 6 (45th highest)
% Gay Households: 1.2% (7th highest)
More on Audubon:

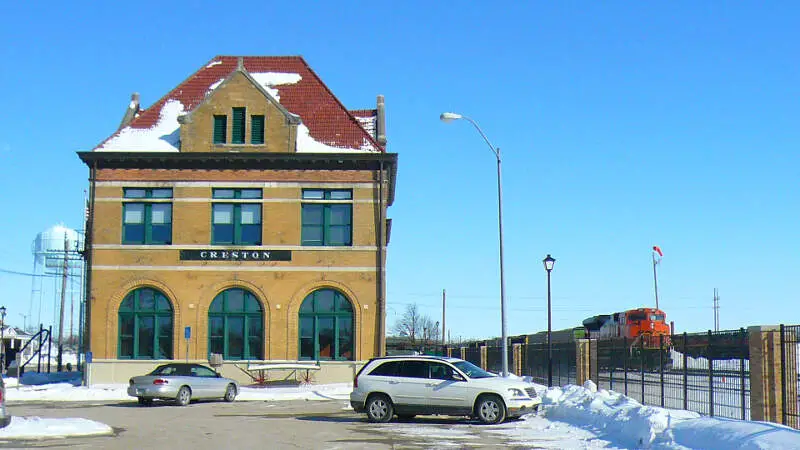
/10
Households: 3,299
Gay Households: 35 (13th highest)
% Gay Households: 1.03% (8th highest)
More on Creston: Data
9. Grundy Center
/10
Households: 1,178
Gay Households: 6 (45th highest)
% Gay Households: 1.02% (9th highest)
More on Grundy Center:

/10
Households: 2,627
Gay Households: 9 (38th highest)
% Gay Households: 0.69% (10th highest)
More on Maquoketa: Data
How do you determine the best cities for same-sex households in Iowa for 2025
In order to rank the gayest cities in Iowa, we used Saturday Night Science and the 2013-2018 American Community Survey from the U.S. Census. We looked at:
- Percentage of all households that are unmarried, same sex partners
We limited the analysis to non-CDPs that have over 1,000 households.
We ranked each place from 1 to 137 with the city containing the highest percentage of unmarried, same sex partners households being the most gay.
In the end, ended up being the the most gay place with 2.43% gay households.
Skip to the end to see the list of all the places in the state from gayest to straighest.
We updated this report for 2025. This report is our tenth time ranking the gayest places in Iowa.
There You Have It – The Most LGBT Friendly Cities In Iowa For 2025
If you’re looking at the number of gay households in Iowa, this is an accurate list.
The gayest cities in Iowa are .
If you’re curious enough, here are the least gay places in Iowa:
- Osceola
- Evansdale
- Ottumwa
For more Iowa reading, check out:
- Richest Cities In Iowa
- Safest Places In Iowa
- Worst Places To Live In Iowa
- Most Expensive Places To Live In Iowa
Table: Gayest Places To Live In Iowa
| Rank | City | Households | % Gay Households |
|---|---|---|---|
| 1 | North Liberty | 7,075 | 2.43% |
| 2 | Carlisle | 1,547 | 1.81% |
| 3 | Sergeant Bluff | 1,779 | 1.69% |
| 4 | Belmond | 1,111 | 1.44% |
| 5 | Bondurant | 1,992 | 1.41% |
| 6 | Windsor Heights | 2,160 | 1.3% |
| 7 | Audubon | 1,003 | 1.2% |
| 8 | Creston | 3,299 | 1.03% |
| 9 | Grundy Center | 1,178 | 1.02% |
| 10 | Maquoketa | 2,627 | 0.69% |
| 11 | Des Moines | 84,140 | 0.62% |
| 12 | Ankeny | 22,085 | 0.61% |
| 13 | Keokuk | 4,312 | 0.6% |
| 14 | Mason City | 12,370 | 0.52% |
| 15 | Sioux City | 31,244 | 0.51% |
| 16 | Atlantic | 3,224 | 0.5% |
| 17 | Iowa City | 29,975 | 0.39% |
| 18 | Grimes | 4,493 | 0.36% |
| 19 | Robins | 1,193 | 0.34% |
| 20 | Ames | 25,243 | 0.32% |
| 21 | Marion | 15,805 | 0.32% |
| 22 | Fort Dodge | 9,903 | 0.28% |
| 23 | Waterloo | 28,550 | 0.27% |
| 24 | Cedar Rapids | 54,431 | 0.2% |
| 25 | Urbandale | 16,726 | 0.17% |
| 26 | West Des Moines | 27,704 | 0.11% |
| 27 | Bettendorf | 13,986 | 0.1% |
| 28 | Davenport | 40,273 | 0.07% |
| 29 | Council Bluffs | 24,816 | 0.07% |
| 30 | Dubuque | 23,926 | 0.07% |
| 31 | Adel | 1,718 | 0.0% |
| 32 | Le Claire | 1,484 | 0.0% |
| 33 | Marengo | 1,144 | 0.0% |
| 34 | Charles City | 3,318 | 0.0% |
| 35 | Perry | 2,971 | 0.0% |
| 36 | Newton | 6,366 | 0.0% |
| 37 | Williamsburg | 1,405 | 0.0% |
| 38 | Glenwood | 1,881 | 0.0% |
| 39 | Jesup | 1,052 | 0.0% |
| 40 | Belle Plaine | 1,055 | 0.0% |
| 41 | Fort Madison | 4,370 | 0.0% |
| 42 | Independence | 2,526 | 0.0% |
| 43 | Albia | 1,639 | 0.0% |
| 44 | New Hampton | 1,562 | 0.0% |
| 45 | Washington | 3,062 | 0.0% |
| 46 | Eldridge | 2,349 | 0.0% |
| 47 | Madrid | 1,039 | 0.0% |
| 48 | Indianola | 6,108 | 0.0% |
| 49 | Nevada | 2,759 | 0.0% |
| 50 | Missouri Valley | 1,222 | 0.0% |
| 51 | Tipton | 1,305 | 0.0% |
| 52 | Tiffin | 1,190 | 0.0% |
| 53 | Pleasant Hill | 3,652 | 0.0% |
| 54 | Chariton | 1,877 | 0.0% |
| 55 | Wilton | 1,196 | 0.0% |
| 56 | Norwalk | 4,130 | 0.0% |
| 57 | Polk City | 1,452 | 0.0% |
| 58 | Hampton | 1,734 | 0.0% |
| 59 | Hawarden | 1,016 | 0.0% |
| 60 | Kalona | 1,017 | 0.0% |
| 61 | Dyersville | 1,852 | 0.0% |
| 62 | Waukon | 1,791 | 0.0% |
| 63 | Huxley | 1,319 | 0.0% |
| 64 | Waukee | 7,603 | 0.0% |
| 65 | Altoona | 6,448 | 0.0% |
| 66 | Monticello | 1,688 | 0.0% |
| 67 | Johnston | 8,151 | 0.0% |
| 68 | West Liberty | 1,286 | 0.0% |
| 69 | Vinton | 2,069 | 0.0% |
| 70 | Mount Vernon | 1,243 | 0.0% |
| 71 | Boone | 5,322 | 0.0% |
| 72 | Manchester | 2,151 | 0.0% |
| 73 | Oelwein | 2,657 | 0.0% |
| 74 | Coralville | 7,976 | 0.0% |
| 75 | Winterset | 2,136 | 0.0% |
| 76 | Knoxville | 3,248 | 0.0% |
| 77 | Carter Lake | 1,356 | 0.0% |
| 78 | Bloomfield | 1,148 | 0.0% |
| 79 | Decorah | 2,729 | 0.0% |
| 80 | Clive | 6,618 | 0.0% |
| 81 | Waverly | 3,649 | 0.0% |
| 82 | Spencer | 5,013 | 0.0% |
| 83 | Le Mars | 4,142 | 0.0% |
| 84 | Clarion | 1,218 | 0.0% |
| 85 | Clarinda | 2,043 | 0.0% |
| 86 | Osage | 1,649 | 0.0% |
| 87 | Iowa Falls | 2,203 | 0.0% |
| 88 | Grinnell | 3,708 | 0.0% |
| 89 | West Burlington | 1,248 | 0.0% |
| 90 | Eldora | 1,007 | 0.0% |
| 91 | Cresco | 1,634 | 0.0% |
| 92 | Forest City | 1,632 | 0.0% |
| 93 | Cherokee | 2,299 | 0.0% |
| 94 | Spirit Lake | 2,535 | 0.0% |
| 95 | Algona | 2,573 | 0.0% |
| 96 | Pella | 3,958 | 0.0% |
| 97 | Storm Lake | 3,544 | 0.0% |
| 98 | Fairfield | 3,840 | 0.0% |
| 99 | Carroll | 4,434 | 0.0% |
| 100 | Sheldon | 2,166 | 0.0% |