
Gayest places in New Jersey research summary. We used Saturday Night Science to research the cities in New Jersey with the highest percent of same-sex households for 2025. The data comes from the American Community Survey 2013-2018 vintage, which breaks down sex by household status. Unfortunately, the Census has stopped reporting at the city level, so this report reflects the most recent data.
-
The city with the highest rate of same-sex houesholds in New Jersey is Kenvil. 5.57% of households in Kenvil are gay.
-
The city in New Jersey with the most same-sex houesholds is Jersey City with 711 gay households.
-
New Jersey is the 34th most gay in the United States.
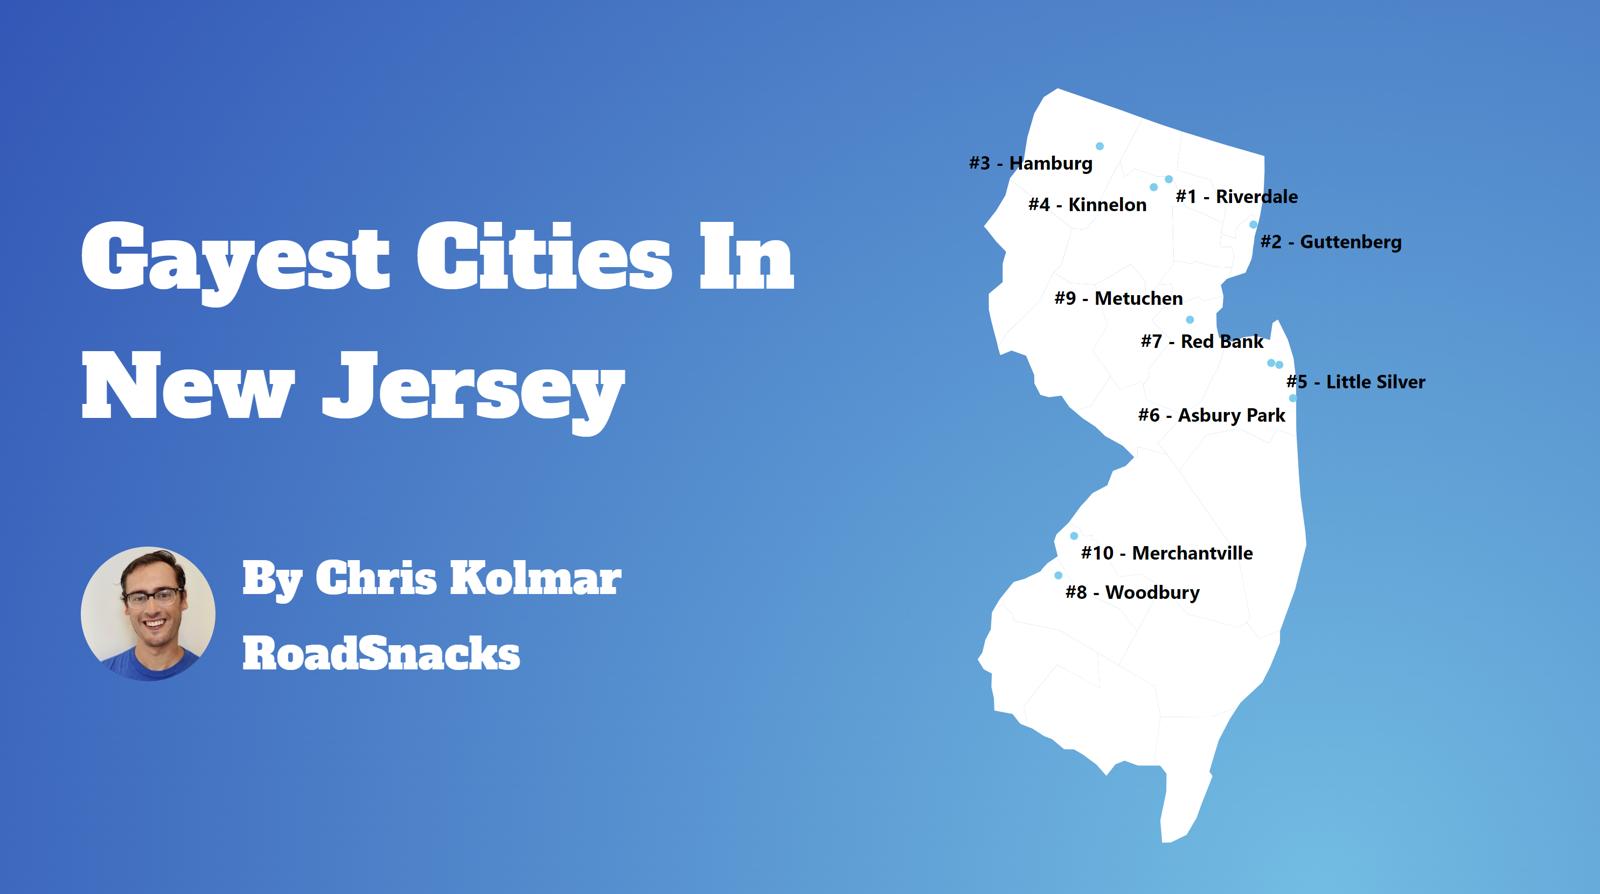
Table Of Contents: Top Ten | Methodology | Summary | Table
An estimated 5.3% of New Jersey residents are gay.
That means there are a total of 367,300 gay households in The Garden State.
Our goal with this post is to use Saturday Night Science and data to determine the gayest cities in New Jersey.
After analyzing 355 cities with over 1,000 households, we’ve determined these are The Gayest Cities in New Jersey for 2025.
The 10 Gayest Places In New Jersey For 2025
- Kenvil
- Riverdale
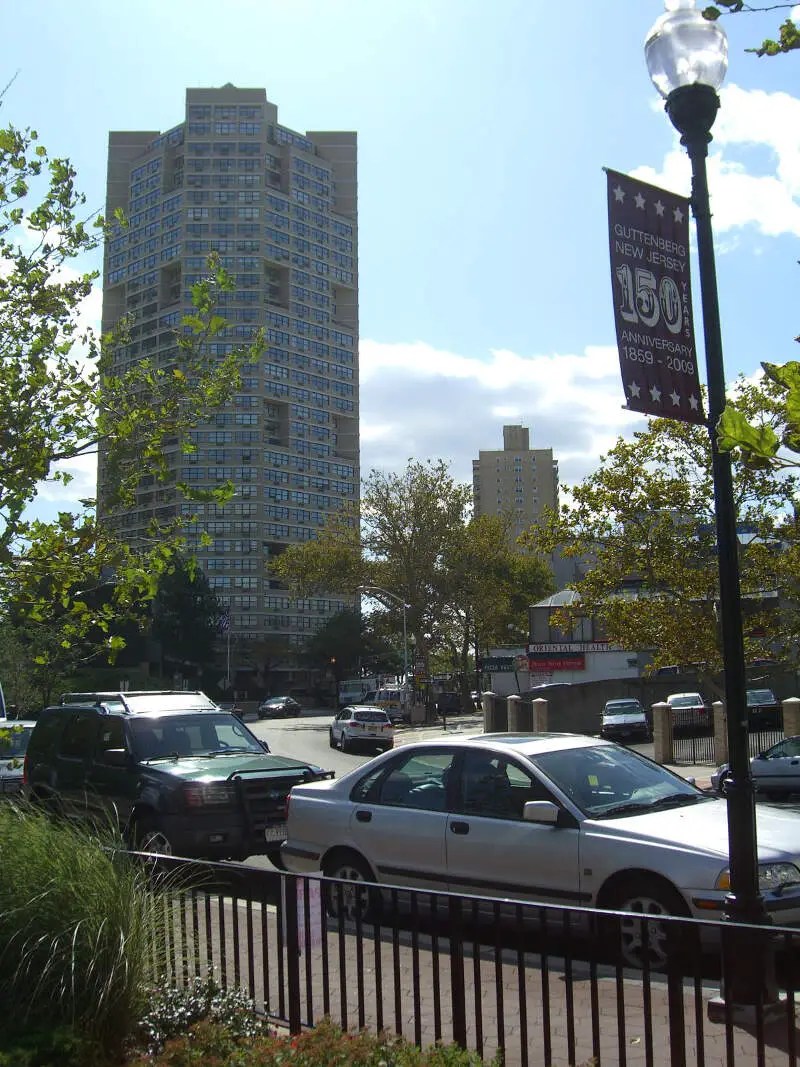
- Guttenberg
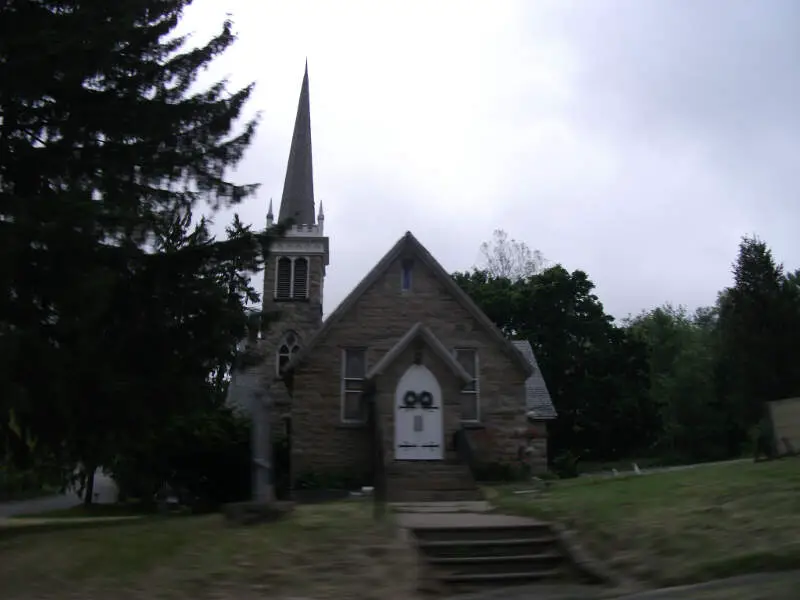
- Hamburg
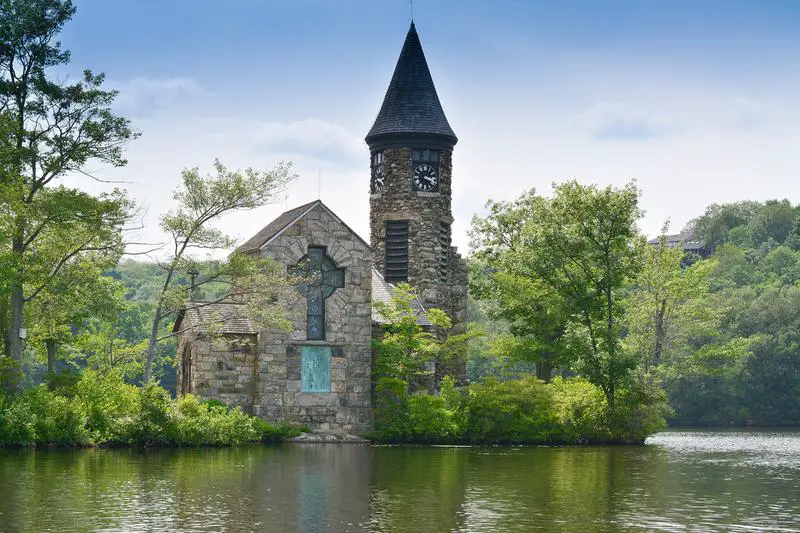
- Kinnelon
- Little Silver
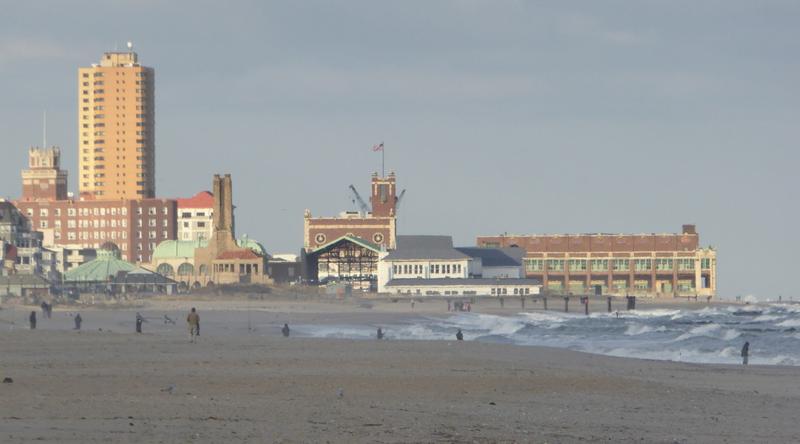
- Asbury Park
- Kingston Estates
- Wanamassa
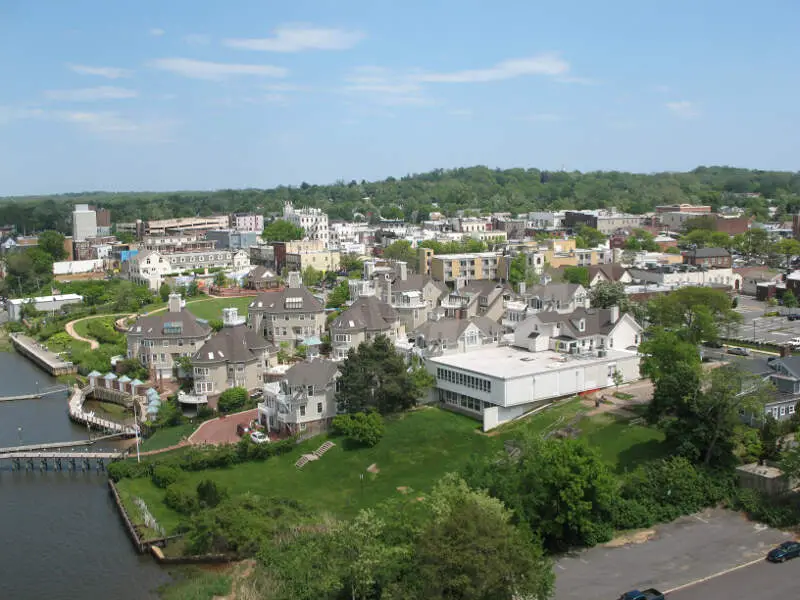
- Red Bank
What’s the gayest place in New Jersey? According to the facts, Kenvil is the gayest place in New Jersey for 2025.
For more on how we calculated the top ten, and for more information about these places, read on.
For more New Jersey reading, check out:
- Gayest cities in the United States
- Best Places To Live In New Jersey
- Cheapest Places To Live In New Jersey
- Most Dangerous Cities In New Jersey
The 10 Gayest Cities In New Jersey For 2025
/10
Households: 1,150
Gay Households: 32 (47th highest)
% Gay Households: 5.57% (1st highest)
More on Kenvil: Data
/10
Households: 1,829
Gay Households: 58 (24th highest)
% Gay Households: 5.03% (2nd highest)
More on Riverdale: Data

/10
Households: 4,673
Gay Households: 112 (6th highest)
% Gay Households: 3.98% (3rd highest)
More on Guttenberg: Data
/10
Households: 1,328
Gay Households: 26 (58th highest)
% Gay Households: 3.92% (4th highest)
More on Hamburg: Data

/10
Households: 3,376
Gay Households: 40 (36th highest)
% Gay Households: 2.37% (5th highest)
More on Kinnelon: Data

/10
Households: 2,099
Gay Households: 22 (71st highest)
% Gay Households: 2.1% (6th highest)
More on Little Silver: Data

/10
Households: 6,721
Gay Households: 108 (8th highest)
% Gay Households: 1.84% (7th highest)
More on Asbury Park: Data

/10
Households: 2,432
Gay Households: 22 (71st highest)
% Gay Households: 1.81% (8th highest)
More on Kingston Estates: Data
/10
Households: 1,577
Gay Households: 14 (105th highest)
% Gay Households: 1.78% (9th highest)
More on Wanamassa: Data

/10
Households: 5,138
Gay Households: 44 (32nd highest)
% Gay Households: 1.71% (10th highest)
More on Red Bank: Data
How do you determine the best cities for same-sex households in New Jersey for 2025
In order to rank the gayest cities in New Jersey, we used Saturday Night Science and the 2013-2018 American Community Survey from the U.S. Census. We looked at:
- Percentage of all households that are unmarried, same sex partners
We limited the analysis to non-CDPs that have over 1,000 households.
We ranked each place from 1 to 355 with the city containing the highest percentage of unmarried, same sex partners households being the most gay.
In the end, ended up being the the most gay place with 5.57% gay households.
Skip to the end to see the list of all the places in the state from gayest to straighest.
We updated this report for 2025. This report is our tenth time ranking the gayest places in New Jersey.
There You Have It – The Most LGBT Friendly Cities In New Jersey For 2025
If you’re looking at the number of gay households in New Jersey, this is an accurate list.
The gayest cities in New Jersey are .
If you’re curious enough, here are the least gay places in New Jersey:
- Lincroft
- Maywood
- Morris Plains
For more New Jersey reading, check out:
- Richest Cities In New Jersey
- Safest Places In New Jersey
- Worst Places To Live In New Jersey
- Most Expensive Places To Live In New Jersey
Table: Gayest Places To Live In New Jersey
| Rank | City | Households | % Gay Households |
|---|---|---|---|
| 1 | Kenvil | 1,150 | 5.57% |
| 2 | Riverdale | 1,829 | 5.03% |
| 3 | Guttenberg | 4,673 | 3.98% |
| 4 | Hamburg | 1,328 | 3.92% |
| 5 | Kinnelon | 3,376 | 2.37% |
| 6 | Little Silver | 2,099 | 2.1% |
| 7 | Asbury Park | 6,721 | 1.84% |
| 8 | Kingston Estates | 2,432 | 1.81% |
| 9 | Wanamassa | 1,577 | 1.78% |
| 10 | Red Bank | 5,138 | 1.71% |
| 11 | Oak Valley | 1,194 | 1.68% |
| 12 | Woodbury | 3,903 | 1.59% |
| 13 | Metuchen | 5,203 | 1.58% |
| 14 | Merchantville | 1,479 | 1.49% |
| 15 | Upper Saddle River | 2,452 | 1.47% |
| 16 | Westville | 1,636 | 1.47% |
| 17 | Brookdale | 3,363 | 1.43% |
| 18 | Ho-Ho-Kus | 1,415 | 1.41% |
| 19 | Midland Park | 2,604 | 1.38% |
| 20 | Pitman | 3,359 | 1.37% |
| 21 | Collingswood | 5,966 | 1.34% |
| 22 | Manville | 3,785 | 1.32% |
| 23 | Edgewater | 5,746 | 1.29% |
| 24 | Roebling | 1,428 | 1.26% |
| 25 | Holiday City-Berkeley | 7,522 | 1.25% |
| 26 | Mount Ephraim | 1,775 | 1.13% |
| 27 | Leisure Village | 2,436 | 1.07% |
| 28 | Lincoln Park | 3,587 | 1.06% |
| 29 | Watchung | 1,899 | 1.05% |
| 30 | Rutherford | 7,101 | 1.04% |
| 31 | Pennsville | 4,440 | 1.04% |
| 32 | Somers Point | 4,457 | 1.03% |
| 33 | Jersey City | 101,007 | 1.01% |
| 34 | Princeton Meadows | 5,576 | 1.0% |
| 35 | Leonardo | 1,009 | 0.99% |
| 36 | Sea Isle City | 1,020 | 0.98% |
| 37 | Plainfield | 15,338 | 0.98% |
| 38 | Pompton Lakes | 3,952 | 0.96% |
| 39 | Glassboro | 5,934 | 0.94% |
| 40 | Elmwood Park | 6,890 | 0.93% |
| 41 | Garwood | 1,773 | 0.9% |
| 42 | Woodland Park | 4,364 | 0.87% |
| 43 | North Haledon | 3,221 | 0.87% |
| 44 | Dunellen | 2,540 | 0.87% |
| 45 | Fair Haven | 1,864 | 0.86% |
| 46 | Echelon | 4,924 | 0.85% |
| 47 | Magnolia | 1,656 | 0.85% |
| 48 | Bogota | 2,866 | 0.84% |
| 49 | Atlantic Highlands | 1,719 | 0.81% |
| 50 | Clinton | 1,059 | 0.76% |
| 51 | Bergenfield | 8,760 | 0.75% |
| 52 | Highland Park | 5,608 | 0.75% |
| 53 | Society Hill | 1,103 | 0.73% |
| 54 | Egg Harbor City | 1,388 | 0.72% |
| 55 | Hoboken | 25,132 | 0.68% |
| 56 | Ridgefield Park | 4,761 | 0.67% |
| 57 | West New York | 19,646 | 0.65% |
| 58 | Dumont | 6,373 | 0.63% |
| 59 | Linden | 14,434 | 0.6% |
| 60 | Wildwood | 2,367 | 0.59% |
| 61 | Green Knoll | 2,446 | 0.57% |
| 62 | White Horse | 3,504 | 0.57% |
| 63 | Union City | 24,147 | 0.56% |
| 64 | Barclay | 1,465 | 0.55% |
| 65 | Cherry Hill Mall | 5,175 | 0.54% |
| 66 | Bayonne | 24,975 | 0.54% |
| 67 | Matawan | 3,425 | 0.53% |
| 68 | Somerset | 8,946 | 0.47% |
| 69 | Ridgewood | 8,337 | 0.43% |
| 70 | Ventnor City | 4,196 | 0.43% |
| 71 | Toms River | 33,591 | 0.43% |
| 72 | Bridgeton | 6,346 | 0.41% |
| 73 | Linwood | 2,491 | 0.4% |
| 74 | Bound Brook | 3,527 | 0.4% |
| 75 | Woodbridge | 7,111 | 0.39% |
| 76 | South River | 5,590 | 0.39% |
| 77 | Hackensack | 18,732 | 0.37% |
| 78 | Point Pleasant | 7,416 | 0.35% |
| 79 | Millville | 10,959 | 0.35% |
| 80 | Phillipsburg | 5,795 | 0.35% |
| 81 | Kearny | 13,581 | 0.32% |
| 82 | Long Branch | 11,896 | 0.32% |
| 83 | Hawthorne | 6,963 | 0.32% |
| 84 | Fair Lawn | 11,463 | 0.31% |
| 85 | Fort Lee | 17,004 | 0.31% |
| 86 | Clifton | 29,169 | 0.3% |
| 87 | Perth Amboy | 15,946 | 0.28% |
| 88 | Harrison | 5,873 | 0.27% |
| 89 | East Orange | 23,608 | 0.27% |
| 90 | Sayreville | 16,461 | 0.27% |
| 91 | Newark | 96,888 | 0.25% |
| 92 | Upper Montclair | 3,985 | 0.25% |
| 93 | Atlantic City | 15,272 | 0.25% |
| 94 | Englewood | 10,648 | 0.24% |
| 95 | Leonia | 3,338 | 0.24% |
| 96 | South Amboy | 3,395 | 0.24% |
| 97 | New Brunswick | 14,893 | 0.21% |
| 98 | Paterson | 44,748 | 0.2% |
| 99 | Springdale | 5,071 | 0.2% |
| 100 | Trenton | 27,401 | 0.2% |