
Since the 1950s ended, most of America has let its guard down and people have become a whole lot kinkier.
Searches for sex online are at an all-time high, and with sexting, flexting, and every other new way of communicating our desires online, it’s pretty clear that we can’t get enough.
Whether we want to admit it or not.
Which of the places in Illinois are the kinkiest? We can tell by looking at who is buying the most ‘kinky’ stuff online.
Based on the number of purchases from Adam & Eve per capita, we came up with this list as the 10 kinkiest cities in the Prairie State.
Table Of Contents: Top Ten | Methodology | Table
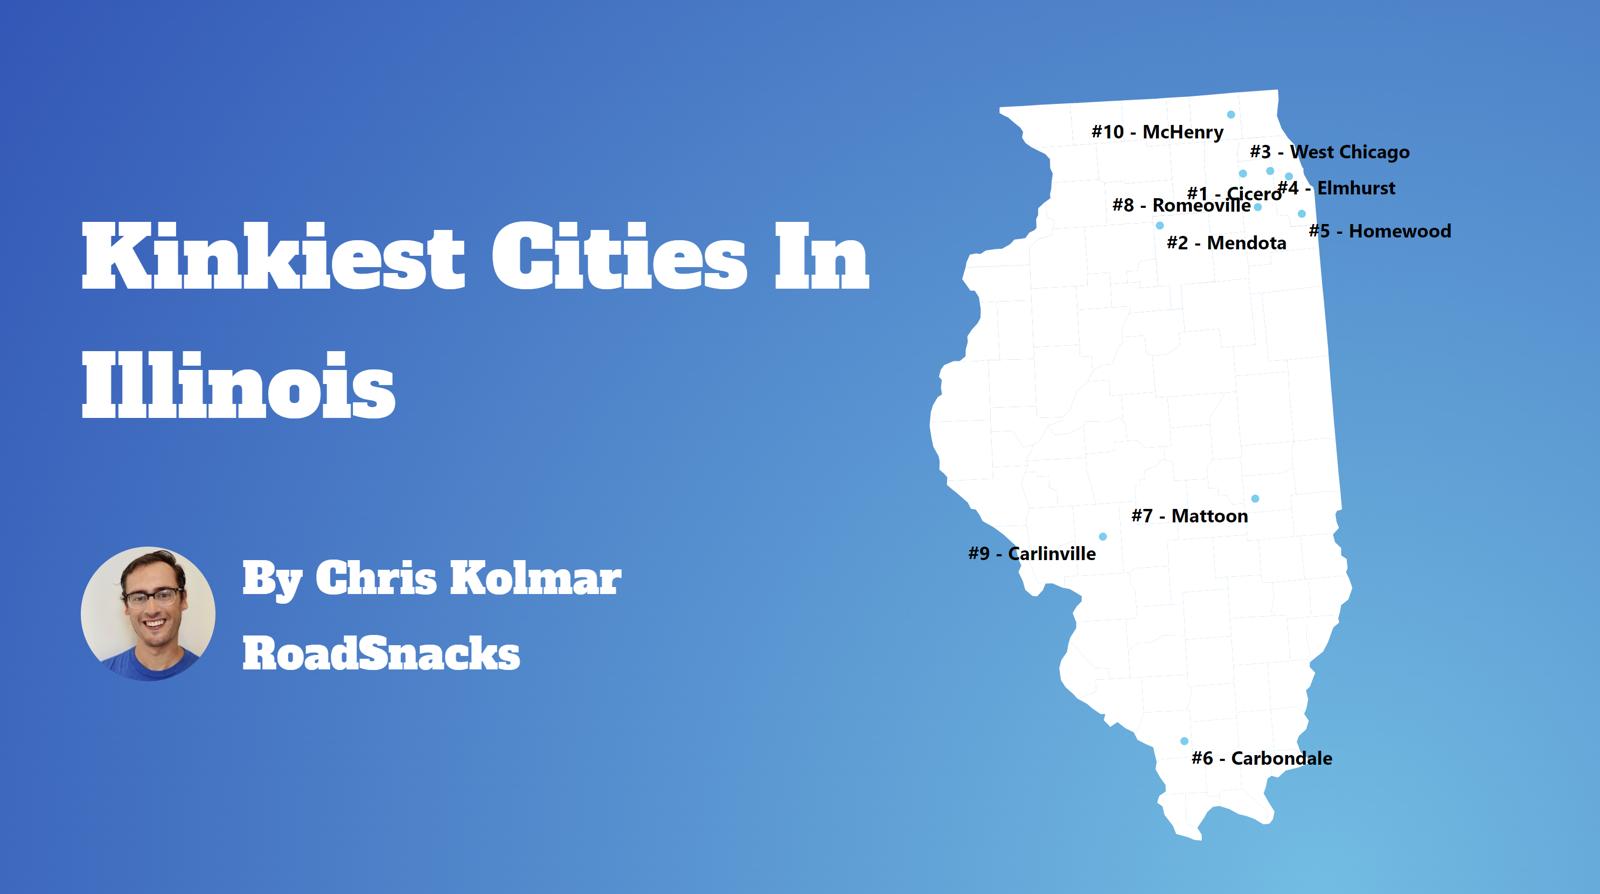
The 10 Kinkiest Cities In Illinois For 2025
- Cicero (0.07 orders per capita)
- Mendota (0.05 orders per capita)
- West Chicago (0.04 orders per capita)
- Elmhurst (0.04 orders per capita)
- Homewood (0.04 orders per capita)
- Carbondale (0.03 orders per capita)
- Mattoon (0.03 orders per capita)
- Romeoville(0.02 orders per capita)
- Carlinville
- McHenry (0.02 orders per capita)
Are these a surprise? We don’t live in Illinois, so you guys decide whether or not these cities make sense. But, either way, the data is 100% truth.
We also have some honorable mention cities as well. We’ll get to those later. And if you’re wondering, we can also tell who the least kinky cities in Illinois are, too.
For more Illinois reading, check out:
Methodology: How We Measured The Most Historically Racist Places In The Prairie State
n order to rank the how kinky a city is, we simply had to see which cities in Illinois purchased the most sex toys from online erotic adult toy and novelty powerhouse Adam & Eve. They provided us with purchase information in 2015.
It’s pretty easy to figure it out, actually, when you know the cities in Illinois are buying adult toys.
Saturday Night Science at it’s finest as there’s no beter way than to solve this argument at a bar.
We caculated all the data on a per capita basis, meaning these are orders on a per-person basis, not a raw number of total dollars spent or number of orders. That keeps us from ranking the largest cities at the top since they have the most people.
Additionally, we only looked at the 271 places in Illinois with over 5,000 people.
The kinkiest cities in Illinois based on this methodology are Cicero, Mendota, West Chicago, Elmhurst, Homewood, Carbondale, Mattoon, Romeoville, Carlinville, and McHenry.
For more Illinois reading, check out:
- Cheapest Places To Live In Illinois
- Most Dangerous Cities In Illinois
- Richest Cities In Illinois
- Safest Places In Illinois
- Worst Places To Live In Illinois
- Most Expensive Places To Live In Illinois
Kinkiest Cities In Illinois For 2025
| Rank | City | Population | Orders Per Capita |
|---|---|---|---|
| 1 | Cicero, IL | 83,223.0 | 0.07 |
| 2 | Mendota, IL | 6,915.0 | 0.05 |
| 3 | West Chicago, IL | 25,434.0 | 0.04 |
| 4 | Elmhurst, IL | 45,538.0 | 0.04 |
| 5 | Homewood, IL | 19,471.0 | 0.04 |
| 6 | Carbondale, IL | 21,813.0 | 0.03 |
| 7 | Mattoon, IL | 16,334.0 | 0.03 |
| 8 | Romeoville, IL | 40,996.0 | 0.02 |
| 9 | Carlinville, IL | 5,574.0 | 0.02 |
| 10 | Mchenry, IL | 27,774.0 | 0.02 |
| 11 | North Chicago, IL | 30,772.0 | 0.02 |
| 12 | Moline, IL | 42,235.0 | 0.02 |
| 13 | Algonquin, IL | 29,904.0 | 0.02 |
| 14 | Dekalb, IL | 40,464.0 | 0.02 |
| 15 | Mount Vernon, IL | 14,492.0 | 0.02 |
| 16 | Taylorville, IL | 11,149.0 | 0.01 |
| 17 | Belleville, IL | 41,722.0 | 0.01 |
| 18 | Charleston, IL | 17,212.0 | 0.01 |
| 19 | Waterloo, IL | 11,055.0 | 0.01 |
| 20 | Rolling Meadows, IL | 23,981.0 | 0.01 |
| 21 | Mount Prospect, IL | 55,648.0 | 0.01 |
| 22 | Chicago, IL | 2,707,648.0 | 0.01 |
| 23 | Roscoe, IL | 10,881.0 | 0.01 |
| 24 | Morton Grove, IL | 24,687.0 | 0.01 |
| 25 | Macomb, IL | 15,006.0 | 0.01 |
| 26 | Bloomington, IL | 78,703.0 | 0.01 |
| 27 | Murphysboro, IL | 6,804.0 | 0.01 |
| 28 | Jerseyville, IL | 7,432.0 | 0.01 |
| 29 | Bethalto, IL | 9,244.0 | 0.01 |
| 30 | Hickory Hills, IL | 14,718.0 | 0.01 |
| 31 | Decatur, IL | 70,368.0 | 0.01 |
| 32 | O’fallon, IL | 32,139.0 | 0.01 |
| 33 | Du Quoin, IL | 5,780.0 | 0.01 |
| 34 | Pekin, IL | 31,812.0 | 0.01 |
| 35 | Normal, IL | 52,908.0 | 0.01 |
| 36 | Champaign, IL | 88,822.0 | 0.01 |
| 37 | East Peoria, IL | 22,485.0 | 0.01 |
| 38 | Sugar Grove, IL | 9,233.0 | 0.01 |
| 39 | Geneseo, IL | 6,577.0 | 0.01 |
| 40 | Kankakee, IL | 24,384.0 | 0.01 |
| 41 | Greenville, IL | 7,159.0 | 0.01 |
| 42 | Ottawa, IL | 18,714.0 | 0.01 |
| 43 | Rockford, IL | 147,649.0 | 0.01 |
| 44 | Pontiac, IL | 11,483.0 | 0.01 |
| 45 | Danville, IL | 28,663.0 | 0.01 |
| 46 | Lemont, IL | 17,643.0 | 0.01 |
| 47 | Mahomet, IL | 9,755.0 | 0.01 |
| 48 | Genoa, IL | 5,685.0 | 0.01 |
| 49 | Olney, IL | 8,864.0 | 0.01 |
| 50 | Collinsville, IL | 24,126.0 | 0.01 |
| 51 | Herrin, IL | 12,271.0 | 0.0 |
| 52 | Lincoln, IL | 13,406.0 | 0.0 |
| 53 | Highland, IL | 10,268.0 | 0.0 |
| 54 | Harvard, IL | 9,875.0 | 0.0 |
| 55 | Litchfield, IL | 6,814.0 | 0.0 |
| 56 | Oak Brook, IL | 8,028.0 | 0.0 |
| 57 | Granite City, IL | 26,670.0 | 0.0 |
| 58 | Effingham, IL | 12,258.0 | 0.0 |
| 59 | Harrisburg, IL | 8,608.0 | 0.0 |
| 60 | Freeport, IL | 23,636.0 | 0.0 |
| 61 | Rantoul, IL | 12,515.0 | 0.0 |
| 62 | Edwardsville, IL | 26,543.0 | 0.0 |
| 63 | Peoria, IL | 112,126.0 | 0.0 |
| 64 | Elk Grove Village, IL | 32,132.0 | 0.0 |
| 65 | Fairview Heights, IL | 16,255.0 | 0.0 |
| 66 | Rock Island, IL | 36,758.0 | 0.0 |
| 67 | Coal City, IL | 5,145.0 | 0.0 |
| 68 | Marion, IL | 16,796.0 | 0.0 |
| 69 | Naperville, IL | 149,424.0 | 0.0 |
| 70 | Galesburg, IL | 29,653.0 | 0.0 |
| 71 | Chillicothe, IL | 6,185.0 | 0.0 |
| 72 | Jacksonville, IL | 17,490.0 | 0.0 |
| 73 | Glen Carbon, IL | 13,521.0 | 0.0 |
| 74 | Springfield, IL | 113,714.0 | 0.0 |
| 75 | Salem, IL | 7,341.0 | 0.0 |
| 76 | Maryville, IL | 8,280.0 | 0.0 |
| 77 | Quincy, IL | 39,188.0 | 0.0 |
| 78 | Dixon, IL | 15,166.0 | 0.0 |
| 79 | Belvidere, IL | 24,510.0 | 0.0 |
| 80 | South Beloit, IL | 7,930.0 | 0.0 |
| 81 | Wood River, IL | 10,315.0 | 0.0 |
| 82 | Clinton, IL | 7,012.0 | 0.0 |
| 83 | East Moline, IL | 20,837.0 | 0.0 |
| 84 | Itasca, IL | 9,525.0 | 0.0 |
| 85 | Marengo, IL | 7,123.0 | 0.0 |
| 86 | Alton, IL | 25,430.0 | 0.0 |
| 87 | Colona, IL | 5,189.0 | 0.0 |
| 88 | Minooka, IL | 12,632.0 | 0.0 |
| 89 | Hoopeston, IL | 5,039.0 | 0.0 |
| 90 | Pinckneyville, IL | 5,055.0 | 0.0 |
| 91 | Elburn, IL | 6,054.0 | 0.0 |
| 92 | Paris, IL | 8,154.0 | 0.0 |
| 93 | East Alton, IL | 5,729.0 | 0.0 |
| 94 | Urbana, IL | 38,447.0 | 0.0 |
| 95 | Round Lake, IL | 18,588.0 | 0.0 |
| 96 | Crete, IL | 8,382.0 | 0.0 |
| 97 | Metropolis, IL | 5,898.0 | 0.0 |
| 98 | Centralia, IL | 12,009.0 | 0.0 |
| 99 | Robinson, IL | 7,005.0 | 0.0 |
| 100 | Geneva, IL | 21,299.0 | 0.0 |