
Most African American cities in Alabama research summary. We used Saturday Night Science to analyze Alabama’s most recent Census data to determine the blackest cities in Alabama based on the percentage of Black residents. Here are the results of our analysis:
-
The city with the largest African American population in Alabama is Fairfield based on the most recent Census data.
-
Fairfield is 90.54% Black.
-
The least African American city in Alabama is Mountain Brook.
-
Mountain Brook is 0.43% Black.
-
Alabama is 25.9% Black.
-
Alabama is the 5th blackest state in the United States.
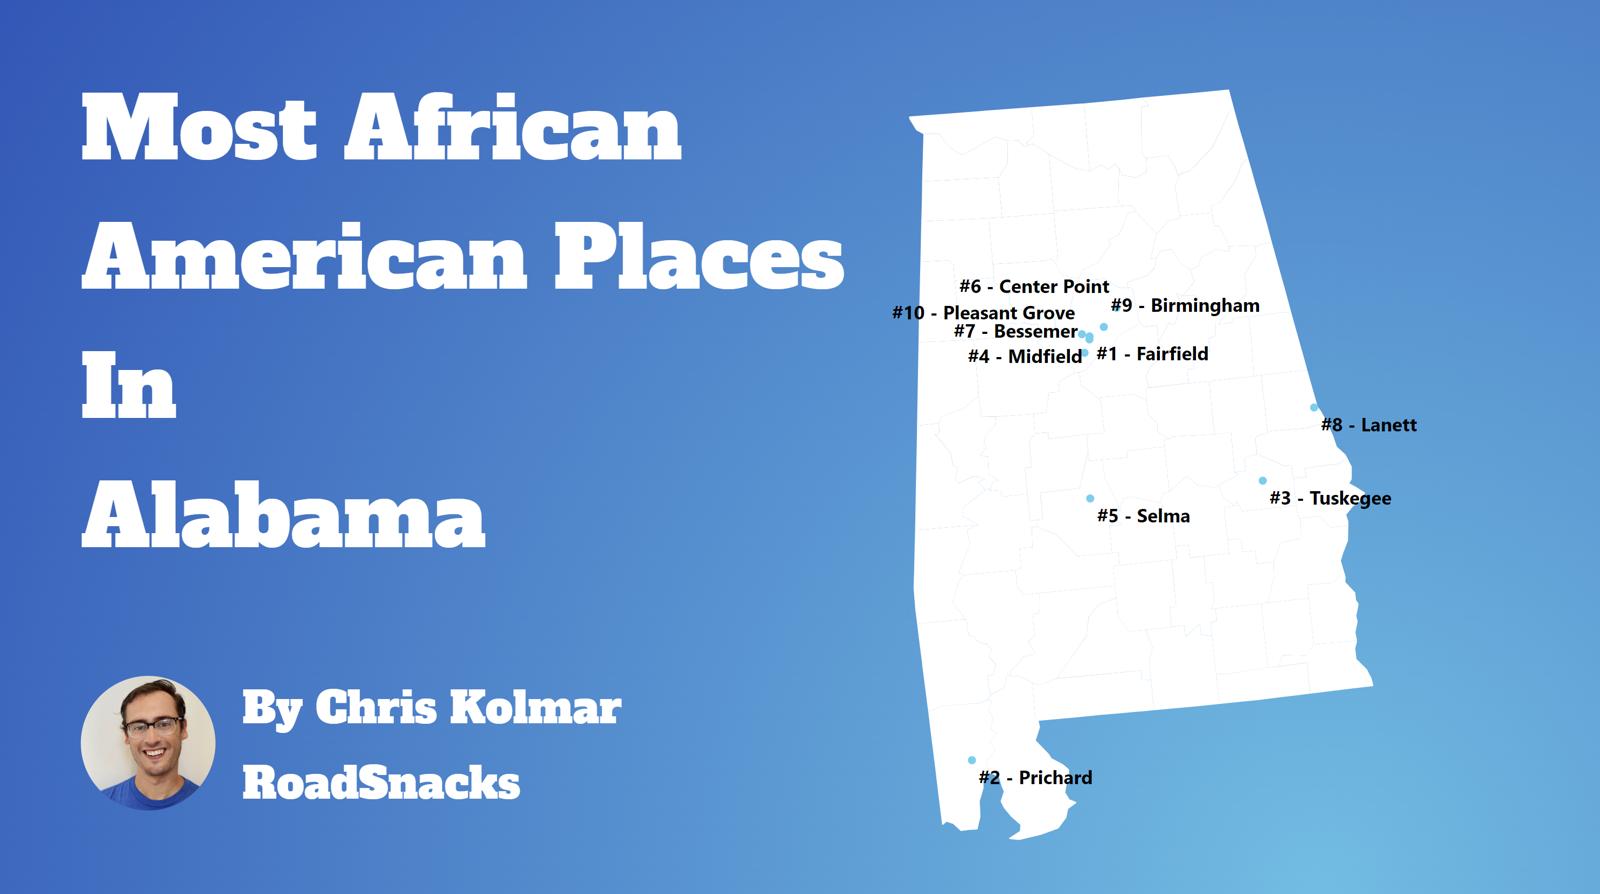
Table Of Contents: Top Ten | Methodology | Summary | Table
The Black community is one of the fastest-growing communities in America this decade.
Roughly 42 million people identifying as Black or African American live in the United States, making up 12% of the total population. According to the most recent American Community Survey, the Black population in Alabama is 1,310,256 – at 25.9% of the total population of Alabama.
The percentage growth of Blacks in America is the third largest percentage change for any race according to the Census’s race and ethnicity definition. Most scholars and historians agree that increasing diversity in America is a good thing.
We agree.
But how has the increase in the black population impacted Alabama? Which cities and towns in Alabama have seen the greatest increase in its Black population?
We broke down the most recent census data to determine the cities in Alabama with the largest African American population in 2025:
Most African American Places In Alabama
What’s the blackest city in Alabama? The city with the largest Black population in Alabama for 2025 is Fairfield. See if Fairfield ranked as one of the most african american places in America.
And if you already knew these places were Black, check out the best places to live in Alabama or the most diverse places in Alabama.
The 10 Blackest Cities In Alabama For 2025
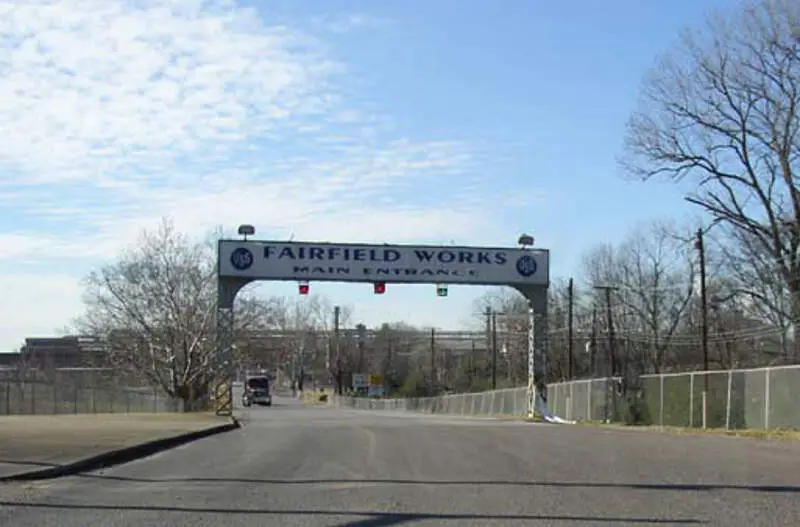
1. Fairfield
/10
Population: 9,846
% African American: 90.54%
# Of African American Residents: 8,915
Percent Change Since 2010: -13.85%
More on Fairfield: Data
2. Prichard
/10
Population: 19,121
% African American: 88.75%
# Of African American Residents: 16,969
Percent Change Since 2010: -14.4%
More on Prichard: Data
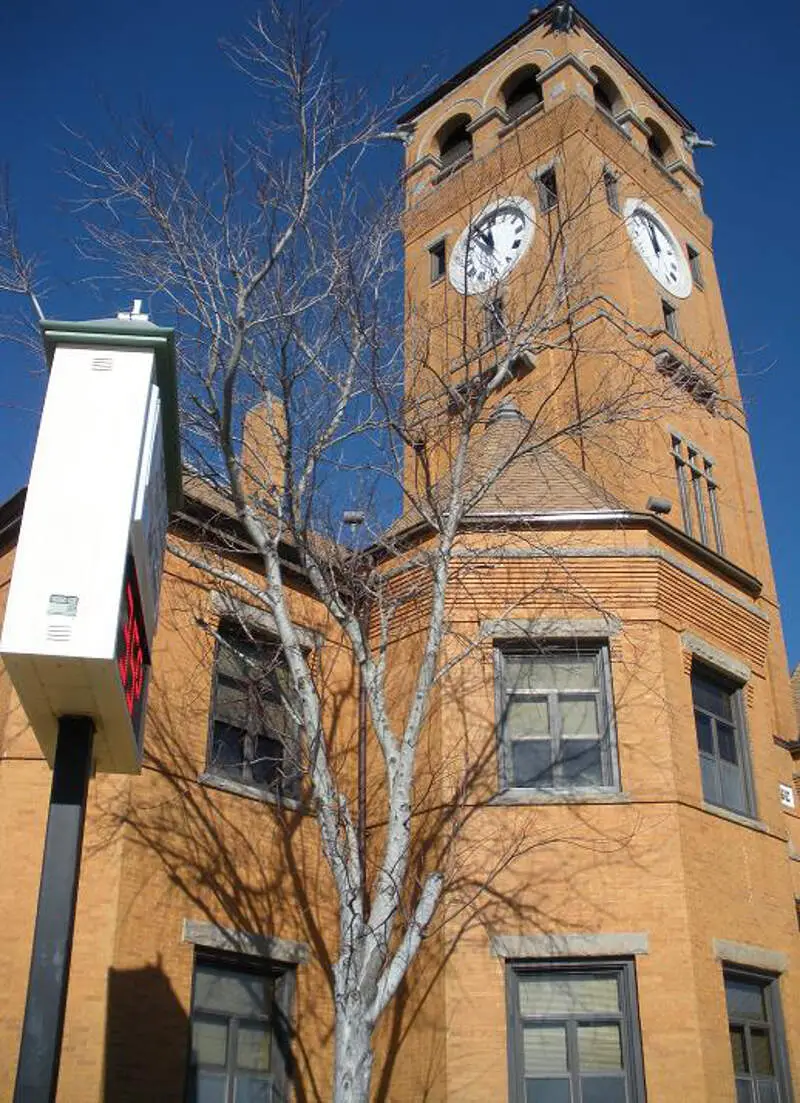
3. Tuskegee
/10
Population: 9,070
% African American: 84.86%
# Of African American Residents: 7,697
Percent Change Since 2010: -21.2%
More on Tuskegee: Data
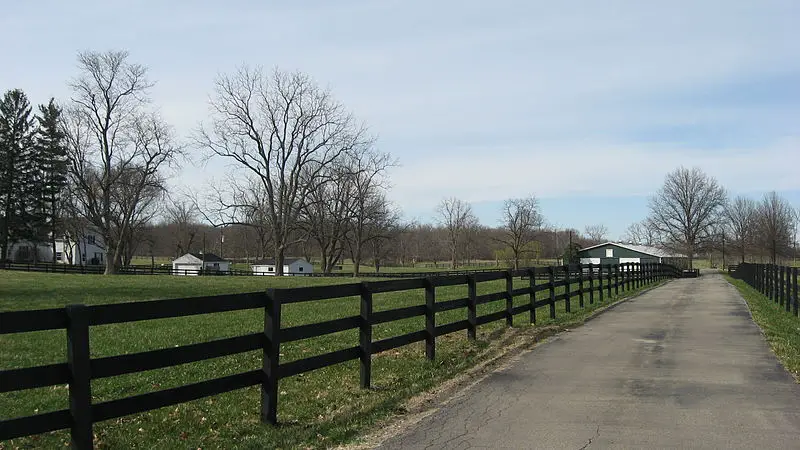
4. Midfield
/10
Population: 5,101
% African American: 82.63%
# Of African American Residents: 4,215
Percent Change Since 2010: 9.31%
More on Midfield: Data
5. Selma
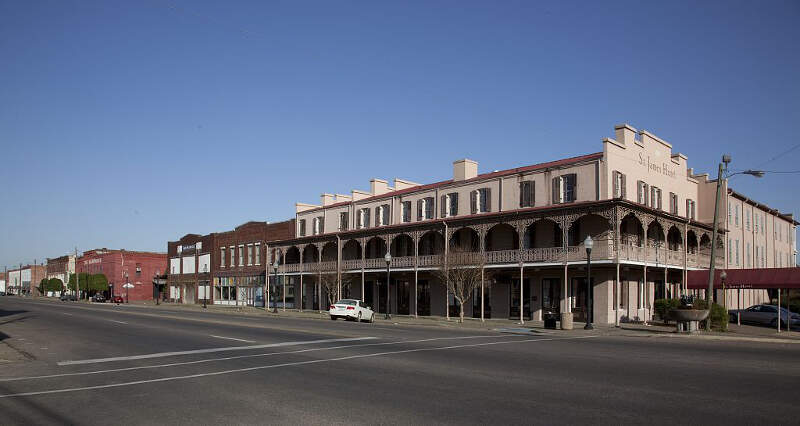
/10
Population: 17,442
% African American: 80.97%
# Of African American Residents: 14,122
Percent Change Since 2010: -11.94%
More on Selma: Data
6. Center Point
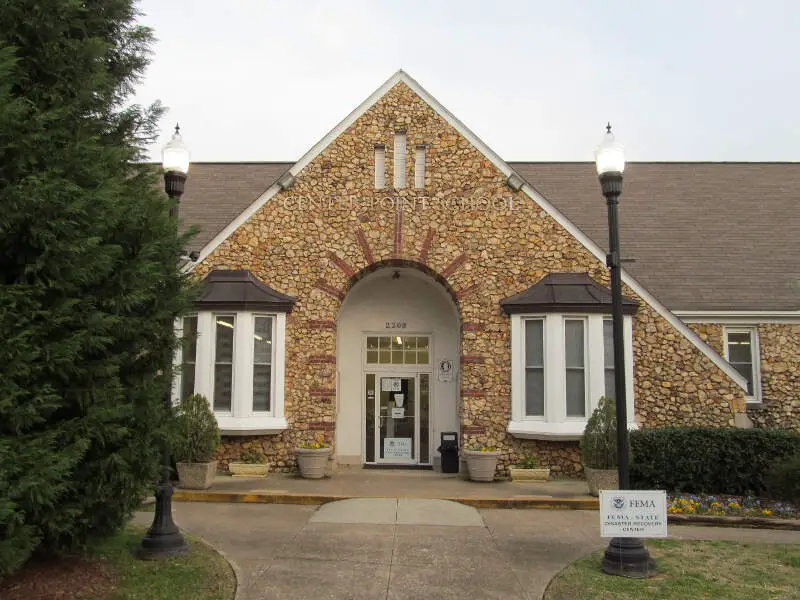
/10
Population: 16,125
% African American: 71.89%
# Of African American Residents: 11,592
Percent Change Since 2010: 11.22%
More on Center Point: Data
7. Bessemer
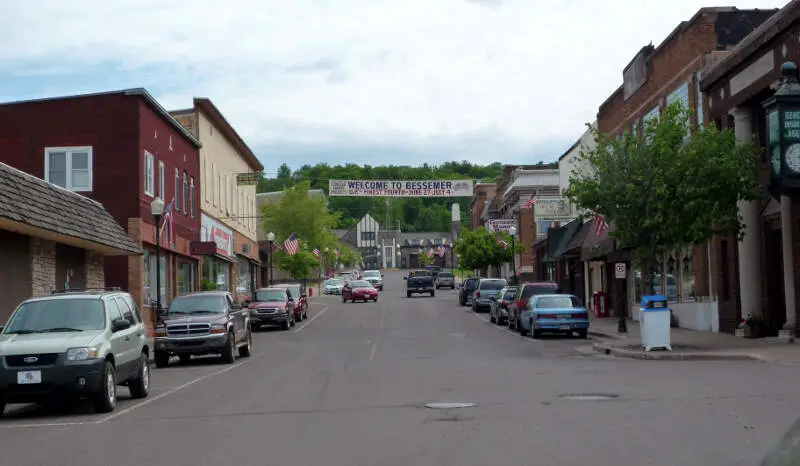
/10
Population: 25,655
% African American: 70.56%
# Of African American Residents: 18,103
Percent Change Since 2010: -12.37%
More on Bessemer: Data
8. Lanett
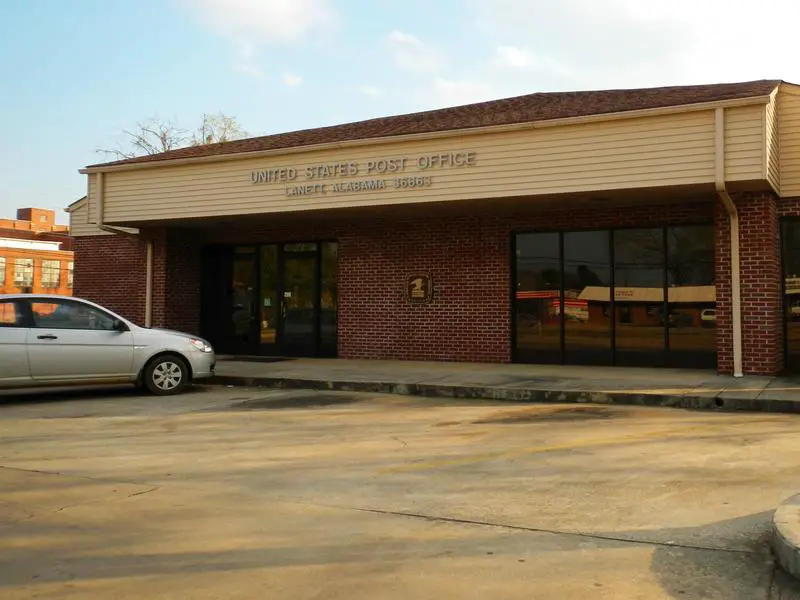
/10
Population: 6,854
% African American: 68.3%
# Of African American Residents: 4,681
Percent Change Since 2010: 15.1%
More on Lanett: Data
9. Pleasant Grove
/10
Population: 9,502
% African American: 67.91%
# Of African American Residents: 6,453
Percent Change Since 2010: 35.62%
More on Pleasant Grove: Data
10. Birmingham
/10
Population: 199,322
% African American: 66.94%
# Of African American Residents: 133,420
Percent Change Since 2010: -16.41%
More on Birmingham: Data
Methodology: How We Determined The Cities In Alabama With The Largest Black Population For 2025
We still believe in the accuracy of data — especially from the Census. So that’s where we went to get the race breakdown across Alabama.
That leads us to the Census’s most recently available data, the 2019-2023 American Community Survey data from the US Census.
Specifically, we looked at table B03002: Hispanic OR LATINO ORIGIN BY RACE. Here are the category names as defined by the Census:
- Hispanic or Latino
- White alone*
- Black or African American alone*
- American Indian and Alaska Native alone*
- Asian alone*
- Native Hawaiian and Other Pacific Islander alone*
- Some other race alone*
- Two or more races*
Our particular column of interest was the number of people who identified as Black or African American.
We limited our analysis to non-CDPs with a population greater than 5,000 people in Alabama. That left us with 101 cities.
We then calculated the percentage of residents that are Black or African American. The percentages ranked from 90.5% to 0.4%.
Finally, we ranked each city based on the percentage of the Black population, with a higher score being more Black than a lower score. Fairfield took the distinction of being the most Black, while Mountain Brook was the least African American city.
We updated this article for 2025. This is our tenth time ranking the cities in Alabama with the largest African American population.
Read on for more information on how the cities in Alabama ranked by population of African American residents or, for a more general take on diversity in America, head over to our ranking of the most diverse cities in America.
Summary: Black Populations Across Alabama
If you’re looking for a breakdown of African American populations across Alabama according to the most recent data, this is an accurate list.
The blackest cities in Alabama are Fairfield, Prichard, Tuskegee, Midfield, Selma, Center Point, Bessemer, Lanett, Pleasant Grove, and Birmingham.
If you’re curious enough, here are the least African American places in Alabama:
- Mountain Brook
- Cullman
- Arab
For more Alabama reading, check out:
African American Population By City In Alabama
| Rank | City | Population | African American Population | % African American |
|---|---|---|---|---|
| 1 | Fairfield | 9,846 | 8,915 | 90.54% |
| 2 | Prichard | 19,121 | 16,969 | 88.75% |
| 3 | Tuskegee | 9,070 | 7,697 | 84.86% |
| 4 | Midfield | 5,101 | 4,215 | 82.63% |
| 5 | Selma | 17,442 | 14,122 | 80.97% |
| 6 | Center Point | 16,125 | 11,592 | 71.89% |
| 7 | Bessemer | 25,655 | 18,103 | 70.56% |
| 8 | Lanett | 6,854 | 4,681 | 68.3% |
| 9 | Pleasant Grove | 9,502 | 6,453 | 67.91% |
| 10 | Birmingham | 199,322 | 133,420 | 66.94% |
| 11 | Montgomery | 198,440 | 124,570 | 62.77% |
| 12 | Greenville | 7,229 | 4,495 | 62.18% |
| 13 | Monroeville | 5,875 | 3,601 | 61.29% |
| 14 | Atmore | 8,389 | 4,581 | 54.61% |
| 15 | Chickasaw | 6,367 | 3,471 | 54.52% |
| 16 | Talladega | 15,041 | 8,046 | 53.49% |
| 17 | Mobile | 185,097 | 97,626 | 52.74% |
| 18 | Tarrant | 6,014 | 3,071 | 51.06% |
| 19 | Anniston | 21,377 | 10,493 | 49.09% |
| 20 | Phenix City | 38,477 | 17,554 | 45.62% |
| 21 | Demopolis | 7,010 | 3,187 | 45.46% |
| 22 | Eufaula | 12,664 | 5,721 | 45.18% |
| 23 | Tuscaloosa | 107,699 | 45,986 | 42.7% |
| 24 | Roanoke | 5,332 | 2,262 | 42.42% |
| 25 | Pinson | 7,851 | 3,330 | 42.41% |
| 26 | Bay Minette | 8,215 | 3,399 | 41.38% |
| 27 | Troy | 17,733 | 7,234 | 40.79% |
| 28 | Hueytown | 16,541 | 6,593 | 39.86% |
| 29 | Clay | 10,288 | 4,054 | 39.41% |
| 30 | Valley | 10,406 | 3,900 | 37.48% |
| 31 | Gadsden | 33,617 | 12,355 | 36.75% |
| 32 | Opelika | 31,944 | 11,616 | 36.36% |
| 33 | Dothan | 71,118 | 25,223 | 35.47% |
| 34 | Fultondale | 9,753 | 3,415 | 35.01% |
| 35 | Ozark | 14,348 | 4,719 | 32.89% |
| 36 | Calera | 17,188 | 5,516 | 32.09% |
| 37 | Alexander City | 14,686 | 4,631 | 31.53% |
| 38 | Sylacauga | 12,388 | 3,857 | 31.13% |
| 39 | Smiths Station | 5,443 | 1,689 | 31.03% |
| 40 | Wetumpka | 7,182 | 2,139 | 29.78% |
| 41 | Huntsville | 218,814 | 64,432 | 29.45% |
| 42 | Irondale | 13,462 | 3,948 | 29.33% |
| 43 | Brewton | 5,232 | 1,463 | 27.96% |
| 44 | Pike Road | 10,103 | 2,751 | 27.23% |
| 45 | Northport | 30,991 | 8,194 | 26.44% |
| 46 | Sheffield | 9,334 | 2,466 | 26.42% |
| 47 | Millbrook | 16,923 | 4,392 | 25.95% |
| 48 | Montevallo | 7,429 | 1,866 | 25.12% |
| 49 | Lincoln | 7,135 | 1,774 | 24.86% |
| 50 | Andalusia | 8,841 | 2,173 | 24.58% |
| 51 | Tuscumbia | 9,084 | 2,038 | 22.44% |
| 52 | Decatur | 57,760 | 12,766 | 22.1% |
| 53 | Jacksonville | 14,345 | 3,154 | 21.99% |
| 54 | Gardendale | 16,110 | 3,530 | 21.91% |
| 55 | Prattville | 38,850 | 8,488 | 21.85% |
| 56 | Enterprise | 28,990 | 5,837 | 20.13% |
| 57 | Hoover | 92,401 | 18,028 | 19.51% |
| 58 | Auburn | 78,738 | 14,684 | 18.65% |
| 59 | Helena | 21,452 | 3,806 | 17.74% |
| 60 | Florence | 41,231 | 7,104 | 17.23% |
| 61 | Athens | 27,474 | 4,703 | 17.12% |
| 62 | Oxford | 22,063 | 3,597 | 16.3% |
| 63 | Robertsdale | 6,985 | 1,122 | 16.06% |
| 64 | Opp | 6,752 | 1,073 | 15.89% |
| 65 | Saraland | 16,304 | 2,497 | 15.32% |
| 66 | Pell City | 13,353 | 2,018 | 15.11% |
| 67 | Alabaster | 33,633 | 4,956 | 14.74% |
| 68 | Leeds | 12,221 | 1,666 | 13.63% |
| 69 | Muscle Shoals | 16,670 | 2,225 | 13.35% |
| 70 | Homewood | 27,697 | 3,629 | 13.1% |
| 71 | Clanton | 8,862 | 1,155 | 13.03% |
| 72 | Pelham | 24,510 | 3,164 | 12.91% |
| 73 | Daphne | 28,673 | 3,669 | 12.8% |
| 74 | Madison | 58,335 | 7,423 | 12.72% |
| 75 | Jasper | 14,480 | 1,644 | 11.35% |
| 76 | Moody | 13,378 | 1,456 | 10.88% |
| 77 | Attalla | 5,829 | 627 | 10.76% |
| 78 | Guntersville | 8,771 | 914 | 10.42% |
| 79 | Trussville | 26,182 | 2,627 | 10.03% |
| 80 | Rainbow City | 10,213 | 978 | 9.58% |
| 81 | Russellville | 10,783 | 1,010 | 9.37% |
| 82 | Hartselle | 15,586 | 1,184 | 7.6% |
| 83 | Hamilton | 6,907 | 523 | 7.57% |
| 84 | Chelsea | 15,731 | 1,163 | 7.39% |
| 85 | Spanish Fort | 10,377 | 707 | 6.81% |
| 86 | Satsuma | 6,784 | 397 | 5.85% |
| 87 | Vestavia Hills | 38,704 | 2,246 | 5.8% |
| 88 | Scottsboro | 15,641 | 790 | 5.05% |
| 89 | Southside | 9,407 | 432 | 4.59% |
| 90 | Foley | 22,330 | 1,022 | 4.58% |
| 91 | Orange Beach | 8,244 | 371 | 4.5% |
| 92 | Oneonta | 6,943 | 269 | 3.87% |
| 93 | Albertville | 22,584 | 788 | 3.49% |
| 94 | Fairhope | 23,360 | 694 | 2.97% |
| 95 | Boaz | 10,847 | 317 | 2.92% |
| 96 | Gulf Shores | 15,785 | 419 | 2.65% |
| 97 | Glencoe | 5,356 | 107 | 2.0% |
| 98 | Fort Payne | 14,886 | 269 | 1.81% |
| 99 | Arab | 8,573 | 98 | 1.14% |
| 100 | Cullman | 18,894 | 171 | 0.91% |