
Most African American cities in Florida research summary. We used Saturday Night Science to analyze Florida’s most recent Census data to determine the blackest cities in Florida based on the percentage of Black residents. Here are the results of our analysis:
-
The city with the largest African American population in Florida is Lauderdale Lakes based on the most recent Census data.
-
Lauderdale Lakes is 82.26% Black.
-
The least African American city in Florida is Neptune Beach.
-
Neptune Beach is 0.0% Black.
-
Florida is 14.8% Black.
-
Florida is the 12th blackest state in the United States.
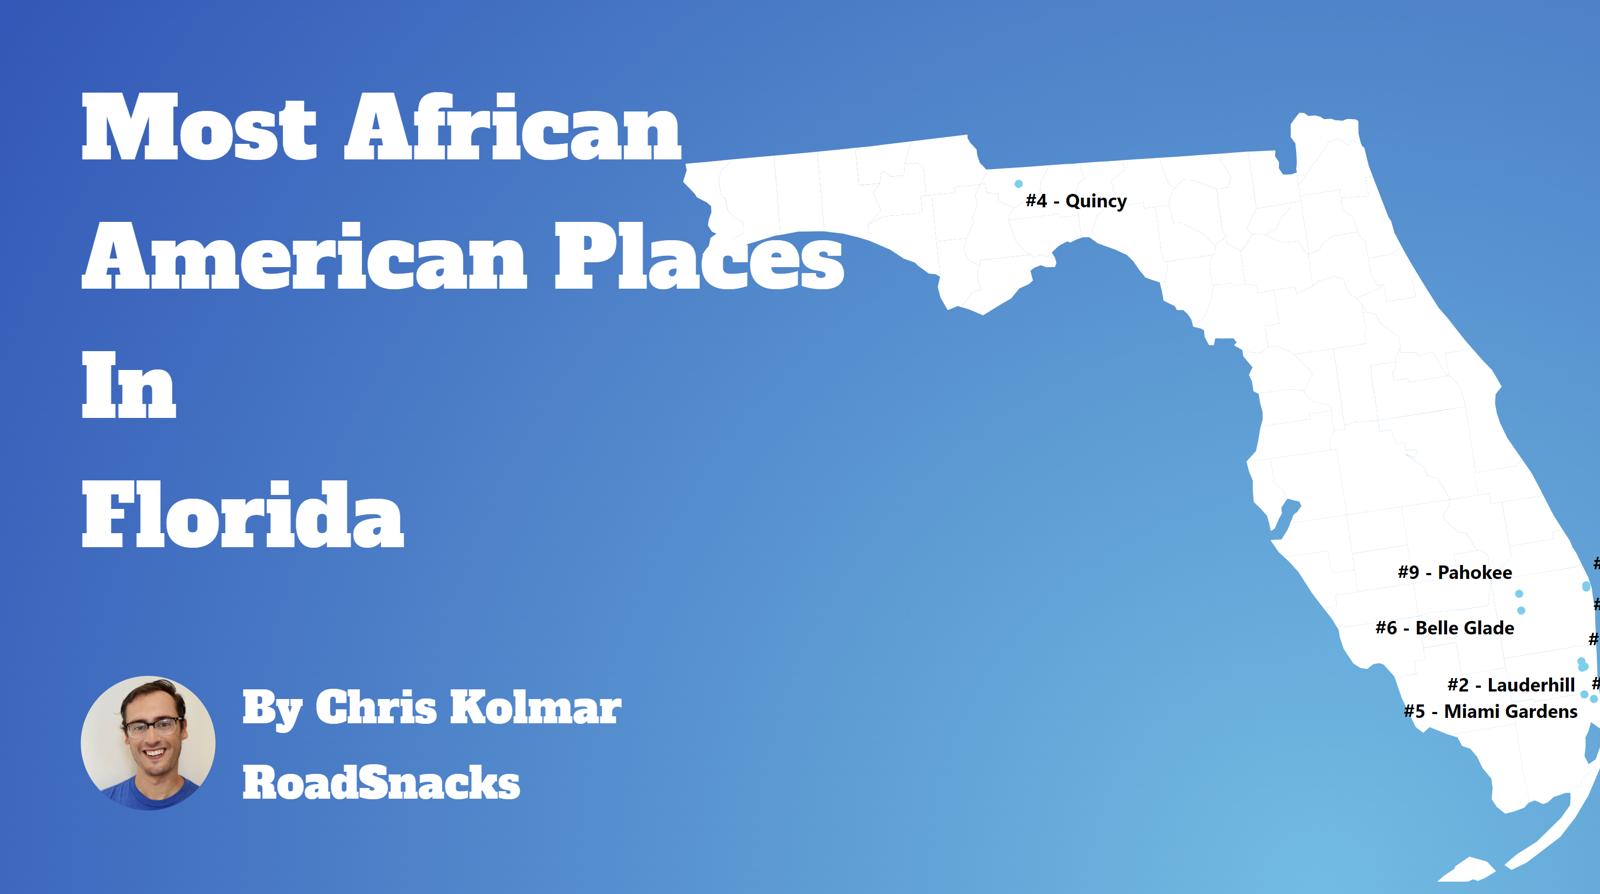
Table Of Contents: Top Ten | Methodology | Summary | Table
The Black community is one of the fastest-growing communities in America this decade.
Roughly 42 million people identifying as Black or African American live in the United States, making up 12% of the total population. According to the most recent American Community Survey, the Black population in Florida is 3,248,401 – at 14.8% of the total population of Florida.
The percentage growth of Blacks in America is the third largest percentage change for any race according to the Census’s race and ethnicity definition. Most scholars and historians agree that increasing diversity in America is a good thing.
We agree.
But how has the increase in the black population impacted Florida? Which cities and towns in Florida have seen the greatest increase in its Black population?
We broke down the most recent census data to determine the cities in Florida with the largest African American population in 2025:
Most African American Places In Florida
What’s the blackest city in Florida? The city with the largest Black population in Florida for 2025 is Lauderdale Lakes. See if Lauderdale Lakes ranked as one of the most african american places in America.
And if you already knew these places were Black, check out the best places to live in Florida or the most diverse places in Florida.
The 10 Blackest Cities In Florida For 2025
1. Lauderdale Lakes

/10
Population: 35,924
% African American: 82.26%
# Of African American Residents: 29,552
Percent Change Since 2010: 14.2%
More on Lauderdale Lakes: Data
2. Lauderhill
/10
Population: 73,961
% African American: 77.47%
# Of African American Residents: 57,297
Percent Change Since 2010: 12.99%
More on Lauderhill: Data
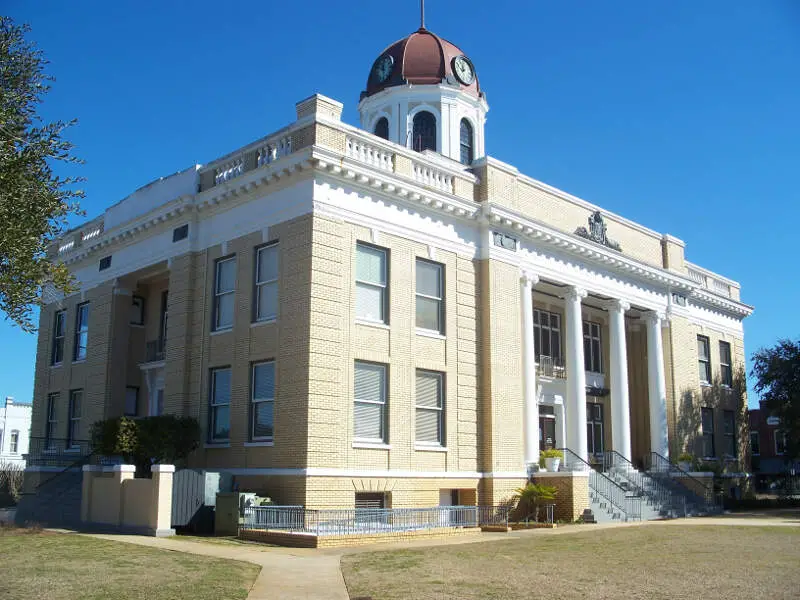
3. Quincy
/10
Population: 7,818
% African American: 64.68%
# Of African American Residents: 5,057
Percent Change Since 2010: -9.11%
More on Quincy: Data
4. Riviera Beach
/10
Population: 38,032
% African American: 63.4%
# Of African American Residents: 24,112
Percent Change Since 2010: 11.68%
More on Riviera Beach: Data
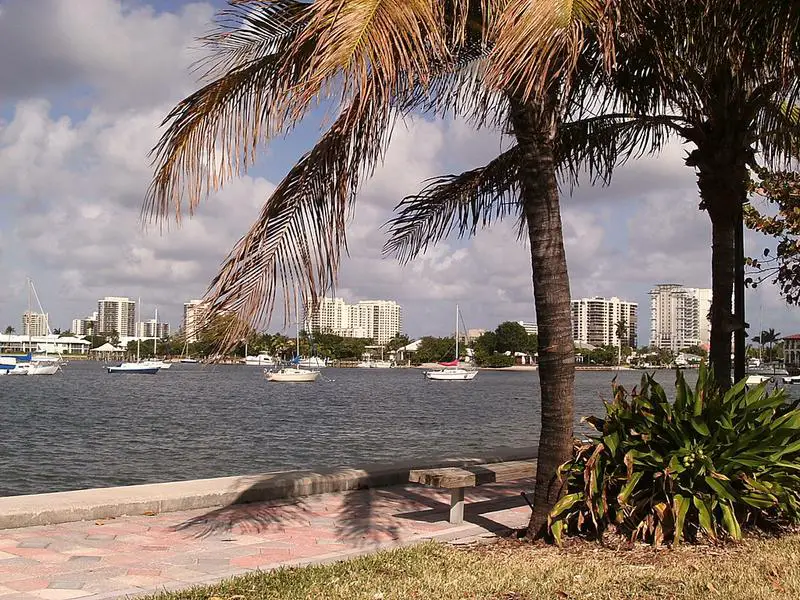
5. Miami Gardens
/10
Population: 111,264
% African American: 61.67%
# Of African American Residents: 68,621
Percent Change Since 2010: -12.58%
More on Miami Gardens: Data
6. North Lauderdale
/10
Population: 44,650
% African American: 57.74%
# Of African American Residents: 25,779
Percent Change Since 2010: 24.52%
More on North Lauderdale: Data
7. Lake Park
/10
Population: 9,005
% African American: 56.54%
# Of African American Residents: 5,091
Percent Change Since 2010: 7.07%
More on Lake Park: Data
8. North Miami
/10
Population: 59,429
% African American: 55.59%
# Of African American Residents: 33,039
Percent Change Since 2010: -4.38%
More on North Miami: Data
9. Belle Glade
/10
Population: 16,818
% African American: 51.91%
# Of African American Residents: 8,731
Percent Change Since 2010: -20.99%
More on Belle Glade: Data
10. Pahokee
/10
Population: 5,539
% African American: 51.72%
# Of African American Residents: 2,865
Percent Change Since 2010: -21.81%
More on Pahokee: Data
Methodology: How We Determined The Cities In Florida With The Largest Black Population For 2025
We still believe in the accuracy of data — especially from the Census. So that’s where we went to get the race breakdown across Florida.
That leads us to the Census’s most recently available data, the 2019-2023 American Community Survey data from the US Census.
Specifically, we looked at table B03002: Hispanic OR LATINO ORIGIN BY RACE. Here are the category names as defined by the Census:
- Hispanic or Latino
- White alone*
- Black or African American alone*
- American Indian and Alaska Native alone*
- Asian alone*
- Native Hawaiian and Other Pacific Islander alone*
- Some other race alone*
- Two or more races*
Our particular column of interest was the number of people who identified as Black or African American.
We limited our analysis to non-CDPs with a population greater than 5,000 people in Florida. That left us with 208 cities.
We then calculated the percentage of residents that are Black or African American. The percentages ranked from 82.3% to 0.0%.
Finally, we ranked each city based on the percentage of the Black population, with a higher score being more Black than a lower score. Lauderdale Lakes took the distinction of being the most Black, while Neptune Beach was the least African American city.
We updated this article for 2025. This is our tenth time ranking the cities in Florida with the largest African American population.
Read on for more information on how the cities in Florida ranked by population of African American residents or, for a more general take on diversity in America, head over to our ranking of the most diverse cities in America.
Summary: Black Populations Across Florida
If you’re looking for a breakdown of African American populations across Florida according to the most recent data, this is an accurate list.
The blackest cities in Florida are Lauderdale Lakes, Lauderhill, Quincy, Riviera Beach, Miami Gardens, North Lauderdale, Lake Park, North Miami, Belle Glade, and Pahokee.
If you’re curious enough, here are the least African American places in Florida:
- Neptune Beach
- Indian Harbour Beach
- Tequesta
For more Florida reading, check out:
- Cheapest Places To Live In Florida
- Worst Places To Live In Florida
- Best Places To Raise A Family In Florida
African American Population By City In Florida
| Rank | City | Population | African American Population | % African American |
|---|---|---|---|---|
| 1 | Lauderdale Lakes | 35,924 | 29,552 | 82.26% |
| 2 | Lauderhill | 73,961 | 57,297 | 77.47% |
| 3 | Quincy | 7,818 | 5,057 | 64.68% |
| 4 | Riviera Beach | 38,032 | 24,112 | 63.4% |
| 5 | Miami Gardens | 111,264 | 68,621 | 61.67% |
| 6 | North Lauderdale | 44,650 | 25,779 | 57.74% |
| 7 | Lake Park | 9,005 | 5,091 | 56.54% |
| 8 | North Miami | 59,429 | 33,039 | 55.59% |
| 9 | Belle Glade | 16,818 | 8,731 | 51.91% |
| 10 | Pahokee | 5,539 | 2,865 | 51.72% |
| 11 | West Park | 15,076 | 7,765 | 51.51% |
| 12 | Pembroke Park | 6,254 | 2,875 | 45.97% |
| 13 | Palatka | 10,558 | 4,668 | 44.21% |
| 14 | Miramar | 135,986 | 59,166 | 43.51% |
| 15 | Opa-Locka | 16,097 | 6,935 | 43.08% |
| 16 | Marianna | 6,815 | 2,902 | 42.58% |
| 17 | Fort Pierce | 48,094 | 20,071 | 41.73% |
| 18 | Florida City | 12,791 | 5,240 | 40.97% |
| 19 | Perry | 6,965 | 2,753 | 39.53% |
| 20 | North Miami Beach | 43,104 | 16,048 | 37.23% |
| 21 | Lantana | 11,845 | 4,274 | 36.08% |
| 22 | Tallahassee | 199,696 | 70,552 | 35.33% |
| 23 | Boynton Beach | 80,601 | 26,959 | 33.45% |
| 24 | Tamarac | 71,887 | 23,997 | 33.38% |
| 25 | Sunrise | 96,633 | 31,861 | 32.97% |
| 26 | Margate | 58,418 | 19,225 | 32.91% |
| 27 | Lake City | 12,404 | 3,940 | 31.76% |
| 28 | Daytona Beach | 75,924 | 23,638 | 31.13% |
| 29 | West Palm Beach | 119,508 | 36,707 | 30.72% |
| 30 | Live Oak | 6,901 | 2,116 | 30.66% |
| 31 | Delray Beach | 66,940 | 19,893 | 29.72% |
| 32 | Jacksonville | 961,739 | 285,137 | 29.65% |
| 33 | Starke | 5,821 | 1,660 | 28.52% |
| 34 | Fort Lauderdale | 183,032 | 52,164 | 28.5% |
| 35 | Pompano Beach | 112,212 | 30,931 | 27.56% |
| 36 | Greenacres | 43,871 | 12,062 | 27.49% |
| 37 | Oakland Park | 44,015 | 12,091 | 27.47% |
| 38 | Apopka | 56,202 | 15,024 | 26.73% |
| 39 | Avon Park | 9,879 | 2,616 | 26.48% |
| 40 | Winter Haven | 52,846 | 13,598 | 25.73% |
| 41 | Sanford | 62,292 | 15,960 | 25.62% |
| 42 | Cocoa | 19,330 | 4,784 | 24.75% |
| 43 | Haines City | 31,156 | 7,665 | 24.6% |
| 44 | Alachua | 10,638 | 2,607 | 24.51% |
| 45 | Deerfield Beach | 86,742 | 21,072 | 24.29% |
| 46 | Royal Palm Beach | 39,089 | 9,493 | 24.29% |
| 47 | Plantation | 94,002 | 22,471 | 23.9% |
| 48 | Coral Springs | 133,962 | 31,535 | 23.54% |
| 49 | Arcadia | 7,571 | 1,770 | 23.38% |
| 50 | Orange Park | 9,062 | 2,105 | 23.23% |
| 51 | Bartow | 19,801 | 4,409 | 22.27% |
| 52 | Leesburg | 28,461 | 6,190 | 21.75% |
| 53 | Orlando | 311,732 | 67,553 | 21.67% |
| 54 | Fort Myers | 91,730 | 19,869 | 21.66% |
| 55 | Ocoee | 47,885 | 10,223 | 21.35% |
| 56 | Crestview | 28,046 | 5,921 | 21.11% |
| 57 | Gainesville | 143,611 | 30,267 | 21.08% |
| 58 | Pensacola | 54,011 | 11,361 | 21.03% |
| 59 | Panama City | 34,211 | 7,171 | 20.96% |
| 60 | Eustis | 23,567 | 4,830 | 20.49% |
| 61 | Pembroke Pines | 170,557 | 34,919 | 20.47% |
| 62 | Tampa | 393,389 | 79,082 | 20.1% |
| 63 | Macclenny | 7,558 | 1,507 | 19.94% |
| 64 | St. Petersburg | 260,646 | 50,042 | 19.2% |
| 65 | Lake Wales | 16,365 | 3,140 | 19.19% |
| 66 | Homestead | 80,725 | 15,483 | 19.18% |
| 67 | Temple Terrace | 26,922 | 5,132 | 19.06% |
| 68 | Dania Beach | 31,739 | 6,022 | 18.97% |
| 69 | Ocala | 64,903 | 12,111 | 18.66% |
| 70 | Port St. Lucie | 220,453 | 40,102 | 18.19% |
| 71 | Callaway | 13,297 | 2,409 | 18.12% |
| 72 | Hallandale Beach | 41,224 | 7,321 | 17.76% |
| 73 | Lakeland | 117,030 | 20,689 | 17.68% |
| 74 | Palm Bay | 125,273 | 21,833 | 17.43% |
| 75 | Altamonte Springs | 45,657 | 7,890 | 17.28% |
| 76 | Springfield | 8,157 | 1,406 | 17.24% |
| 77 | Rockledge | 28,279 | 4,781 | 16.91% |
| 78 | High Springs | 6,396 | 1,047 | 16.37% |
| 79 | Sebring | 11,185 | 1,827 | 16.33% |
| 80 | Groveland | 20,621 | 3,363 | 16.31% |
| 81 | Maitland | 19,268 | 3,125 | 16.22% |
| 82 | Hollywood | 152,935 | 24,630 | 16.1% |
| 83 | Okeechobee | 5,376 | 860 | 16.0% |
| 84 | Green Cove Springs | 9,937 | 1,567 | 15.77% |
| 85 | Coconut Creek | 57,587 | 9,029 | 15.68% |
| 86 | Sarasota | 56,218 | 8,416 | 14.97% |
| 87 | Miami Shores | 11,627 | 1,735 | 14.92% |
| 88 | Auburndale | 17,438 | 2,588 | 14.84% |
| 89 | Plant City | 40,009 | 5,847 | 14.61% |
| 90 | Holly Hill | 13,002 | 1,825 | 14.04% |
| 91 | Dade City | 7,570 | 1,053 | 13.91% |
| 92 | Bradenton | 56,289 | 7,614 | 13.53% |
| 93 | Fort Meade | 5,172 | 695 | 13.44% |
| 94 | Titusville | 49,004 | 6,542 | 13.35% |
| 95 | Parkland | 35,799 | 4,769 | 13.32% |
| 96 | Brooksville | 9,235 | 1,224 | 13.25% |
| 97 | Mount Dora | 16,812 | 2,217 | 13.19% |
| 98 | Clermont | 44,984 | 5,908 | 13.13% |
| 99 | Palmetto | 13,449 | 1,752 | 13.03% |
| 100 | Wildwood | 16,739 | 2,131 | 12.73% |
This would be much more helpful if you also included a summary of average income, home prices, quality of the schools and education levels in each city in your summary. It would be helpful to know what areas board and how integrated the respective towns & surrounding towns might be. I want to know the whole picture demographics when looking into places to live & work or even visit.
Molly, the author has already told you that Diversity is wonderful. What more do you need to know when making a major purchase you alt right bigot?