
Most African American cities in Minnesota research summary. We used Saturday Night Science to analyze Minnesota’s most recent Census data to determine the blackest cities in Minnesota based on the percentage of Black residents. Here are the results of our analysis:
-
The city with the largest African American population in Minnesota is Waite Park based on the most recent Census data.
-
Waite Park is 35.52% Black.
-
The least African American city in Minnesota is New Prague.
-
New Prague is 0.0% Black.
-
Minnesota is 6.9% Black.
-
Minnesota is the 25th blackest state in the United States.
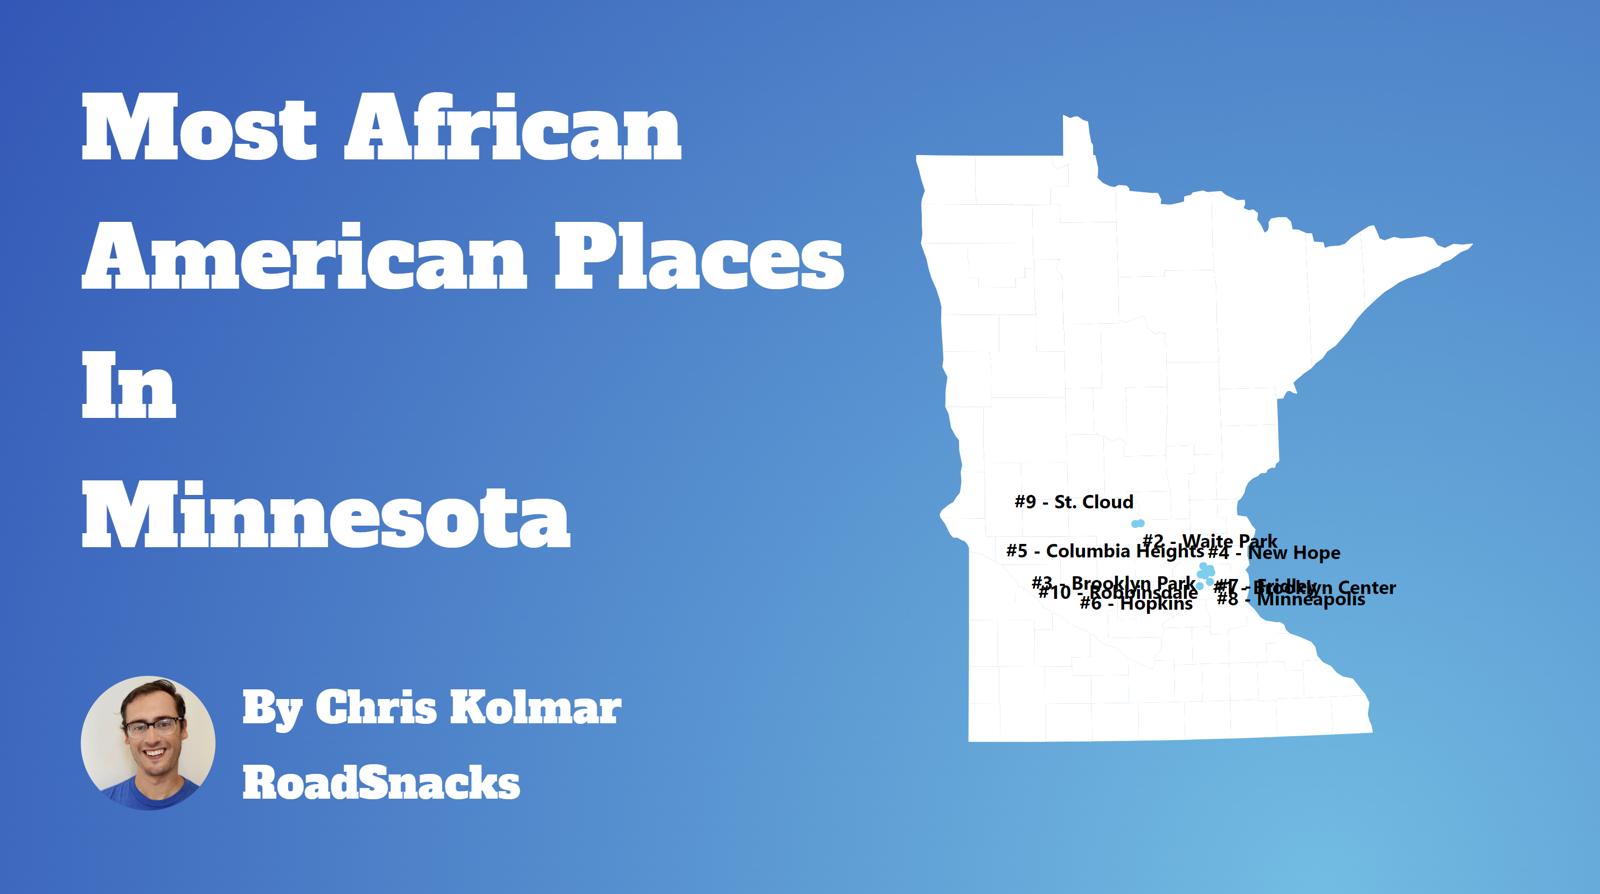
Table Of Contents: Top Ten | Methodology | Summary | Table
The Black community is one of the fastest-growing communities in America this decade.
Roughly 42 million people identifying as Black or African American live in the United States, making up 12% of the total population. According to the most recent American Community Survey, the Black population in Minnesota is 398,881 – at 6.9% of the total population of Minnesota.
The percentage growth of Blacks in America is the third largest percentage change for any race according to the Census’s race and ethnicity definition. Most scholars and historians agree that increasing diversity in America is a good thing.
We agree.
But how has the increase in the black population impacted Minnesota? Which cities and towns in Minnesota have seen the greatest increase in its Black population?
We broke down the most recent census data to determine the cities in Minnesota with the largest African American population in 2026:
Most African American Places In Minnesota
What’s the blackest city in Minnesota? The city with the largest Black population in Minnesota for 2026 is Waite Park. See if Waite Park ranked as one of the most african american places in America.
And if you already knew these places were Black, check out the best places to live in Minnesota or the most diverse places in Minnesota.
The 10 Blackest Cities In Minnesota For 2026
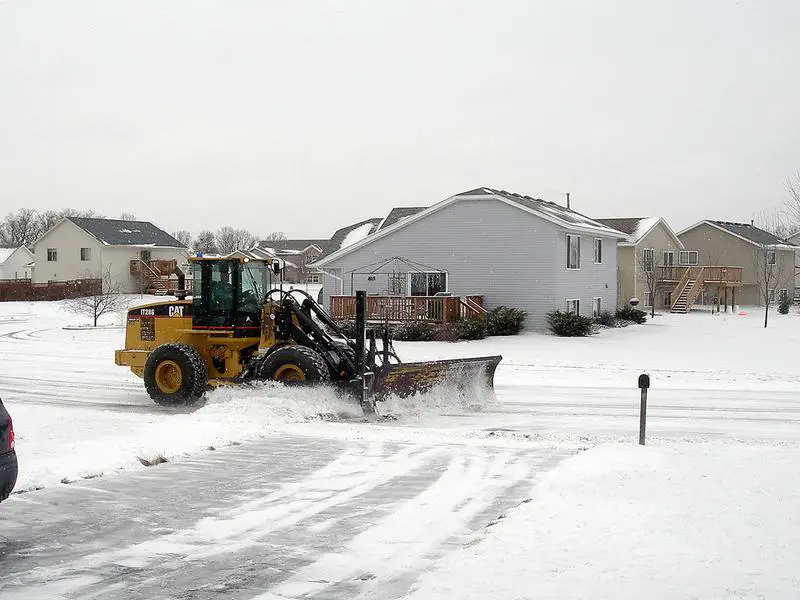
1. Waite Park
/10
Population: 8,399
% African American: 35.52%
# Of African American Residents: 2,983
Percent Change Since 2010: 793.11%
More on Waite Park: Data | Cost Of Living | Movers
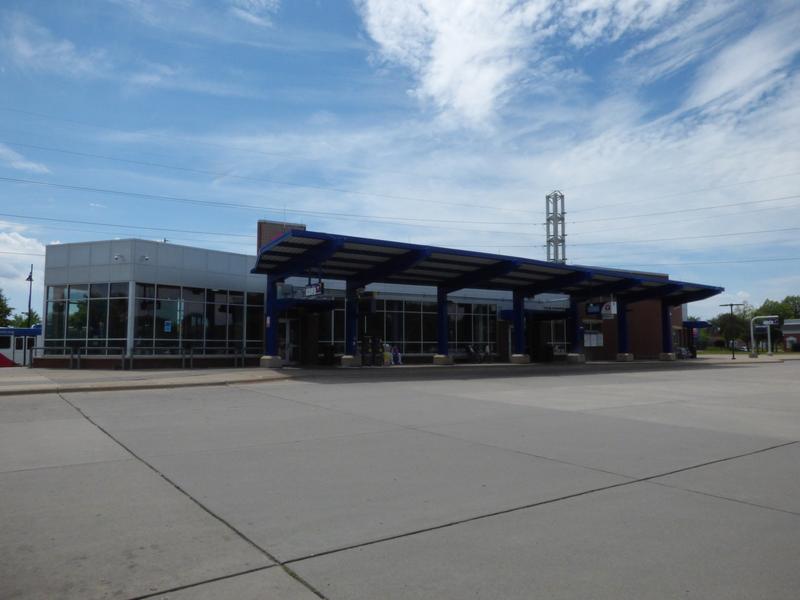
2. Brooklyn Center
/10
Population: 32,479
% African American: 31.34%
# Of African American Residents: 10,179
Percent Change Since 2010: 27.49%
More on Brooklyn Center: Data | Cost Of Living | Movers
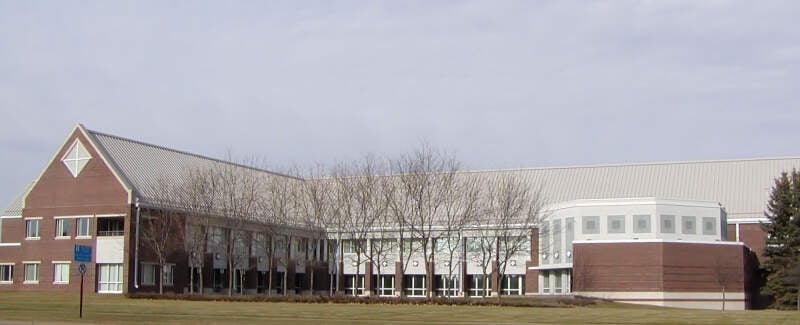
3. Brooklyn Park
/10
Population: 83,876
% African American: 29.73%
# Of African American Residents: 24,935
Percent Change Since 2010: 40.75%
More on Brooklyn Park: Data | Cost Of Living | Movers
4. Columbia Heights
/10
Population: 22,155
% African American: 26.85%
# Of African American Residents: 5,948
Percent Change Since 2010: 109.81%
More on Columbia Heights: Data | Cost Of Living | Movers
5. New Hope
/10
Population: 21,181
% African American: 25.12%
# Of African American Residents: 5,321
Percent Change Since 2010: 178.73%
More on New Hope: Data | Cost Of Living | Movers
6. Hopkins
/10
Population: 18,819
% African American: 20.85%
# Of African American Residents: 3,923
Percent Change Since 2010: 63.05%
More on Hopkins: Data | Cost Of Living | Movers
7. Fridley
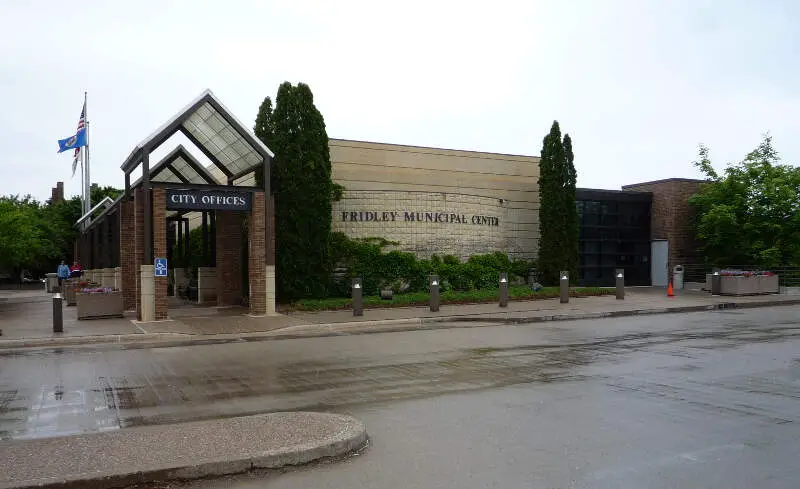
/10
Population: 30,241
% African American: 20.41%
# Of African American Residents: 6,172
Percent Change Since 2010: 126.33%
More on Fridley: Data | Cost Of Living | Movers
8. St. Cloud
/10
Population: 70,629
% African American: 19.74%
# Of African American Residents: 13,944
Percent Change Since 2010: 205.86%
More on St. Cloud: Data | Cost Of Living | Movers
9. Minneapolis
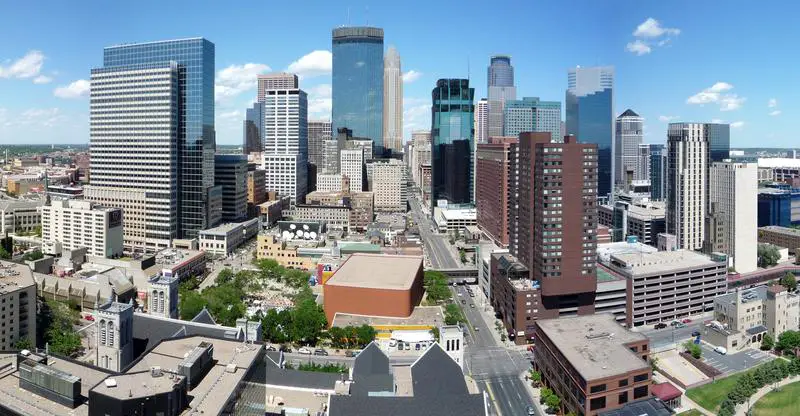
/10
Population: 427,246
% African American: 18.55%
# Of African American Residents: 79,251
Percent Change Since 2010: 15.59%
More on Minneapolis: Data | Cost Of Living | Movers
10. Faribault
/10
Population: 24,631
% African American: 16.58%
# Of African American Residents: 4,083
Percent Change Since 2010: 193.11%
More on Faribault: Data | Cost Of Living | Movers
Methodology: How We Determined The Cities In Minnesota With The Largest Black Population For 2026
We still believe in the accuracy of data — especially from the Census. So that’s where we went to get the race breakdown across Minnesota.
That leads us to the Census’s most recently available data, the 2020-2024 American Community Survey data from the US Census.
Specifically, we looked at table B03002: Hispanic OR LATINO ORIGIN BY RACE. Here are the category names as defined by the Census:
- Hispanic or Latino
- White alone*
- Black or African American alone*
- American Indian and Alaska Native alone*
- Asian alone*
- Native Hawaiian and Other Pacific Islander alone*
- Some other race alone*
- Two or more races*
Our particular column of interest was the number of people who identified as Black or African American.
We limited our analysis to non-CDPs with a population greater than 5,000 people in Minnesota. That left us with 139 cities.
We then calculated the percentage of residents that are Black or African American. The percentages ranked from 35.5% to 0.0%.
Finally, we ranked each city based on the percentage of the Black population, with a higher score being more Black than a lower score. Waite Park took the distinction of being the most Black, while New Prague was the least African American city.
We updated this article for 2026. This is our eleventh time ranking the cities in Minnesota with the largest African American population.
Read on for more information on how the cities in Minnesota ranked by population of African American residents or, for a more general take on diversity in America, head over to our ranking of the most diverse cities in America.
Summary: Black Populations Across Minnesota
If you’re looking for a breakdown of African American populations across Minnesota according to the most recent data, this is an accurate list.
The blackest cities in Minnesota are Waite Park, Brooklyn Center, Brooklyn Park, Columbia Heights, New Hope, Hopkins, Fridley, St. Cloud, Minneapolis, and Faribault.
If you’re curious enough, here are the least African American places in Minnesota:
- New Prague
- Redwood Falls
- Baxter
For more Minnesota reading, check out:
- Safest Places In Minnesota
- Best Places To Raise A Family In Minnesota
- Cheapest Places To Live In Minnesota
African American Population By City In Minnesota
| Rank | City | Population | African American Population | % African American |
|---|---|---|---|---|
| 1 | Waite Park | 8,399 | 2,983 | 35.52% |
| 2 | Brooklyn Center | 32,479 | 10,179 | 31.34% |
| 3 | Brooklyn Park | 83,876 | 24,935 | 29.73% |
| 4 | Columbia Heights | 22,155 | 5,948 | 26.85% |
| 5 | New Hope | 21,181 | 5,321 | 25.12% |
| 6 | Hopkins | 18,819 | 3,923 | 20.85% |
| 7 | Fridley | 30,241 | 6,172 | 20.41% |
| 8 | St. Cloud | 70,629 | 13,944 | 19.74% |
| 9 | Minneapolis | 427,246 | 79,251 | 18.55% |
| 10 | Faribault | 24,631 | 4,083 | 16.58% |
| 11 | St. Paul | 307,284 | 48,284 | 15.71% |
| 12 | Robbinsdale | 14,234 | 2,131 | 14.97% |
| 13 | New Brighton | 22,710 | 3,148 | 13.86% |
| 14 | Crystal | 22,476 | 3,065 | 13.64% |
| 15 | Burnsville | 64,463 | 8,623 | 13.38% |
| 16 | Bloomington | 88,665 | 10,645 | 12.01% |
| 17 | Eagan | 68,000 | 7,796 | 11.46% |
| 18 | Apple Valley | 55,679 | 6,051 | 10.87% |
| 19 | Richfield | 36,642 | 3,917 | 10.69% |
| 20 | Maplewood | 40,695 | 4,323 | 10.62% |
| 21 | Shakopee | 46,012 | 4,657 | 10.12% |
| 22 | Blaine | 72,488 | 7,292 | 10.06% |
| 23 | Savage | 32,889 | 3,243 | 9.86% |
| 24 | Willmar | 21,378 | 2,099 | 9.82% |
| 25 | Rochester | 122,330 | 11,957 | 9.77% |
| 26 | Champlin | 23,294 | 2,250 | 9.66% |
| 27 | St. Anthony | 9,671 | 934 | 9.66% |
| 28 | Coon Rapids | 63,468 | 6,071 | 9.57% |
| 29 | Oakdale | 28,585 | 2,710 | 9.48% |
| 30 | North St. Paul | 12,570 | 1,127 | 8.97% |
| 31 | St. Joseph | 7,021 | 588 | 8.37% |
| 32 | Otsego | 22,245 | 1,817 | 8.17% |
| 33 | Maple Grove | 71,173 | 5,794 | 8.14% |
| 34 | Roseville | 35,802 | 2,889 | 8.07% |
| 35 | St. Paul Park | 5,457 | 440 | 8.06% |
| 36 | Anoka | 17,970 | 1,420 | 7.9% |
| 37 | Woodbury | 78,305 | 6,125 | 7.82% |
| 38 | Falcon Heights | 5,085 | 394 | 7.75% |
| 39 | Ramsey | 28,421 | 2,089 | 7.35% |
| 40 | Little Canada | 10,514 | 772 | 7.34% |
| 41 | St. Peter | 12,185 | 894 | 7.34% |
| 42 | Worthington | 13,780 | 1,007 | 7.31% |
| 43 | Mankato | 45,473 | 3,195 | 7.03% |
| 44 | Golden Valley | 21,725 | 1,492 | 6.87% |
| 45 | Mounds View | 12,926 | 860 | 6.65% |
| 46 | Lakeville | 74,354 | 4,901 | 6.59% |
| 47 | Cottage Grove | 40,992 | 2,513 | 6.13% |
| 48 | Moorhead | 45,036 | 2,700 | 6.0% |
| 49 | Vadnais Heights | 12,838 | 762 | 5.94% |
| 50 | Inver Grove Heights | 35,906 | 2,109 | 5.87% |
| 51 | West St. Paul | 21,382 | 1,247 | 5.83% |
| 52 | Eden Prairie | 63,051 | 3,579 | 5.68% |
| 53 | South St. Paul | 20,611 | 1,069 | 5.19% |
| 54 | St. Michael | 20,010 | 1,028 | 5.14% |
| 55 | Austin | 26,358 | 1,332 | 5.05% |
| 56 | Plymouth | 79,220 | 3,912 | 4.94% |
| 57 | Elk River | 26,793 | 1,258 | 4.7% |
| 58 | Spring Lake Park | 7,032 | 329 | 4.68% |
| 59 | Marshall | 13,896 | 649 | 4.67% |
| 60 | Sartell | 19,758 | 905 | 4.58% |
| 61 | Andover | 33,035 | 1,511 | 4.57% |
| 62 | St. Louis Park | 49,594 | 2,251 | 4.54% |
| 63 | Owatonna | 26,498 | 1,195 | 4.51% |
| 64 | North Mankato | 14,211 | 639 | 4.5% |
| 65 | Big Lake | 12,367 | 527 | 4.26% |
| 66 | Minnetonka | 53,064 | 2,217 | 4.18% |
| 67 | Farmington | 23,902 | 996 | 4.17% |
| 68 | Hugo | 16,340 | 662 | 4.05% |
| 69 | East Grand Forks | 9,028 | 346 | 3.83% |
| 70 | Shoreview | 26,714 | 1,018 | 3.81% |
| 71 | Lino Lakes | 22,113 | 838 | 3.79% |
| 72 | Belle Plaine | 7,423 | 281 | 3.79% |
| 73 | Winona | 26,009 | 935 | 3.59% |
| 74 | White Bear Lake | 23,908 | 796 | 3.33% |
| 75 | Rogers | 13,685 | 454 | 3.32% |
| 76 | Chaska | 28,706 | 932 | 3.25% |
| 77 | Red Wing | 16,758 | 534 | 3.19% |
| 78 | Rosemount | 27,562 | 863 | 3.13% |
| 79 | Forest Lake | 20,729 | 615 | 2.97% |
| 80 | Edina | 53,262 | 1,565 | 2.94% |
| 81 | Duluth | 87,093 | 2,368 | 2.72% |
| 82 | Arden Hills | 9,658 | 259 | 2.68% |
| 83 | Albertville | 8,207 | 208 | 2.53% |
| 84 | Albert Lea | 18,330 | 427 | 2.33% |
| 85 | Jordan | 6,771 | 155 | 2.29% |
| 86 | Lake Elmo | 13,140 | 300 | 2.28% |
| 87 | Prior Lake | 28,016 | 627 | 2.24% |
| 88 | Victoria | 11,295 | 252 | 2.23% |
| 89 | Northfield | 20,742 | 433 | 2.09% |
| 90 | Hibbing | 16,057 | 315 | 1.96% |
| 91 | Bemidji | 15,569 | 287 | 1.84% |
| 92 | Waseca | 9,164 | 159 | 1.74% |
| 93 | Fergus Falls | 14,181 | 244 | 1.72% |
| 94 | Hermantown | 10,218 | 175 | 1.71% |
| 95 | Mound | 9,107 | 153 | 1.68% |
| 96 | Morris | 5,128 | 86 | 1.68% |
| 97 | Sauk Rapids | 13,852 | 227 | 1.64% |
| 98 | Cambridge | 10,307 | 166 | 1.61% |
| 99 | Grand Rapids | 11,207 | 156 | 1.39% |
| 100 | Chanhassen | 26,006 | 333 | 1.28% |