
Most African American cities in Mississippi research summary. We used Saturday Night Science to analyze Mississippi’s most recent Census data to determine the blackest cities in Mississippi based on the percentage of Black residents. Here are the results of our analysis:
The city with the largest African American population in Mississippi is Yazoo City based on the most recent Census data.
Yazoo City is 88.56% Black.
The least African American city in Mississippi is Ocean Springs.
Ocean Springs is 7.42% Black.
Mississippi is 36.3% Black.
Mississippi is the 1st blackest state in the United States.
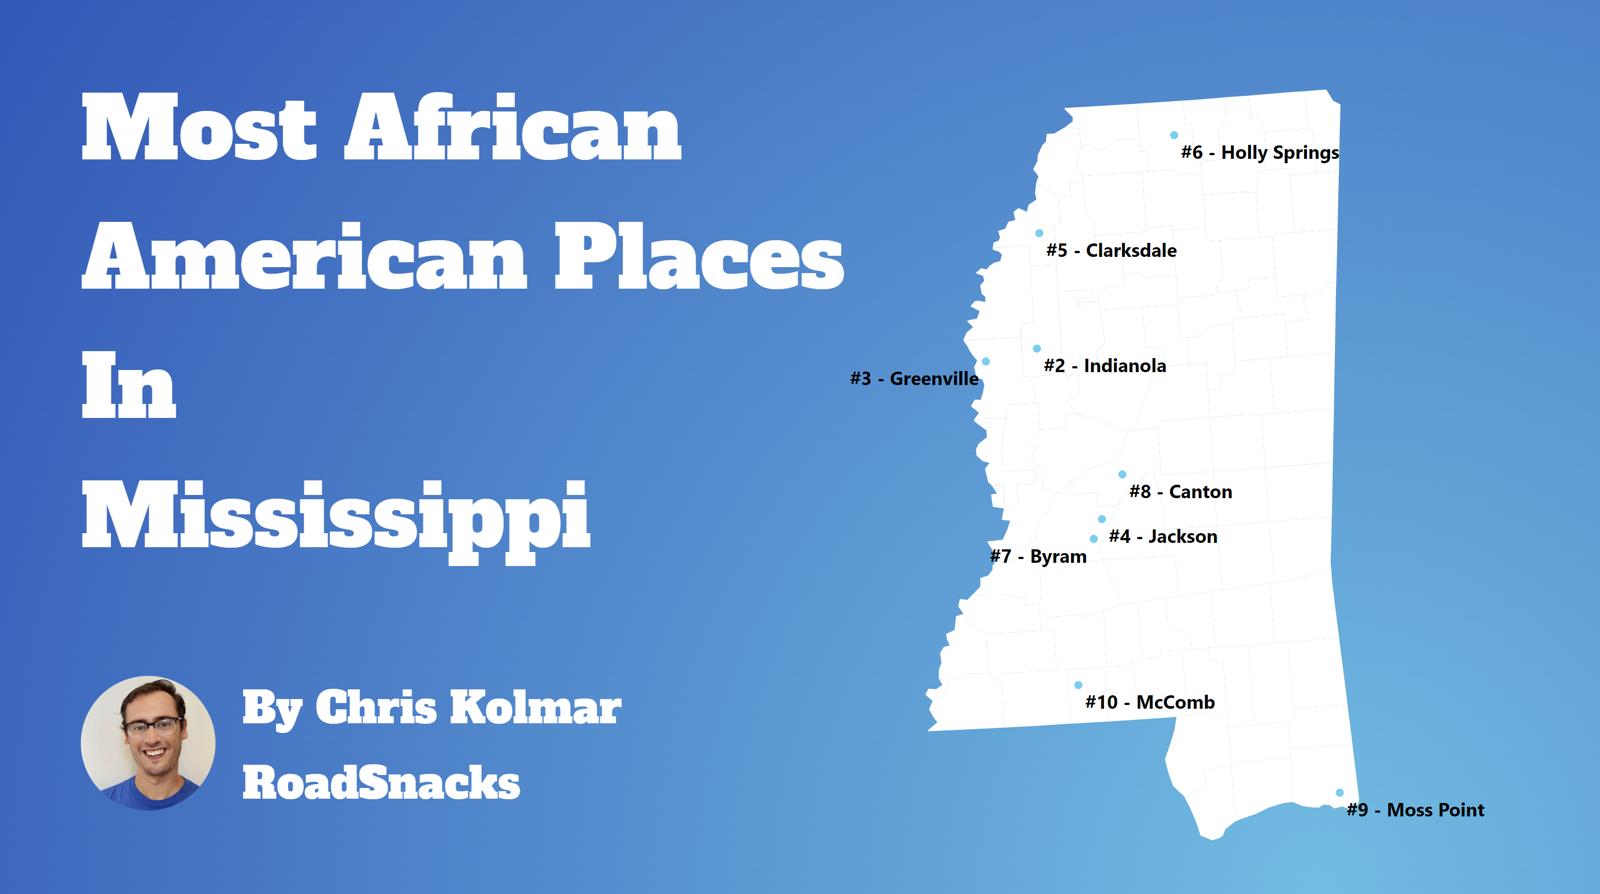
Table Of Contents: Top Ten | Methodology | Summary | Table
The Black community is one of the fastest-growing communities in America this decade.
Roughly 42 million people identifying as Black or African American live in the United States, making up 12% of the total population. According to the most recent American Community Survey, the Black population in Mississippi is 1,070,561 – at 36.3% of the total population of Mississippi.
The percentage growth of Blacks in America is the third largest percentage change for any race according to the Census’s race and ethnicity definition. Most scholars and historians agree that increasing diversity in America is a good thing.
We agree.
But how has the increase in the black population impacted Mississippi? Which cities and towns in Mississippi have seen the greatest increase in its Black population?
We broke down the most recent census data to determine the cities in Mississippi with the largest African American population in 2026:
Most African American Places In Mississippi
What’s the blackest city in Mississippi? The city with the largest Black population in Mississippi for 2026 is Yazoo City. See if Yazoo City ranked as one of the most african american places in America.
And if you already knew these places were Black, check out the best places to live in Mississippi or the most diverse places in Mississippi. Population: 10,219 Population: 28,166 Population: 146,631 Population: 9,062 Population: 14,231 Population: 10,811 Population: 12,049 Population: 20,589 Population: 6,704 Population: 12,799The 10 Blackest Cities In Mississippi For 2026
1. Yazoo City
/10
% African American: 88.56%
# Of African American Residents: 9,050
Percent Change Since 2010: -6.79%
More on Yazoo City: Data | Cost Of Living | Movers2. Greenville
/10
% African American: 82.41%
# Of African American Residents: 23,213
Percent Change Since 2010: -11.5%
More on Greenville: Data | Cost Of Living | Movers3. Jackson
/10
% African American: 81.71%
# Of African American Residents: 119,812
Percent Change Since 2010: -12.49%
More on Jackson: Data | Cost Of Living | Movers4. Indianola
/10
% African American: 81.46%
# Of African American Residents: 7,382
Percent Change Since 2010: -15.6%
More on Indianola: Data | Cost Of Living | Movers5. Clarksdale
/10
% African American: 80.86%
# Of African American Residents: 11,507
Percent Change Since 2010: -18.03%
More on Clarksdale: Data | Cost Of Living | Movers6. Canton
/10
% African American: 74.56%
# Of African American Residents: 8,061
Percent Change Since 2010: -21.6%
More on Canton: Data | Cost Of Living | Movers7. Mccomb
/10
% African American: 72.05%
# Of African American Residents: 8,681
Percent Change Since 2010: 1.95%
More on Mccomb: Data | Cost Of Living | Movers8. Vicksburg
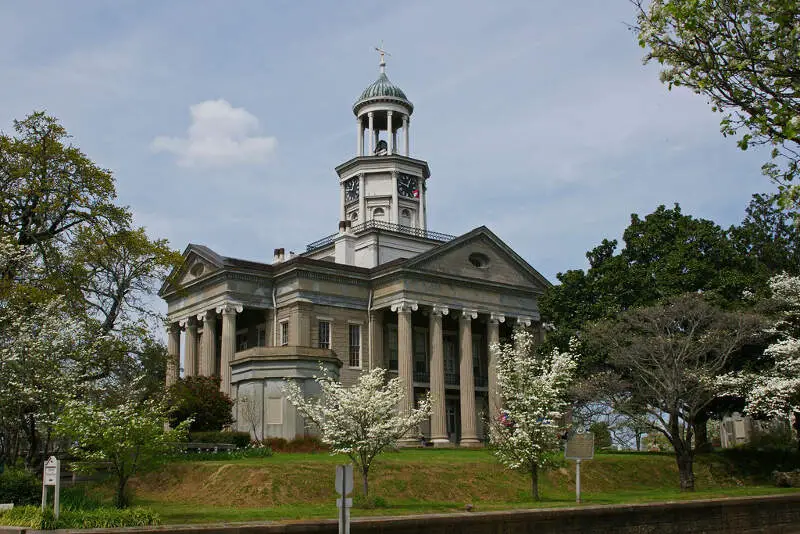
/10
% African American: 71.88%
# Of African American Residents: 14,799
Percent Change Since 2010: -7.5%
More on Vicksburg: Data | Cost Of Living | Movers9. Holly Springs
/10
% African American: 71.55%
# Of African American Residents: 4,797
Percent Change Since 2010: -21.22%
More on Holly Springs: Data | Cost Of Living | Movers10. Byram
/10
% African American: 71.2%
# Of African American Residents: 9,113
Percent Change Since 2010: 74.05%
More on Byram: Data | Cost Of Living | Movers
We still believe in the accuracy of data — especially from the Census. So that’s where we went to get the race breakdown across Mississippi. That leads us to the Census’s most recently available data, the 2020-2024 American Community Survey data from the US Census. Specifically, we looked at table B03002: Hispanic OR LATINO ORIGIN BY RACE. Here are the category names as defined by the Census: Our particular column of interest was the number of people who identified as Black or African American. We limited our analysis to non-CDPs with a population greater than 5,000 people in Mississippi. That left us with 59 cities. We then calculated the percentage of residents that are Black or African American. The percentages ranked from 88.6% to 7.4%. Finally, we ranked each city based on the percentage of the Black population, with a higher score being more Black than a lower score. Yazoo City took the distinction of being the most Black, while Ocean Springs was the least African American city. We updated this article for 2026. This is our eleventh time ranking the cities in Mississippi with the largest African American population. Read on for more information on how the cities in Mississippi ranked by population of African American residents or, for a more general take on diversity in America, head over to our ranking of the most diverse cities in America.Methodology: How We Determined The Cities In Mississippi With The Largest Black Population For 2026
Summary: Black Populations Across Mississippi
If you’re looking for a breakdown of African American populations across Mississippi according to the most recent data, this is an accurate list.
The blackest cities in Mississippi are Yazoo City, Greenville, Jackson, Indianola, Clarksdale, Canton, McComb, Vicksburg, Holly Springs, and Byram.
If you’re curious enough, here are the least African American places in Mississippi:
- Ocean Springs
- Long Beach
- Waveland
For more Mississippi reading, check out:
- Worst Places To Live In Mississippi
- Cheapest Places To Live In Mississippi
- Best Places To Raise A Family In Mississippi
African American Population By City In Mississippi
| Rank | City | Population | African American Population | % African American |
|---|---|---|---|---|
| 1 | Yazoo City | 10,219 | 9,050 | 88.56% |
| 2 | Greenville | 28,166 | 23,213 | 82.41% |
| 3 | Jackson | 146,631 | 119,812 | 81.71% |
| 4 | Indianola | 9,062 | 7,382 | 81.46% |
| 5 | Clarksdale | 14,231 | 11,507 | 80.86% |
| 6 | Canton | 10,811 | 8,061 | 74.56% |
| 7 | Mccomb | 12,049 | 8,681 | 72.05% |
| 8 | Vicksburg | 20,589 | 14,799 | 71.88% |
| 9 | Holly Springs | 6,704 | 4,797 | 71.55% |
| 10 | Byram | 12,799 | 9,113 | 71.2% |
| 11 | Greenwood | 14,086 | 9,826 | 69.76% |
| 12 | Moss Point | 11,957 | 8,211 | 68.67% |
| 13 | West Point | 9,900 | 6,658 | 67.25% |
| 14 | Columbus | 23,348 | 15,029 | 64.37% |
| 15 | Natchez | 14,192 | 8,833 | 62.24% |
| 16 | Laurel | 17,679 | 10,846 | 61.35% |
| 17 | Louisville | 5,983 | 3,608 | 60.3% |
| 18 | Meridian | 34,137 | 20,371 | 59.67% |
| 19 | Kosciusko | 6,933 | 4,070 | 58.7% |
| 20 | Grenada | 12,375 | 7,167 | 57.92% |
| 21 | Batesville | 7,387 | 4,106 | 55.58% |
| 22 | Brookhaven | 11,650 | 6,441 | 55.29% |
| 23 | Philadelphia | 6,996 | 3,610 | 51.6% |
| 24 | Cleveland | 10,623 | 5,414 | 50.96% |
| 25 | Hattiesburg | 48,619 | 24,555 | 50.5% |
| 26 | Horn Lake | 26,647 | 13,311 | 49.95% |
| 27 | Ridgeland | 24,587 | 11,399 | 46.36% |
| 28 | Clinton | 27,195 | 11,716 | 43.08% |
| 29 | Senatobia | 8,380 | 3,379 | 40.32% |
| 30 | Southaven | 56,226 | 22,111 | 39.33% |
| 31 | Picayune | 11,900 | 4,584 | 38.52% |
| 32 | Tupelo | 37,791 | 14,279 | 37.78% |
| 33 | Gulfport | 73,003 | 27,253 | 37.33% |
| 34 | Forest | 5,357 | 1,997 | 37.28% |
| 35 | Starkville | 25,721 | 9,263 | 36.01% |
| 36 | Columbia | 6,632 | 2,376 | 35.83% |
| 37 | Olive Branch | 47,019 | 16,787 | 35.7% |
| 38 | Pascagoula | 21,710 | 7,401 | 34.09% |
| 39 | Gautier | 19,046 | 5,617 | 29.49% |
| 40 | Pearl | 27,737 | 8,072 | 29.1% |
| 41 | Amory | 6,500 | 1,819 | 27.98% |
| 42 | New Albany | 7,663 | 2,089 | 27.26% |
| 43 | Brandon | 25,542 | 6,921 | 27.1% |
| 44 | Oxford | 26,411 | 6,734 | 25.5% |
| 45 | Pontotoc | 5,806 | 1,331 | 22.92% |
| 46 | Booneville | 9,246 | 1,970 | 21.31% |
| 47 | Corinth | 14,323 | 2,798 | 19.54% |
| 48 | D’iberville | 13,203 | 2,526 | 19.13% |
| 49 | Biloxi | 48,861 | 9,001 | 18.42% |
| 50 | Flowood | 10,587 | 1,805 | 17.05% |
| 51 | Ripley | 5,377 | 882 | 16.4% |
| 52 | Petal | 11,294 | 1,823 | 16.14% |
| 53 | Richland | 7,346 | 1,156 | 15.74% |
| 54 | Hernando | 17,949 | 2,609 | 14.54% |
| 55 | Bay St. Louis | 10,188 | 1,399 | 13.73% |
| 56 | Madison | 27,946 | 3,561 | 12.74% |
| 57 | Waveland | 7,062 | 844 | 11.95% |
| 58 | Long Beach | 17,009 | 1,725 | 10.14% |
| 59 | Ocean Springs | 18,646 | 1,384 | 7.42% |