
Most African American cities in New Jersey research summary. We used Saturday Night Science to analyze New Jersey’s most recent Census data to determine the blackest cities in New Jersey based on the percentage of Black residents. Here are the results of our analysis:
-
The city with the largest African American population in New Jersey is East Orange based on the most recent Census data.
-
East Orange is 79.13% Black.
-
The least African American city in New Jersey is Little Silver.
-
Little Silver is 0.0% Black.
-
New Jersey is 12.4% Black.
-
New Jersey is the 16th blackest state in the United States.
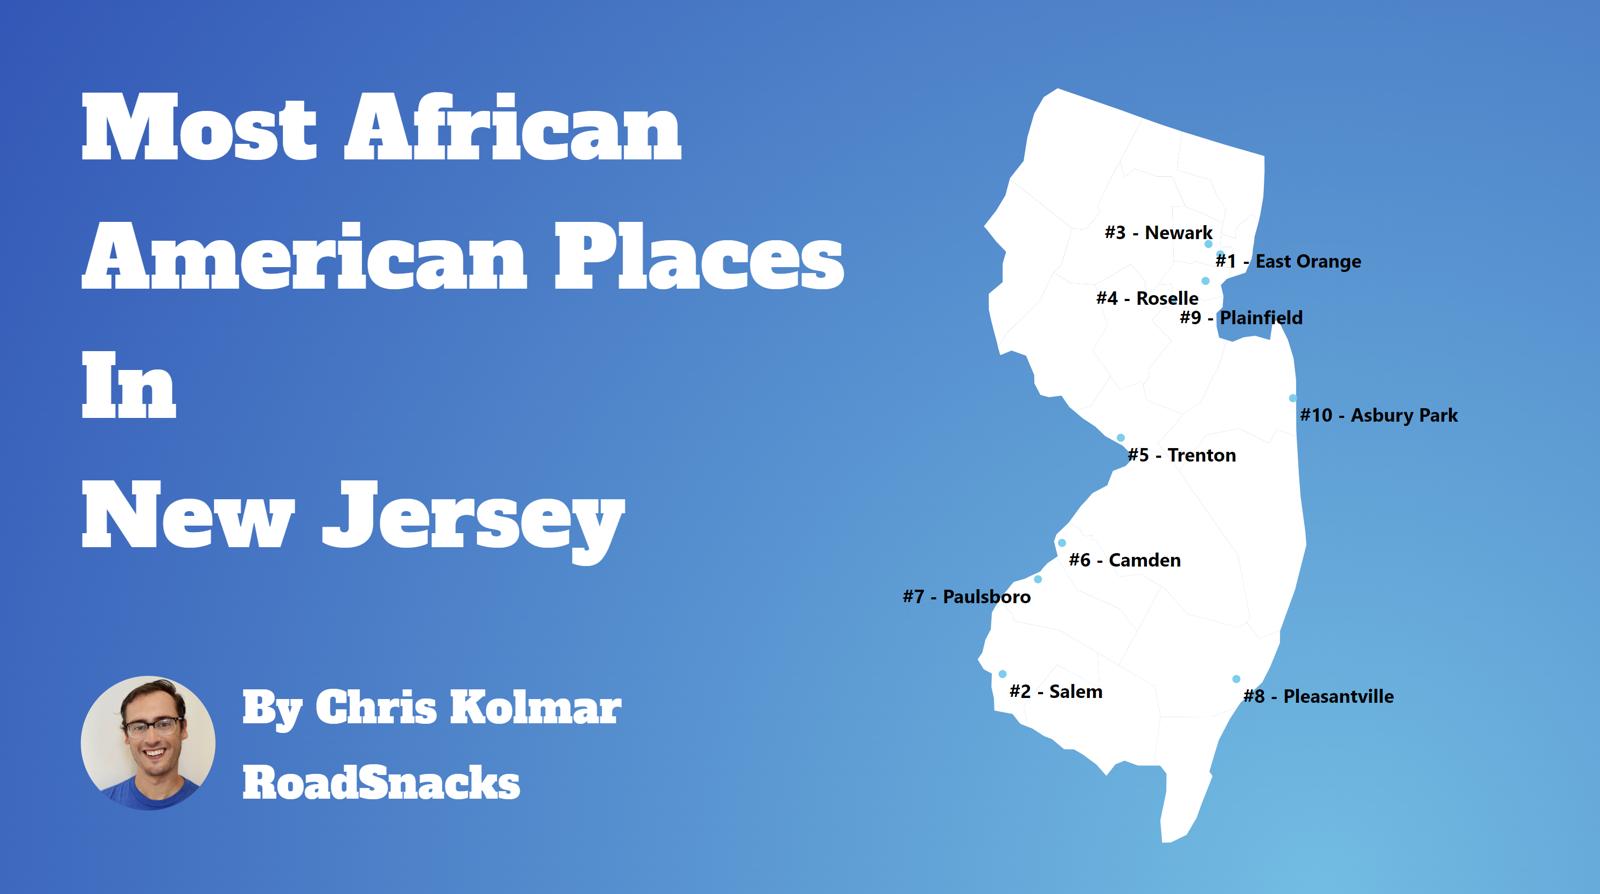
Table Of Contents: Top Ten | Methodology | Summary | Table
The Black community is one of the fastest-growing communities in America this decade.
Roughly 42 million people identifying as Black or African American live in the United States, making up 12% of the total population. According to the most recent American Community Survey, the Black population in New Jersey is 1,147,770 – at 12.4% of the total population of New Jersey.
The percentage growth of Blacks in America is the third largest percentage change for any race according to the Census’s race and ethnicity definition. Most scholars and historians agree that increasing diversity in America is a good thing.
We agree.
But how has the increase in the black population impacted New Jersey? Which cities and towns in New Jersey have seen the greatest increase in its Black population?
We broke down the most recent census data to determine the cities in New Jersey with the largest African American population in 2024:
Most African American Places In New Jersey
What’s the blackest city in New Jersey? The city with the largest Black population in New Jersey for 2024 is East Orange. See if East Orange ranked as one of the most african american places in America.
And if you already knew these places were Black, check out the best places to live in New Jersey or the most diverse places in New Jersey.
The 10 Blackest Cities In New Jersey For 2024
1. East Orange

/10
Population: 68,879
% African American: 79.13%
# Of African American Residents: 54,507
Percent Change Since 2010: -3.27%
More on East Orange: Data | Cost Of Living
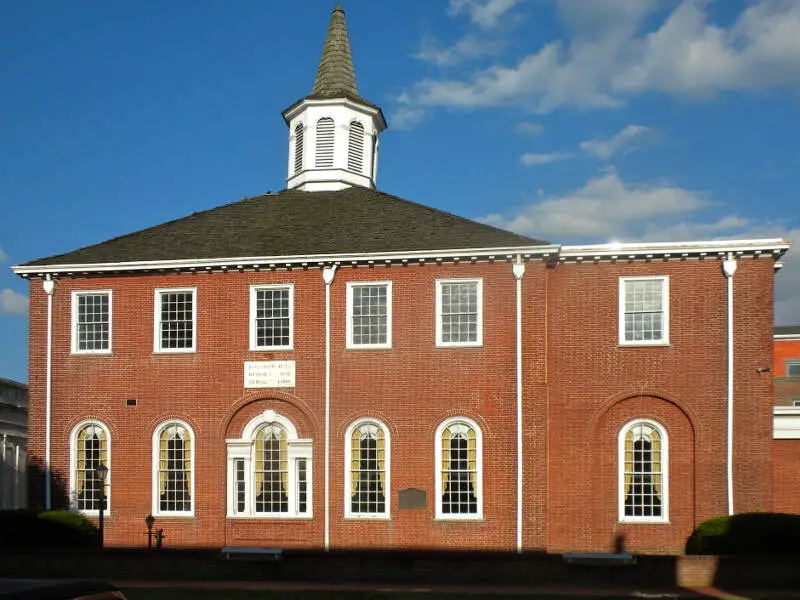
2. Salem
/10
Population: 5,285
% African American: 58.69%
# Of African American Residents: 3,102
Percent Change Since 2010: 1.77%
More on Salem: Data
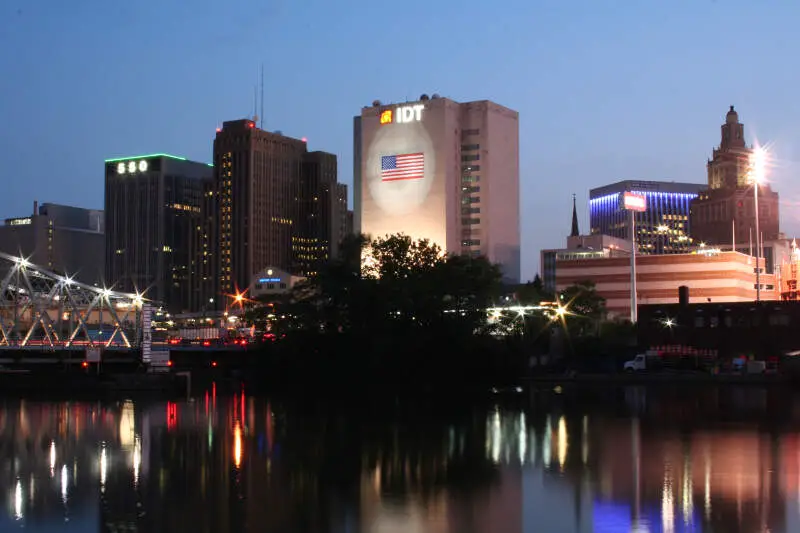
3. Newark
/10
Population: 307,355
% African American: 45.37%
# Of African American Residents: 139,440
Percent Change Since 2010: 0.6%
More on Newark: Data | Cost Of Living
4. Roselle
/10
Population: 22,500
% African American: 44.41%
# Of African American Residents: 9,993
Percent Change Since 2010: -7.76%
More on Roselle: Data | Cost Of Living
5. Trenton
/10
Population: 90,055
% African American: 44.18%
# Of African American Residents: 39,787
Percent Change Since 2010: -4.79%
More on Trenton: Data | Cost Of Living
6. Camden
/10
Population: 71,799
% African American: 39.26%
# Of African American Residents: 28,186
Percent Change Since 2010: -20.56%
More on Camden: Data | Cost Of Living
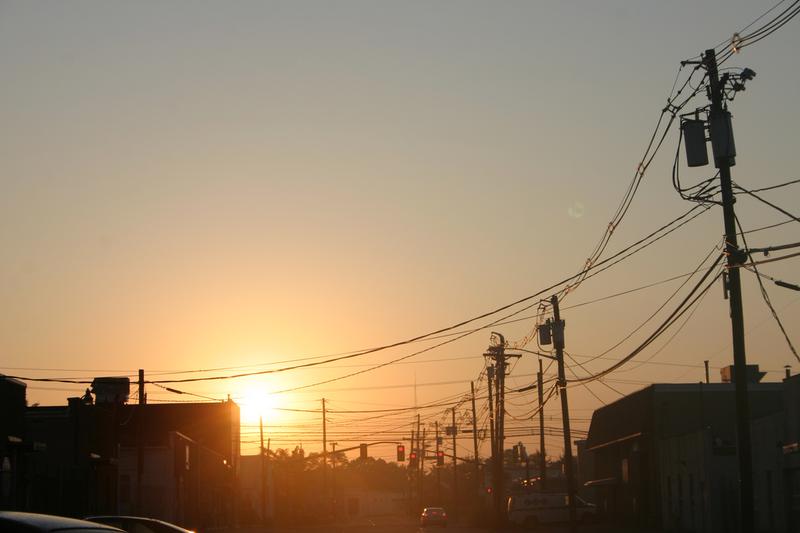
7. Paulsboro
/10
Population: 6,195
% African American: 38.47%
# Of African American Residents: 2,383
Percent Change Since 2010: 21.15%
More on Paulsboro: Data | Cost Of Living
8. Pleasantville
/10
Population: 20,562
% African American: 35.97%
# Of African American Residents: 7,397
Percent Change Since 2010: -14.37%
More on Pleasantville: Data | Cost Of Living
9. Plainfield
/10
Population: 54,358
% African American: 34.97%
# Of African American Residents: 19,011
Percent Change Since 2010: -23.59%
More on Plainfield: Data | Cost Of Living
10. Asbury Park
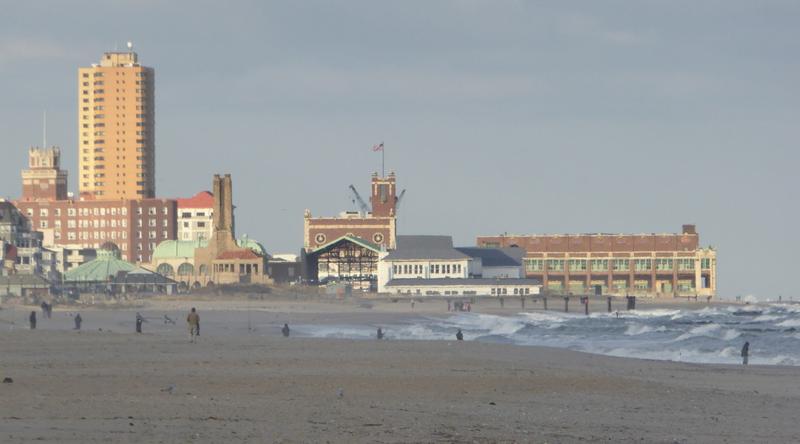
/10
Population: 15,245
% African American: 34.07%
# Of African American Residents: 5,194
Percent Change Since 2010: -40.39%
More on Asbury Park: Data | Cost Of Living
Methodology: How We Determined The Cities In New Jersey With The Largest Black Population For 2024
We still believe in the accuracy of data — especially from the Census. So that’s where we went to get the race breakdown across New Jersey.
That leads us to the Census’s most recently available data, the 2018-2022 American Community Survey data from the US Census.
Specifically, we looked at table B03002: Hispanic OR LATINO ORIGIN BY RACE. Here are the category names as defined by the Census:
- Hispanic or Latino
- White alone*
- Black or African American alone*
- American Indian and Alaska Native alone*
- Asian alone*
- Native Hawaiian and Other Pacific Islander alone*
- Some other race alone*
- Two or more races*
Our particular column of interest was the number of people who identified as Black or African American.
We limited our analysis to non-CDPs with a population greater than 5,000 people in New Jersey. That left us with 188 cities.
We then calculated the percentage of residents that are Black or African American. The percentages ranked from 79.1% to 0.0%.
Finally, we ranked each city based on the percentage of the Black population, with a higher score being more Black than a lower score. East Orange took the distinction of being the most Black, while Little Silver was the least African American city.
We updated this article for 2024. This is our tenth time ranking the cities in New Jersey with the largest African American population.
Read on for more information on how the cities in New Jersey ranked by population of African American residents or, for a more general take on diversity in America, head over to our ranking of the most diverse cities in America.
Summary: Black Populations Across New Jersey
If you’re looking for a breakdown of African American populations across New Jersey according to the most recent data, this is an accurate list.
The blackest cities in New Jersey are East Orange, Salem, Newark, Roselle, Trenton, Camden, Paulsboro, Pleasantville, Plainfield, and Asbury Park.
If you’re curious enough, here are the least African American places in New Jersey:
- Little Silver
- Old Tappan
- Wharton
For more New Jersey reading, check out:
- Safest Places In New Jersey
- Cheapest Places To Live In New Jersey
- Best Places To Raise A Family In New Jersey
African American Population By City In New Jersey
| Rank | City | Population | African American Population | % African American |
|---|---|---|---|---|
| 1 | East Orange | 68,879 | 54,507 | 79.13% |
| 2 | Salem | 5,285 | 3,102 | 58.69% |
| 3 | Newark | 307,355 | 139,440 | 45.37% |
| 4 | Roselle | 22,500 | 9,993 | 44.41% |
| 5 | Trenton | 90,055 | 39,787 | 44.18% |
| 6 | Camden | 71,799 | 28,186 | 39.26% |
| 7 | Paulsboro | 6,195 | 2,383 | 38.47% |
| 8 | Pleasantville | 20,562 | 7,397 | 35.97% |
| 9 | Plainfield | 54,358 | 19,011 | 34.97% |
| 10 | Asbury Park | 15,245 | 5,194 | 34.07% |
| 11 | Burlington | 9,833 | 3,196 | 32.5% |
| 12 | Bridgeton | 26,895 | 8,646 | 32.15% |
| 13 | Lindenwold | 21,337 | 6,737 | 31.57% |
| 14 | Rahway | 29,664 | 9,117 | 30.73% |
| 15 | Atlantic City | 38,487 | 11,510 | 29.91% |
| 16 | Linden | 43,478 | 11,929 | 27.44% |
| 17 | Pine Hill | 10,698 | 2,889 | 27.01% |
| 18 | Somerdale | 5,524 | 1,435 | 25.98% |
| 19 | Paterson | 157,864 | 37,119 | 23.51% |
| 20 | Englewood | 29,109 | 6,559 | 22.53% |
| 21 | North Plainfield | 22,695 | 4,817 | 21.22% |
| 22 | Clayton | 8,801 | 1,808 | 20.54% |
| 23 | Woodbury | 9,981 | 2,006 | 20.1% |
| 24 | Jersey City | 287,899 | 57,250 | 19.89% |
| 25 | Hackensack | 45,758 | 9,011 | 19.69% |
| 26 | Clementon | 5,312 | 1,035 | 19.48% |
| 27 | Glassboro | 23,014 | 3,897 | 16.93% |
| 28 | Elizabeth | 135,665 | 22,033 | 16.24% |
| 29 | Prospect Park | 6,299 | 1,005 | 15.95% |
| 30 | Carteret | 25,161 | 3,924 | 15.6% |
| 31 | Millville | 27,523 | 4,118 | 14.96% |
| 32 | Palmyra | 7,437 | 1,066 | 14.33% |
| 33 | Haledon | 8,945 | 1,282 | 14.33% |
| 34 | New Brunswick | 55,718 | 7,706 | 13.83% |
| 35 | Collingswood | 14,135 | 1,719 | 12.16% |
| 36 | Long Branch | 31,932 | 3,879 | 12.15% |
| 37 | Berlin | 7,489 | 908 | 12.12% |
| 38 | Sayreville | 45,136 | 5,378 | 11.92% |
| 39 | Freehold | 12,498 | 1,485 | 11.88% |
| 40 | Vineland | 60,796 | 7,196 | 11.84% |
| 41 | Matawan | 9,546 | 1,115 | 11.68% |
| 42 | Phillipsburg | 15,206 | 1,771 | 11.65% |
| 43 | South Plainfield | 24,273 | 2,757 | 11.36% |
| 44 | Newton | 8,370 | 927 | 11.08% |
| 45 | Somerville | 12,467 | 1,361 | 10.92% |
| 46 | Bayonne | 70,497 | 7,317 | 10.38% |
| 47 | Somers Point | 10,482 | 1,079 | 10.29% |
| 48 | Lodi | 25,969 | 2,542 | 9.79% |
| 49 | Manville | 10,892 | 1,064 | 9.77% |
| 50 | Roselle Park | 13,964 | 1,342 | 9.61% |
| 51 | Bogota | 8,940 | 840 | 9.4% |
| 52 | Keansburg | 9,761 | 865 | 8.86% |
| 53 | South Amboy | 9,336 | 786 | 8.42% |
| 54 | Bergenfield | 28,223 | 2,325 | 8.24% |
| 55 | Absecon | 9,086 | 746 | 8.21% |
| 56 | Wildwood | 5,164 | 420 | 8.13% |
| 57 | Morristown | 20,126 | 1,632 | 8.11% |
| 58 | Red Bank | 12,868 | 1,014 | 7.88% |
| 59 | Hight | 5,864 | 459 | 7.83% |
| 60 | Eato | 13,522 | 1,048 | 7.75% |
| 61 | Summit | 22,555 | 1,669 | 7.4% |
| 62 | Runnemede | 8,307 | 608 | 7.32% |
| 63 | Stratford | 6,962 | 490 | 7.04% |
| 64 | South River | 16,081 | 1,128 | 7.01% |
| 65 | Tinton Falls | 19,180 | 1,333 | 6.95% |
| 66 | Boonton | 8,781 | 604 | 6.88% |
| 67 | Florham Park | 12,790 | 851 | 6.65% |
| 68 | Metuchen | 14,958 | 995 | 6.65% |
| 69 | Gloucester City | 11,435 | 755 | 6.6% |
| 70 | Passaic | 70,048 | 4,504 | 6.43% |
| 71 | Highland Park | 14,996 | 963 | 6.42% |
| 72 | Hasbrouck Heights | 12,080 | 762 | 6.31% |
| 73 | Elmwood Park | 21,261 | 1,311 | 6.17% |
| 74 | Ridgefield Park | 13,161 | 801 | 6.09% |
| 75 | Dover | 18,426 | 1,103 | 5.99% |
| 76 | West Long Branch | 8,547 | 474 | 5.55% |
| 77 | Perth Amboy | 55,226 | 2,950 | 5.34% |
| 78 | Middlesex | 14,525 | 774 | 5.33% |
| 79 | Woodland Park | 13,291 | 708 | 5.33% |
| 80 | River Edge | 12,022 | 627 | 5.22% |
| 81 | Beachwood | 10,933 | 550 | 5.03% |
| 82 | Bound Brook | 11,906 | 566 | 4.75% |
| 83 | Garfield | 32,472 | 1,537 | 4.73% |
| 84 | Caldwell | 8,897 | 421 | 4.73% |
| 85 | Dunellen | 7,598 | 353 | 4.65% |
| 86 | Keyport | 7,188 | 332 | 4.62% |
| 87 | Ventnor City | 9,285 | 419 | 4.51% |
| 88 | Hawthorne | 19,456 | 862 | 4.43% |
| 89 | Fanwood | 7,723 | 339 | 4.39% |
| 90 | Maywood | 10,040 | 434 | 4.32% |
| 91 | Washington | 7,240 | 302 | 4.17% |
| 92 | Kenilworth | 8,345 | 347 | 4.16% |
| 93 | Edgewater | 14,394 | 595 | 4.13% |
| 94 | Bellmawr | 11,677 | 481 | 4.12% |
| 95 | Totowa | 10,975 | 448 | 4.08% |
| 96 | New Milford | 16,888 | 689 | 4.08% |
| 97 | Harrison | 19,217 | 782 | 4.07% |
| 98 | East Rutherford | 10,020 | 397 | 3.96% |
| 99 | North Haledon | 8,801 | 343 | 3.9% |
| 100 | Kearny | 41,157 | 1,587 | 3.86% |
There is NO mention of Willingboro here. Should that not be # 1 at least?
Why isn’t Neptune, NJ on there. Very high back population nice neighborhoods.