
Most African American cities in Ohio research summary. We used Saturday Night Science to analyze Ohio’s most recent Census data to determine the blackest cities in Ohio based on the percentage of Black residents. Here are the results of our analysis:
-
The city with the largest African American population in Ohio is Warrensville Heights based on the most recent Census data.
-
Warrensville Heights is 92.36% Black.
-
The least African American city in Ohio is Salem.
-
Salem is 0.0% Black.
-
Ohio is 12.1% Black.
-
Ohio is the 17th blackest state in the United States.
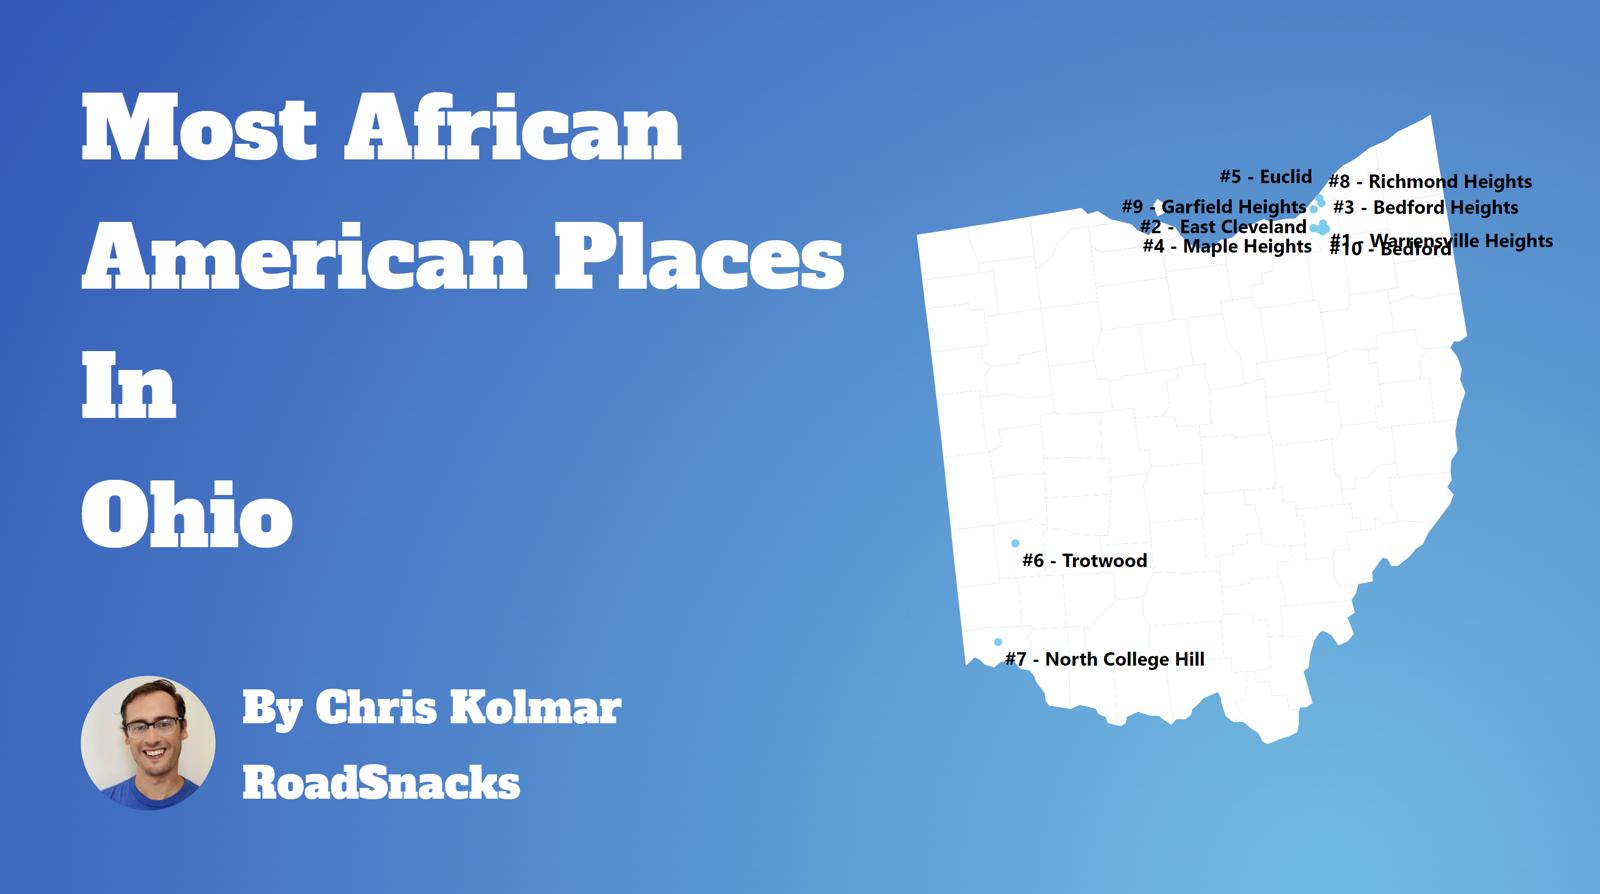
Table Of Contents: Top Ten | Methodology | Summary | Table
The Black community is one of the fastest-growing communities in America this decade.
Roughly 42 million people identifying as Black or African American live in the United States, making up 12% of the total population. According to the most recent American Community Survey, the Black population in Ohio is 1,428,392 – at 12.1% of the total population of Ohio.
The percentage growth of Blacks in America is the third largest percentage change for any race according to the Census’s race and ethnicity definition. Most scholars and historians agree that increasing diversity in America is a good thing.
We agree.
But how has the increase in the black population impacted Ohio? Which cities and towns in Ohio have seen the greatest increase in its Black population?
We broke down the most recent census data to determine the cities in Ohio with the largest African American population in 2025:
Most African American Places In Ohio
What’s the blackest city in Ohio? The city with the largest Black population in Ohio for 2025 is Warrensville Heights. See if Warrensville Heights ranked as one of the most african american places in America.
And if you already knew these places were Black, check out the best places to live in Ohio or the most diverse places in Ohio.
The 10 Blackest Cities In Ohio For 2025
1. Warrensville Heights
/10
Population: 13,585
% African American: 92.36%
# Of African American Residents: 12,547
Percent Change Since 2010: -2.49%
More on Warrensville Heights: Data
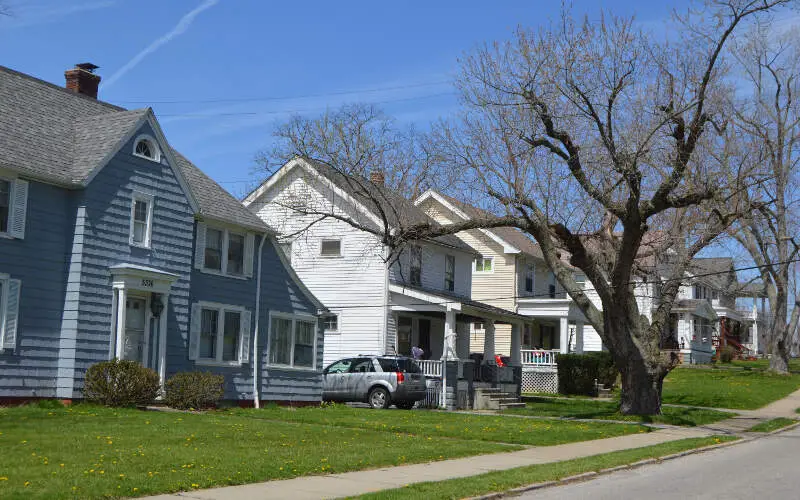
2. East Cleveland
/10
Population: 13,666
% African American: 87.68%
# Of African American Residents: 11,982
Percent Change Since 2010: -32.91%
More on East Cleveland: Data
3. Bedford Heights
/10
Population: 10,876
% African American: 77.06%
# Of African American Residents: 8,381
Percent Change Since 2010: 0.56%
More on Bedford Heights: Data
4. Maple Heights
/10
Population: 23,350
% African American: 73.79%
# Of African American Residents: 17,230
Percent Change Since 2010: 12.92%
More on Maple Heights: Data
5. Euclid
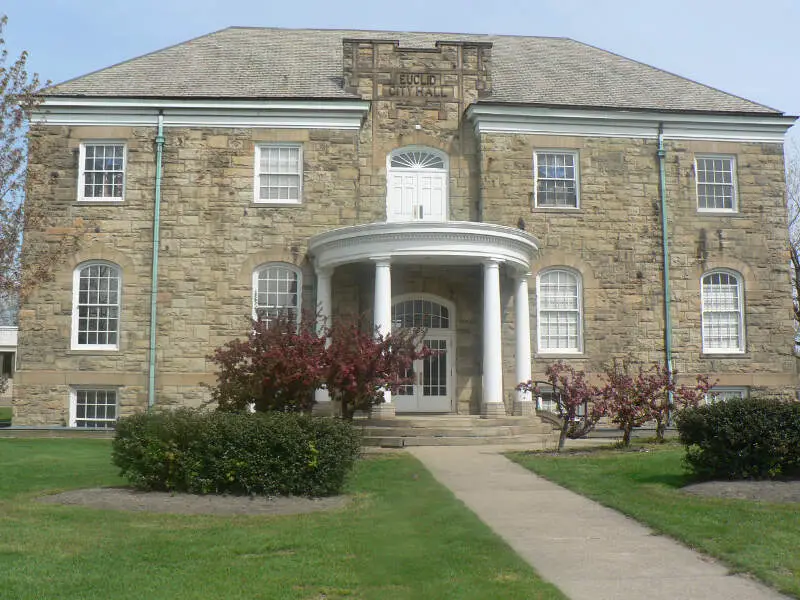
/10
Population: 48,991
% African American: 65.87%
# Of African American Residents: 32,268
Percent Change Since 2010: 29.36%
More on Euclid: Data
6. Trotwood
/10
Population: 23,041
% African American: 63.04%
# Of African American Residents: 14,525
Percent Change Since 2010: -14.32%
More on Trotwood: Data
7. Richmond Heights
/10
Population: 10,677
% African American: 62.41%
# Of African American Residents: 6,663
Percent Change Since 2010: 46.5%
More on Richmond Heights: Data
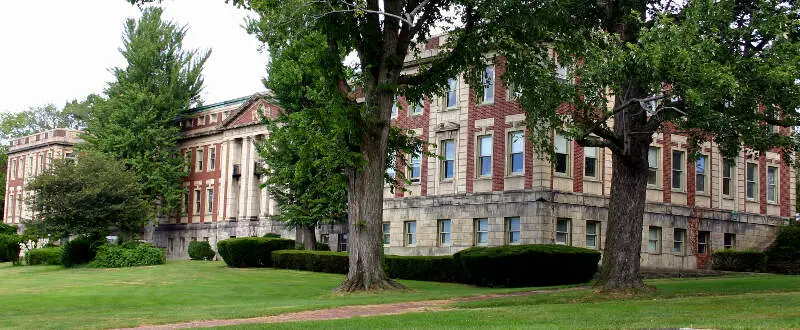
8. North College Hill
/10
Population: 9,564
% African American: 61.64%
# Of African American Residents: 5,895
Percent Change Since 2010: 33.79%
More on North College Hill: Data
9. Bedford
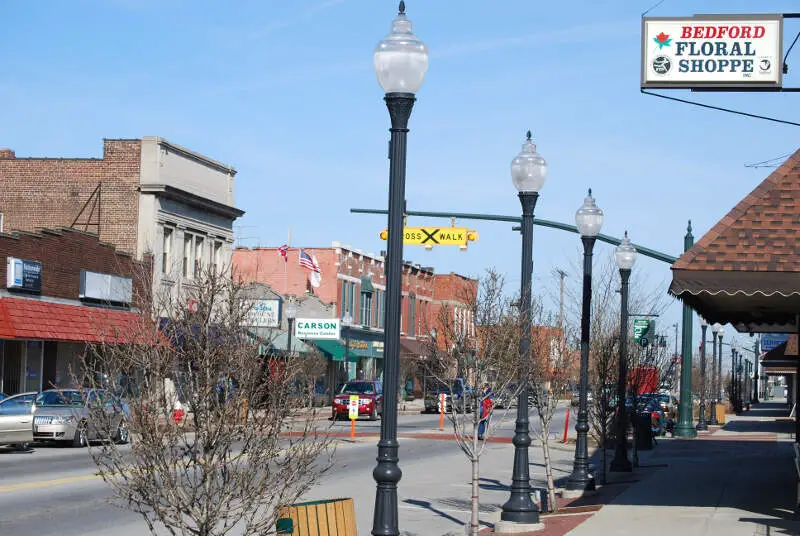
/10
Population: 12,960
% African American: 54.05%
# Of African American Residents: 7,005
Percent Change Since 2010: 29.41%
More on Bedford: Data
10. Forest Park
/10
Population: 19,994
% African American: 53.86%
# Of African American Residents: 10,768
Percent Change Since 2010: -12.67%
More on Forest Park: Data
Methodology: How We Determined The Cities In Ohio With The Largest Black Population For 2025
We still believe in the accuracy of data — especially from the Census. So that’s where we went to get the race breakdown across Ohio.
That leads us to the Census’s most recently available data, the 2019-2023 American Community Survey data from the US Census.
Specifically, we looked at table B03002: Hispanic OR LATINO ORIGIN BY RACE. Here are the category names as defined by the Census:
- Hispanic or Latino
- White alone*
- Black or African American alone*
- American Indian and Alaska Native alone*
- Asian alone*
- Native Hawaiian and Other Pacific Islander alone*
- Some other race alone*
- Two or more races*
Our particular column of interest was the number of people who identified as Black or African American.
We limited our analysis to non-CDPs with a population greater than 5,000 people in Ohio. That left us with 243 cities.
We then calculated the percentage of residents that are Black or African American. The percentages ranked from 92.4% to 0.0%.
Finally, we ranked each city based on the percentage of the Black population, with a higher score being more Black than a lower score. Warrensville Heights took the distinction of being the most Black, while Salem was the least African American city.
We updated this article for 2025. This is our tenth time ranking the cities in Ohio with the largest African American population.
Read on for more information on how the cities in Ohio ranked by population of African American residents or, for a more general take on diversity in America, head over to our ranking of the most diverse cities in America.
Summary: Black Populations Across Ohio
If you’re looking for a breakdown of African American populations across Ohio according to the most recent data, this is an accurate list.
The blackest cities in Ohio are Warrensville Heights, East Cleveland, Bedford Heights, Maple Heights, Euclid, Trotwood, Richmond Heights, North College Hill, Bedford, and Forest Park.
If you’re curious enough, here are the least African American places in Ohio:
- Salem
- Northwood
- Columbiana
For more Ohio reading, check out:
African American Population By City In Ohio
| Rank | City | Population | African American Population | % African American |
|---|---|---|---|---|
| 1 | Warrensville Heights | 13,585 | 12,547 | 92.36% |
| 2 | East Cleveland | 13,666 | 11,982 | 87.68% |
| 3 | Bedford Heights | 10,876 | 8,381 | 77.06% |
| 4 | Maple Heights | 23,350 | 17,230 | 73.79% |
| 5 | Euclid | 48,991 | 32,268 | 65.87% |
| 6 | Trotwood | 23,041 | 14,525 | 63.04% |
| 7 | Richmond Heights | 10,677 | 6,663 | 62.41% |
| 8 | North College Hill | 9,564 | 5,895 | 61.64% |
| 9 | Bedford | 12,960 | 7,005 | 54.05% |
| 10 | Forest Park | 19,994 | 10,768 | 53.86% |
| 11 | Garfield Heights | 29,369 | 15,714 | 53.51% |
| 12 | South Euclid | 21,606 | 11,482 | 53.14% |
| 13 | Mount Healthy | 6,932 | 3,451 | 49.78% |
| 14 | Cleveland | 367,523 | 169,138 | 46.02% |
| 15 | Springdale | 10,983 | 4,569 | 41.6% |
| 16 | Youngstown | 59,605 | 24,131 | 40.48% |
| 17 | Whitehall | 19,974 | 7,999 | 40.05% |
| 18 | Cleveland Heights | 44,694 | 17,542 | 39.25% |
| 19 | Cincinnati | 309,595 | 119,119 | 38.48% |
| 20 | Dayton | 136,741 | 51,729 | 37.83% |
| 21 | Shaker Heights | 29,004 | 9,637 | 33.23% |
| 22 | Reynoldsburg | 41,032 | 12,444 | 30.33% |
| 23 | Clayton | 13,269 | 3,867 | 29.14% |
| 24 | Akron | 189,526 | 55,219 | 29.14% |
| 25 | Columbus | 906,480 | 260,957 | 28.79% |
| 26 | Toledo | 268,461 | 75,896 | 28.27% |
| 27 | Warren | 39,057 | 11,025 | 28.23% |
| 28 | Pickerington | 23,828 | 5,912 | 24.81% |
| 29 | Canton | 70,105 | 17,041 | 24.31% |
| 30 | Willoughby Hills | 9,979 | 2,374 | 23.79% |
| 31 | Lima | 35,304 | 8,263 | 23.41% |
| 32 | Cheviot | 8,655 | 1,950 | 22.53% |
| 33 | University Heights | 13,508 | 3,027 | 22.41% |
| 34 | Sandusky | 24,748 | 5,430 | 21.94% |
| 35 | Grafton | 5,665 | 1,148 | 20.26% |
| 36 | Campbell | 7,812 | 1,527 | 19.55% |
| 37 | Moraine | 6,503 | 1,246 | 19.16% |
| 38 | Mayfield Heights | 20,082 | 3,798 | 18.91% |
| 39 | Fairfield | 44,597 | 8,210 | 18.41% |
| 40 | Mansfield | 47,686 | 8,439 | 17.7% |
| 41 | Springfield | 58,410 | 10,283 | 17.6% |
| 42 | Twinsburg | 19,346 | 3,347 | 17.3% |
| 43 | Lorain | 65,207 | 10,621 | 16.29% |
| 44 | Englewood | 13,388 | 2,057 | 15.36% |
| 45 | Gahanna | 35,438 | 5,334 | 15.05% |
| 46 | West Carrollton | 13,008 | 1,888 | 14.51% |
| 47 | Norwood | 19,023 | 2,701 | 14.2% |
| 48 | Huber Heights | 43,266 | 6,065 | 14.02% |
| 49 | Parma Heights | 20,616 | 2,888 | 14.01% |
| 50 | Steubenville | 18,144 | 2,501 | 13.78% |
| 51 | Middletown | 50,607 | 6,640 | 13.12% |
| 52 | Elyria | 52,833 | 6,755 | 12.79% |
| 53 | Lyndhurst | 13,854 | 1,753 | 12.65% |
| 54 | Wyoming | 8,712 | 1,087 | 12.48% |
| 55 | Oberlin | 8,054 | 947 | 11.76% |
| 56 | Solon | 23,970 | 2,793 | 11.65% |
| 57 | Macedonia | 12,142 | 1,396 | 11.5% |
| 58 | Fairlawn | 7,689 | 851 | 11.07% |
| 59 | Painesville | 20,453 | 2,211 | 10.81% |
| 60 | Ravenna | 11,286 | 1,213 | 10.75% |
| 61 | Streetsboro | 17,514 | 1,800 | 10.28% |
| 62 | Beachwood | 13,850 | 1,367 | 9.87% |
| 63 | Brooklyn | 11,203 | 1,095 | 9.77% |
| 64 | Blue Ash | 13,374 | 1,296 | 9.69% |
| 65 | Barberton | 24,977 | 2,390 | 9.57% |
| 66 | Sharonville | 13,989 | 1,290 | 9.22% |
| 67 | Alliance | 21,574 | 1,915 | 8.88% |
| 68 | Marion | 35,771 | 3,140 | 8.78% |
| 69 | Fairborn | 34,506 | 3,007 | 8.71% |
| 70 | Pataskala | 18,049 | 1,555 | 8.62% |
| 71 | Willowick | 14,182 | 1,220 | 8.6% |
| 72 | Zanesville | 24,726 | 2,120 | 8.57% |
| 73 | Berea | 18,330 | 1,563 | 8.53% |
| 74 | Massillon | 32,177 | 2,739 | 8.51% |
| 75 | Fremont | 15,851 | 1,326 | 8.37% |
| 76 | Hamilton | 63,124 | 5,264 | 8.34% |
| 77 | Westerville | 38,543 | 3,210 | 8.33% |
| 78 | Kent | 27,190 | 2,252 | 8.28% |
| 79 | Chillicothe | 21,958 | 1,816 | 8.27% |
| 80 | Ashtabula | 17,919 | 1,425 | 7.95% |
| 81 | Riverside | 24,432 | 1,923 | 7.87% |
| 82 | Conneaut | 12,378 | 949 | 7.67% |
| 83 | Xenia | 25,555 | 1,932 | 7.56% |
| 84 | Willoughby | 23,934 | 1,735 | 7.25% |
| 85 | Centerville | 24,815 | 1,715 | 6.91% |
| 86 | Orrville | 8,361 | 528 | 6.32% |
| 87 | Lakewood | 50,229 | 3,119 | 6.21% |
| 88 | Kettering | 57,442 | 3,455 | 6.01% |
| 89 | Brook Park | 18,359 | 1,061 | 5.78% |
| 90 | Vandalia | 15,100 | 870 | 5.76% |
| 91 | The Village Of Indian Hill | 6,048 | 341 | 5.64% |
| 92 | Reading | 10,490 | 574 | 5.47% |
| 93 | Cambridge | 10,046 | 541 | 5.39% |
| 94 | Mason | 35,148 | 1,884 | 5.36% |
| 95 | Martins Ferry | 6,192 | 327 | 5.28% |
| 96 | Bowling Green | 30,051 | 1,476 | 4.91% |
| 97 | Wilmington | 12,637 | 619 | 4.9% |
| 98 | Oxford | 22,069 | 1,066 | 4.83% |
| 99 | Urbana | 11,153 | 536 | 4.81% |
| 100 | Parma | 80,131 | 3,786 | 4.72% |