
There’s no denying it: there are plenty of places in Illinois that are downright beautiful and full of excitement.
Unfortunately, not all towns and cities in Prairie State are so lucky.
Just like in all U.S. States, there are definitely some boring places within Illinois’s’ borders. You know the places where everyone has an AARP card and the most exciting thing they do all day is post a picture of their grandchild on Facebook.
Like South Barrington, for instance. In our latest analysis, we found that this city was the most boring city in all of Oklahoma according to Saturday Night Science. But don’t feel bad if you’re a resident of South Barrington. There are plenty of other boring, lackluster places in Illinois as well.
Here they are. Try not to jump out of your seat with excitement.
Table Of Contents: Top Ten | Methodology | Summary | Table
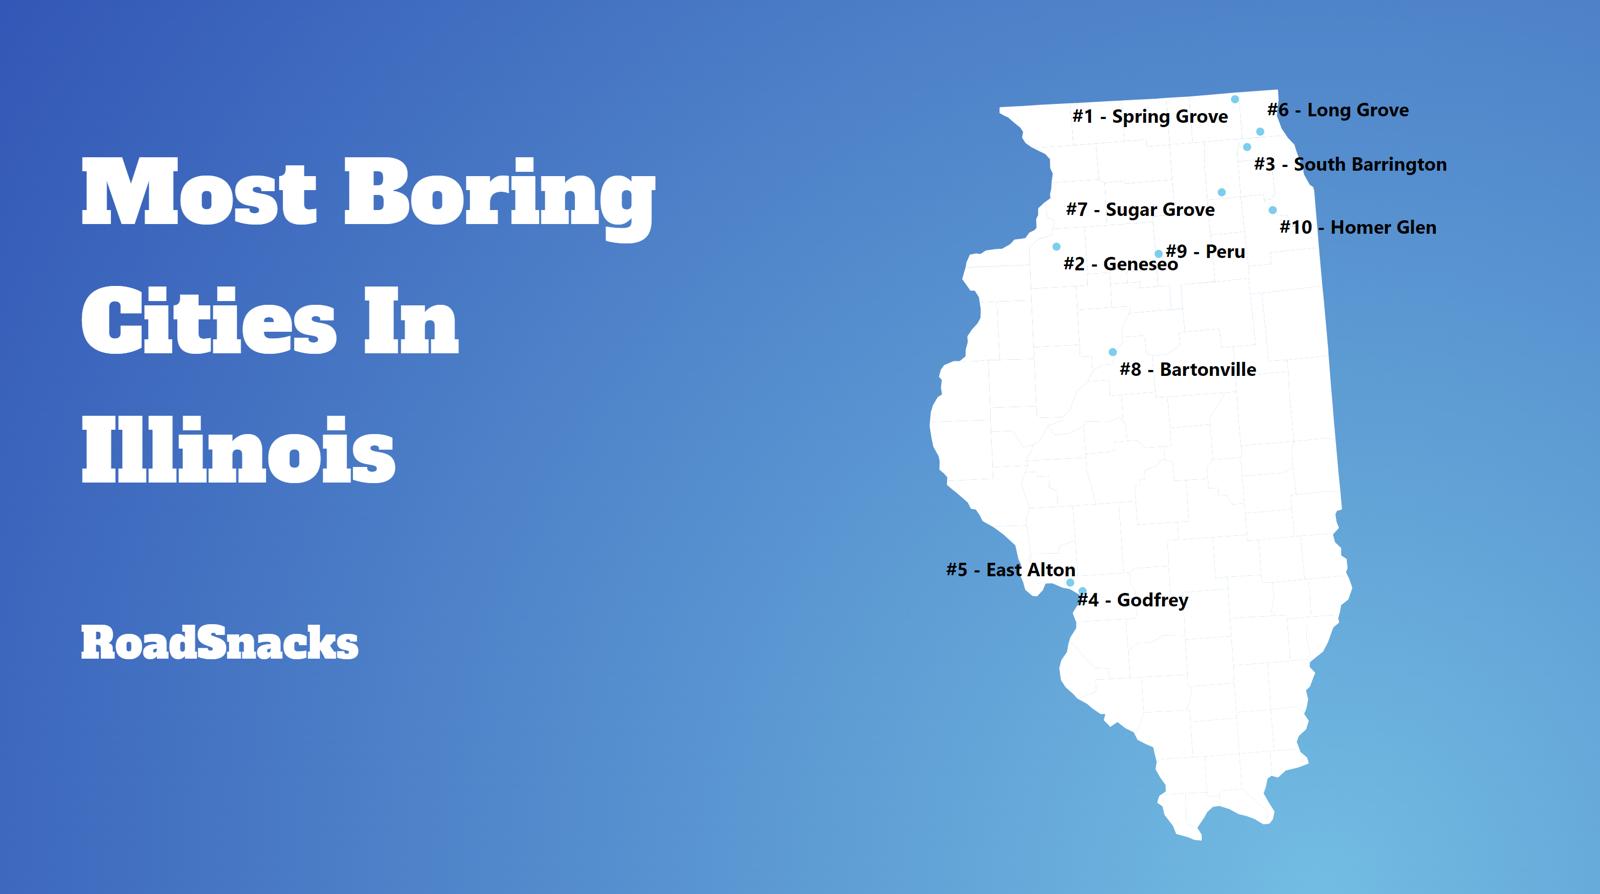
The 10 Most Boring Places In Illinois
- South Barrington
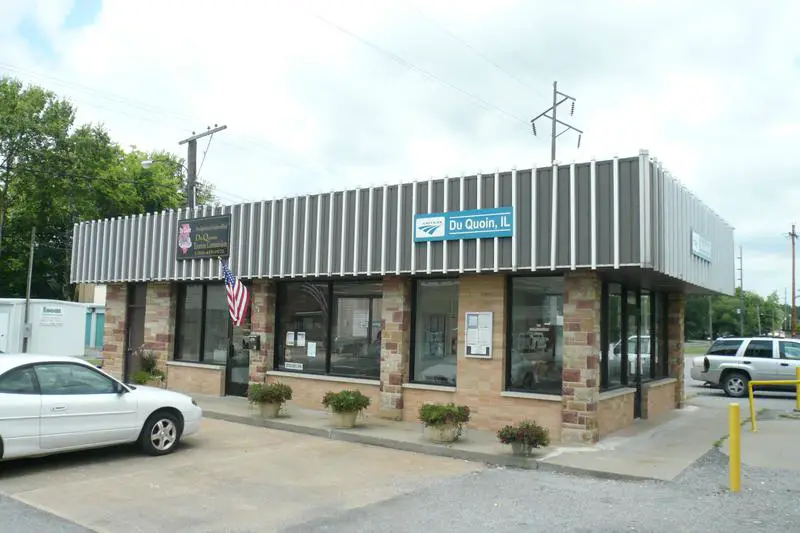
- Du Quoin
- Sugar Grove
- Godfrey
- Long Grove
- Peru
- Johnsburg
- Bartonville
- East Alton
- Inverness
Don’t freak out, in fact, believe it not, a boring city is actually one a lot of people would like to call home.
Before you get all upset if your city’s name is on the list, rest assured that we didn’t use personal opinion when it comes to what classifies a city or town as “boring” or “exciting”. We crunched actual numbers to figure out which towns are statistically more boring.
Showing this data to you is the kind of thing that a real estate agent knows, but would never share.
For more Illinois reading, check out:
The 10 Most Boring Places In Illinois For 2025
1. South Barrington
/10
Average Age: 49.2
% Married: 29.0%
More on South Barrington:

/10

/10

/10

/10

/10

/10

/10

/10

/10
Methodology: How we determined the boring cities in the Prairie State
You would present the following case to your friends if you were argueing with them at a bar about the most boring place to live in Illinois. And that’s why we call it Saturday Night Science.
Because our data speaks more truth than feelings.
To figure out how boring a place is, we factored in things we generally think make people exciting, and then we figure out which cities have the least number of those exciting people.
We used the U.S. American Community Census data to gather the information presented here. HSome of the things people tend to think of as making a city’s population boring include:
- % of Population Over 25 (higher is more boring)
- % of Married Household (higher is more boring)
- Average Age (higher is more boring)
- % of Households With Kids (higher is more boring)
- Population density (lower is more boring)
Then, our algorithm generates a ranking for each place in these categories. After crunching the numbers, all of the cities ranked from most boring to most exciting.
For this ranking, we used every Illinois city with at least 5,000 residents. This keeps us from prejudicing our rankings by including very small pockets of retired people.
Grab your rocker and hold on.
We updated this article for 2025, and it’s our tenth time ranking the most boring cities in Illinois.
There You Have It – Now That You’re Asleep
On a ranking like this, there are usually no winners, but since Illinois isn’t necessarily the most boring state in the United States, the cities on this ranking can at least take solace that there are, in fact, more boring cities in the country.
The most boring cities in Illinois are South Barrington, Du Quoin, Sugar Grove, Godfrey, Long Grove, Peru, Johnsburg, Bartonville, East Alton, and Inverness.
If you’re also curious enough, here are the most exciting places in Illinois, according to science:
- Urbana
- Champaign
- Normal
For more Illinois reading, check out:
- Best Places To Live In Illinois
- Cheapest Places To Live In Illinois
- Most Dangerous Cities In Illinois
- Richest Cities In Illinois
- Safest Places In Illinois
- Worst Places To Live In Illinois
- Most Expensive Places To Live In Illinois
Detailed List Of The Most Boring Cities In Illinois For 2025
| Rank | City | Population | Average Age | % Married | % Kids |
|---|---|---|---|---|---|
| 1 | South Barrington, IL | 5,004 | 49.2 | 29.0% | 39.7% |
| 2 | Du Quoin, IL | 5,780 | 42.8 | 36.0% | 35.8% |
| 3 | Sugar Grove, IL | 9,233 | 45.0 | 38.0% | 34.3% |
| 4 | Godfrey, IL | 17,743 | 49.9 | 40.0% | 23.6% |
| 5 | Long Grove, IL | 8,266 | 48.8 | 37.0% | 30.6% |
| 6 | Peru, IL | 9,863 | 45.4 | 42.0% | 29.7% |
| 7 | Johnsburg, IL | 6,374 | 41.3 | 41.0% | 36.3% |
| 8 | Bartonville, IL | 5,854 | 42.0 | 40.0% | 28.2% |
| 9 | East Alton, IL | 5,729 | 45.2 | 33.0% | 30.5% |
| 10 | Inverness, IL | 7,541 | 54.3 | 34.0% | 27.6% |
| 11 | Geneseo, IL | 6,577 | 45.3 | 41.0% | 29.3% |
| 12 | Campton Hills, IL | 10,724 | 43.1 | 42.0% | 39.2% |
| 13 | Homer Glen, IL | 24,516 | 42.0 | 44.0% | 33.6% |
| 14 | Spring Grove, IL | 5,866 | 38.9 | 50.0% | 46.6% |
| 15 | Flossmoor, IL | 9,666 | 44.2 | 40.0% | 34.5% |
| 16 | Braidwood, IL | 6,175 | 44.3 | 47.0% | 29.0% |
| 17 | Gilberts, IL | 8,389 | 40.2 | 40.0% | 40.3% |
| 18 | Columbia, IL | 11,063 | 39.9 | 33.0% | 36.5% |
| 19 | Shorewood, IL | 18,218 | 44.5 | 44.0% | 30.8% |
| 20 | Frankfort, IL | 20,417 | 41.8 | 43.0% | 44.0% |
| 21 | Monticello, IL | 6,332 | 42.9 | 45.0% | 25.2% |
| 22 | Oak Brook, IL | 8,028 | 51.7 | 26.0% | 31.4% |
| 23 | Manteno, IL | 8,942 | 47.1 | 46.0% | 25.2% |
| 24 | Hawthorn Woods, IL | 9,145 | 40.6 | 42.0% | 44.1% |
| 25 | Monee, IL | 5,104 | 38.4 | 34.0% | 32.3% |
| 26 | Crete, IL | 8,382 | 49.4 | 31.0% | 24.7% |
| 27 | Huntley, IL | 27,859 | 49.7 | 38.0% | 24.8% |
| 28 | Litchfield, IL | 6,814 | 43.2 | 38.0% | 24.9% |
| 29 | Morton, IL | 16,503 | 40.7 | 44.0% | 32.2% |
| 30 | Colona, IL | 5,189 | 40.8 | 32.0% | 35.5% |
| 31 | Lake Bluff, IL | 5,834 | 44.9 | 28.0% | 40.7% |
| 32 | Lemont, IL | 17,643 | 43.7 | 37.0% | 36.6% |
| 33 | Winthrop Harbor, IL | 6,663 | 51.6 | 36.0% | 19.2% |
| 34 | Willow Springs, IL | 5,871 | 45.4 | 37.0% | 20.1% |
| 35 | Northfield, IL | 5,683 | 50.5 | 29.0% | 30.8% |
| 36 | Bethalto, IL | 9,244 | 41.5 | 43.0% | 31.8% |
| 37 | Mokena, IL | 19,906 | 44.1 | 51.0% | 32.2% |
| 38 | Lake Barrington, IL | 5,400 | 52.7 | 28.0% | 27.0% |
| 39 | Hoopeston, IL | 5,039 | 44.5 | 39.0% | 20.4% |
| 40 | Maryville, IL | 8,280 | 49.8 | 31.0% | 22.2% |
| 41 | East Peoria, IL | 22,485 | 42.4 | 41.0% | 23.5% |
| 42 | Highland Park, IL | 30,229 | 46.0 | 35.0% | 31.8% |
| 43 | Burr Ridge, IL | 11,119 | 58.1 | 31.0% | 21.3% |
| 44 | Mount Zion, IL | 6,076 | 40.1 | 52.0% | 41.2% |
| 45 | Metropolis, IL | 5,898 | 46.3 | 24.0% | 28.5% |
| 46 | Elburn, IL | 6,054 | 43.4 | 42.0% | 33.8% |
| 47 | Princeton, IL | 7,829 | 45.4 | 31.0% | 22.8% |
| 48 | Highland, IL | 10,268 | 42.1 | 33.0% | 28.1% |
| 49 | Winfield, IL | 9,982 | 46.0 | 39.0% | 26.9% |
| 50 | Canton, IL | 13,408 | 44.9 | 34.0% | 22.8% |
| 51 | Waterloo, IL | 11,055 | 40.2 | 32.0% | 33.7% |
| 52 | Palos Heights, IL | 11,817 | 51.2 | 47.0% | 22.2% |
| 53 | Channahon, IL | 13,854 | 38.2 | 47.0% | 39.5% |
| 54 | Itasca, IL | 9,525 | 42.4 | 33.0% | 27.1% |
| 55 | Fox Lake, IL | 10,872 | 43.3 | 32.0% | 21.6% |
| 56 | Orland Park, IL | 57,961 | 46.8 | 38.0% | 26.1% |
| 57 | Deerfield, IL | 19,185 | 44.5 | 36.0% | 35.6% |
| 58 | Glencoe, IL | 8,715 | 45.4 | 34.0% | 41.0% |
| 59 | Barrington, IL | 11,049 | 43.1 | 32.0% | 41.0% |
| 60 | Jerseyville, IL | 7,432 | 43.0 | 31.0% | 30.5% |
| 61 | Silvis, IL | 7,939 | 47.4 | 31.0% | 21.5% |
| 62 | Benton, IL | 7,076 | 42.2 | 34.0% | 26.1% |
| 63 | Spring Valley, IL | 5,508 | 42.5 | 35.0% | 26.3% |
| 64 | Mchenry, IL | 27,774 | 43.5 | 33.0% | 25.3% |
| 65 | Herrin, IL | 12,271 | 40.1 | 34.0% | 28.4% |
| 66 | Carterville, IL | 5,822 | 39.9 | 38.0% | 27.2% |
| 67 | Algonquin, IL | 29,904 | 41.3 | 36.0% | 32.5% |
| 68 | Volo, IL | 6,398 | 34.3 | 40.0% | 50.9% |
| 69 | Bartlett, IL | 40,531 | 41.3 | 33.0% | 36.8% |
| 70 | Morris, IL | 14,775 | 40.4 | 38.0% | 27.8% |
| 71 | Chillicothe, IL | 6,185 | 43.9 | 32.0% | 19.4% |
| 72 | Pontiac, IL | 11,483 | 43.4 | 29.0% | 24.6% |
| 73 | Marion, IL | 16,796 | 40.4 | 33.0% | 25.8% |
| 74 | Pingree Grove, IL | 10,576 | 37.7 | 37.0% | 45.4% |
| 75 | Geneva, IL | 21,299 | 41.7 | 36.0% | 33.3% |
| 76 | Glenview, IL | 47,682 | 46.3 | 28.0% | 33.1% |
| 77 | Northbrook, IL | 34,642 | 49.2 | 29.0% | 28.4% |
| 78 | Ottawa, IL | 18,714 | 40.3 | 35.0% | 32.3% |
| 79 | Batavia, IL | 26,730 | 41.2 | 37.0% | 34.8% |
| 80 | Taylorville, IL | 11,149 | 39.5 | 33.0% | 31.2% |
| 81 | Kewanee, IL | 12,280 | 43.6 | 32.0% | 26.5% |
| 82 | Park Ridge, IL | 39,241 | 44.5 | 37.0% | 33.5% |
| 83 | Pana, IL | 5,277 | 45.0 | 30.0% | 17.4% |
| 84 | Sandwich, IL | 7,121 | 38.9 | 39.0% | 35.1% |
| 85 | Mahomet, IL | 9,755 | 36.5 | 41.0% | 44.2% |
| 86 | Lake Villa, IL | 8,707 | 40.3 | 32.0% | 41.0% |
| 87 | Yorkville, IL | 22,350 | 34.5 | 39.0% | 39.1% |
| 88 | New Lenox, IL | 27,456 | 37.3 | 53.0% | 42.1% |
| 89 | St. Charles, IL | 32,733 | 41.6 | 33.0% | 30.2% |
| 90 | Lake Zurich, IL | 19,727 | 41.3 | 34.0% | 36.4% |
| 91 | Rockton, IL | 8,238 | 40.1 | 32.0% | 40.6% |
| 92 | Lincolnshire, IL | 7,937 | 51.3 | 21.0% | 25.9% |
| 93 | Tinley Park, IL | 55,007 | 42.3 | 39.0% | 27.7% |
| 94 | Lake Forest, IL | 19,190 | 46.1 | 26.0% | 29.1% |
| 95 | Manhattan, IL | 10,315 | 32.1 | 52.0% | 51.8% |
| 96 | Vandalia, IL | 6,041 | 42.9 | 21.0% | 23.6% |
| 97 | Mattoon, IL | 16,334 | 42.6 | 33.0% | 24.6% |
| 98 | Hampshire, IL | 8,351 | 37.4 | 29.0% | 40.7% |
| 99 | Paris, IL | 8,154 | 44.9 | 28.0% | 21.8% |
| 100 | Matteson, IL | 18,681 | 44.2 | 29.0% | 27.6% |
You say that the algorithm is unbiased and that the data isn’t influenced by your opinion, but all of the categories are based on what you “generally think” make for an exciting town. You assume that married people, people with kids, and people over 65 years old are boring. Your “data” and “science” is flawed.
#8 is a picture of Lincoln Park in Chicago. Great reporting right there.
Picture #8 is not Long Grove, IL, more like Lincoln Park Zoo in Chicago!
Urbana-Champaign is only “exciting” on your list because practically none of the people there are married because it’s a COLLEGE TOWN! I’ve been there, and I wouldn’t call it “exciting” either.