
There’s no denying it: there are plenty of places in Michigan that are downright beautiful and full of excitement.
Unfortunately, not all towns and cities in Wolverine State are so lucky.
Just like in all U.S. States, there are definitely some boring places within Michigan’s’ borders. You know the places where everyone has an AARP card and the most exciting thing they do all day is post a picture of their grandchild on Facebook.
Like Norton Shores, for instance. In our latest analysis, we found that this city was the most boring city in all of Oklahoma according to Saturday Night Science. But don’t feel bad if you’re a resident of Norton Shores. There are plenty of other boring, lackluster places in Michigan as well.
Here they are. Try not to jump out of your seat with excitement.
Table Of Contents: Top Ten | Methodology | Summary | Table
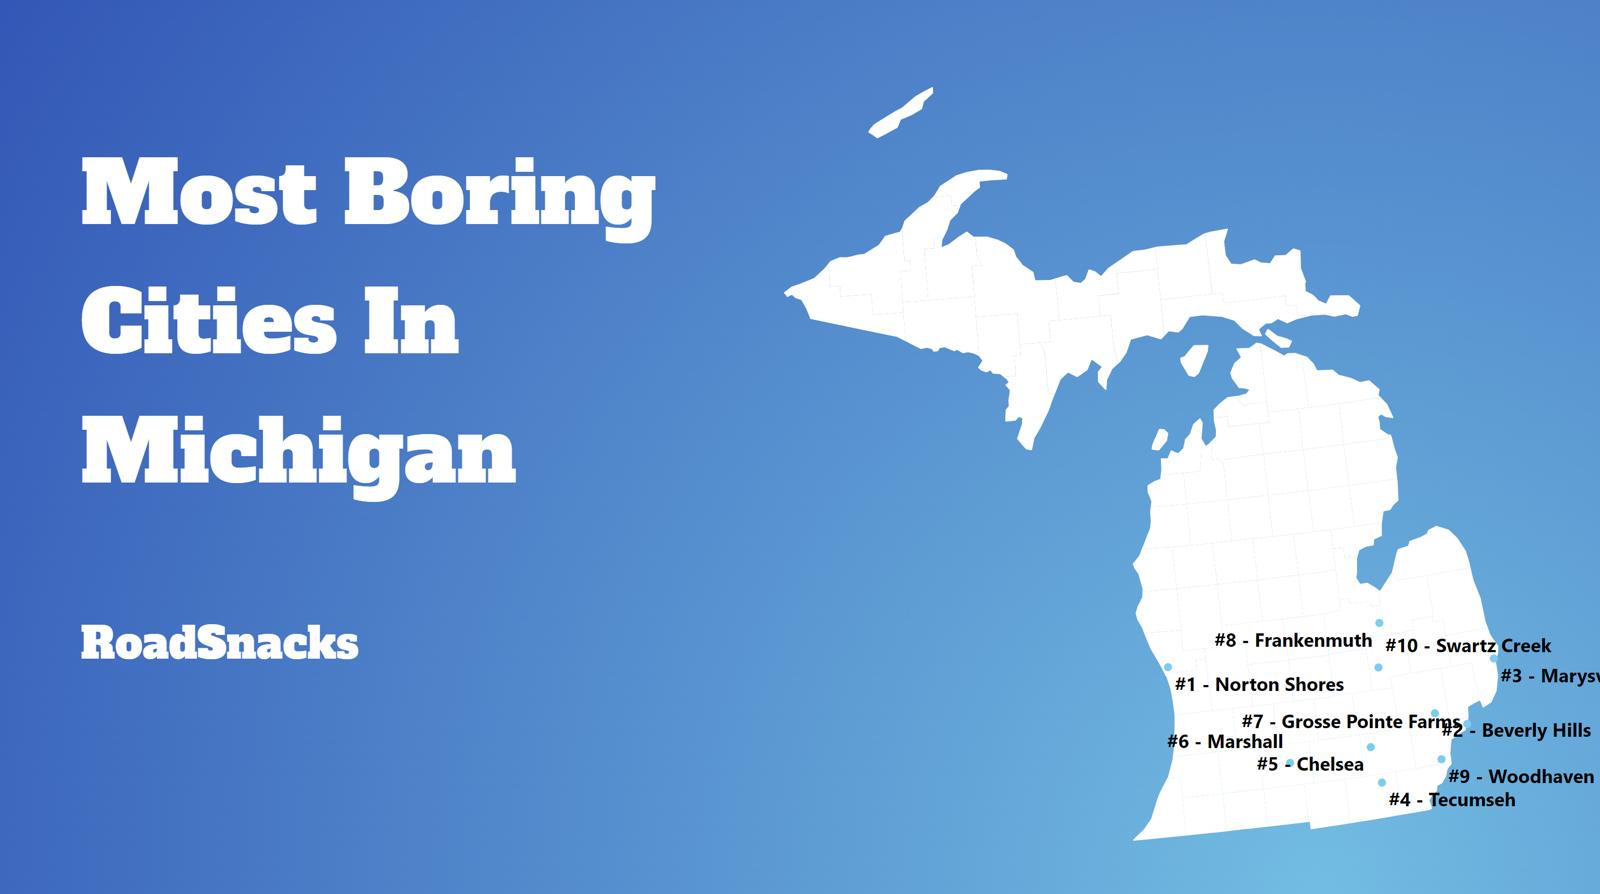
The 10 Most Boring Places In Michigan
Don’t freak out, in fact, believe it not, a boring city is actually one a lot of people would like to call home.
Before you get all upset if your city’s name is on the list, rest assured that we didn’t use personal opinion when it comes to what classifies a city or town as “boring” or “exciting”. We crunched actual numbers to figure out which towns are statistically more boring.
Showing this data to you is the kind of thing that a real estate agent knows, but would never share.
For more Michigan reading, check out:
The 10 Most Boring Places In Michigan For 2025

/10

/10

/10

/10

/10

/10
/10
/10

/10

/10
Methodology: How we determined the boring cities in the Wolverine State
You would present the following case to your friends if you were argueing with them at a bar about the most boring place to live in Michigan. And that’s why we call it Saturday Night Science.
Because our data speaks more truth than feelings.
To figure out how boring a place is, we factored in things we generally think make people exciting, and then we figure out which cities have the least number of those exciting people.
We used the U.S. American Community Census data to gather the information presented here. HSome of the things people tend to think of as making a city’s population boring include:
- % of Population Over 25 (higher is more boring)
- % of Married Household (higher is more boring)
- Average Age (higher is more boring)
- % of Households With Kids (higher is more boring)
- Population density (lower is more boring)
Then, our algorithm generates a ranking for each place in these categories. After crunching the numbers, all of the cities ranked from most boring to most exciting.
For this ranking, we used every Michigan city with at least 5,000 residents. This keeps us from prejudicing our rankings by including very small pockets of retired people.
Grab your rocker and hold on.
We updated this article for 2025, and it’s our tenth time ranking the most boring cities in Michigan.
There You Have It – Now That You’re Asleep
On a ranking like this, there are usually no winners, but since Michigan isn’t necessarily the most boring state in the United States, the cities on this ranking can at least take solace that there are, in fact, more boring cities in the country.
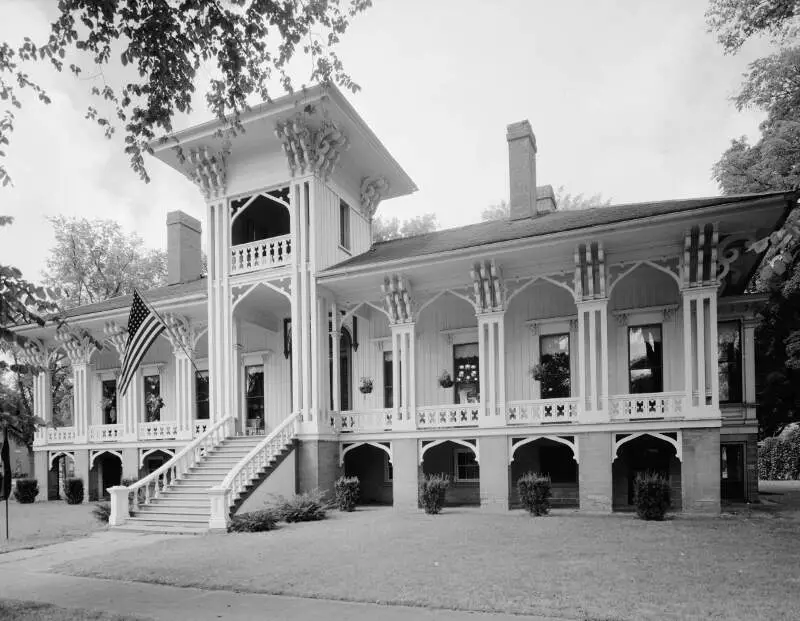
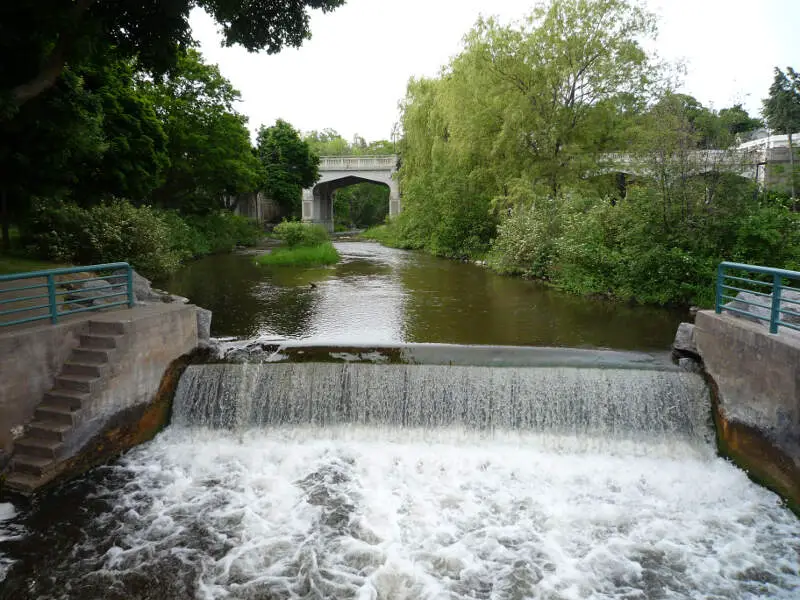
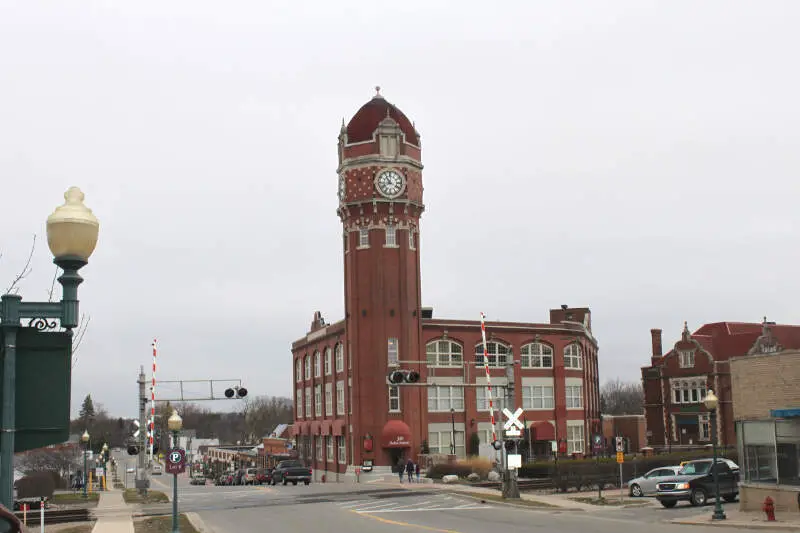
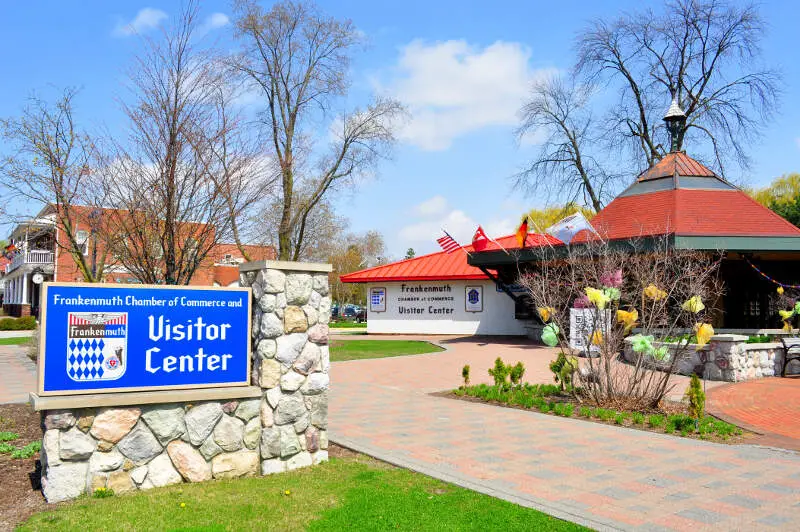
The most boring cities in Michigan are Norton Shores, Marysville, Swartz Creek, Beverly Hills, Marshall, Petoskey, Chelsea, Frankenmuth, Grosse Pointe Farms, and St. Johns.
If you’re also curious enough, here are the most exciting places in Michigan, according to science:
- East Lansing
- Ypsilanti
- Ann Arbor
For more Michigan reading, check out:
- Best Places To Live In Michigan
- Cheapest Places To Live In Michigan
- Most Dangerous Places in Michigan
- Richest Cities In Michigan
- Safest Places In Michigan
- Worst Places To Live In Michigan
- Most Expensive Places To Live In Michigan
Detailed List Of The Most Boring Cities In Michigan For 2025
| Rank | City | Population | Average Age | % Married | % Kids |
|---|---|---|---|---|---|
| 1 | Norton Shores, MI | 25,000 | 40.1 | 47.0% | 33.8% |
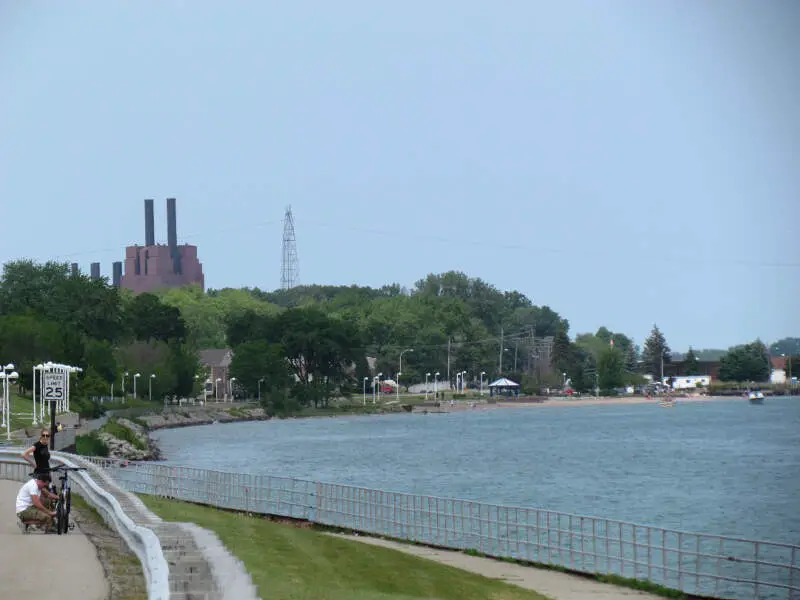
| 2 | Marysville, MI | 9,942 | 43.6 | 44.0% | 28.9% |
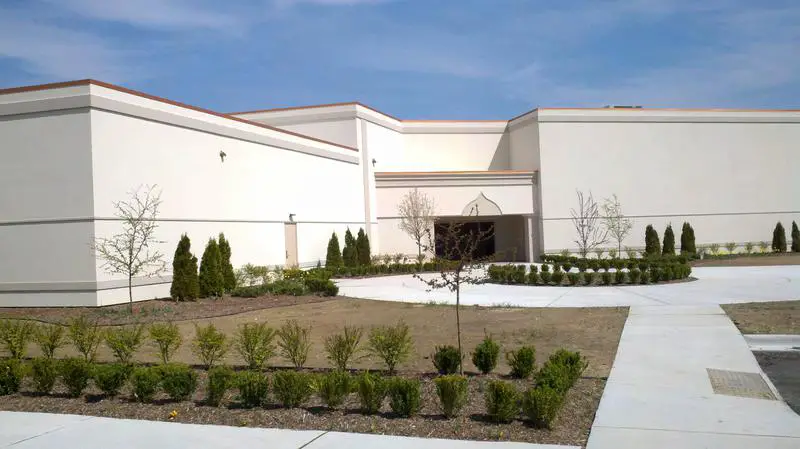
| 3 | Swartz Creek, MI | 5,856 | 45.8 | 33.0% | 30.6% |
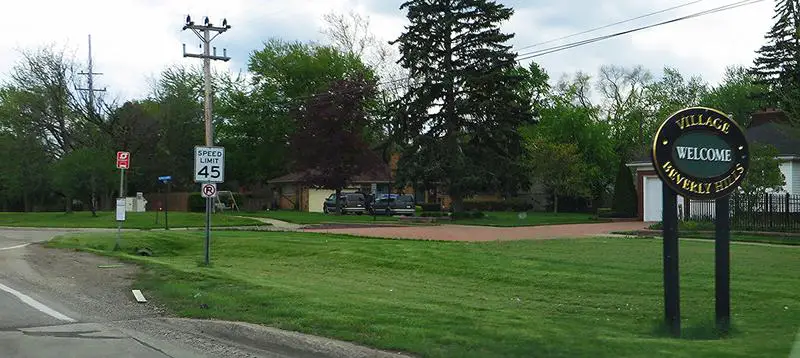
| 4 | Beverly Hills, MI | 10,507 | 45.5 | 42.0% | 38.3% |
| 5 | Marshall, MI | 6,797 | 46.5 | 38.0% | 19.9% |
| 6 | Petoskey, MI | 5,851 | 42.9 | 38.0% | 26.4% |
| 7 | Chelsea, MI | 5,420 | 50.8 | 37.0% | 19.6% |
| 8 | Frankenmuth, MI | 5,108 | 51.8 | 46.0% | 18.8% |
| 9 | Grosse Pointe Farms, MI | 9,957 | 51.0 | 43.0% | 27.8% |
| 10 | St. Johns, MI | 7,712 | 43.5 | 39.0% | 27.8% |
| 11 | Tecumseh, MI | 8,655 | 39.6 | 35.0% | 29.9% |
| 12 | St. Clair, MI | 5,581 | 43.4 | 37.0% | 30.6% |
| 13 | Grand Ledge, MI | 7,797 | 44.5 | 45.0% | 24.1% |
| 14 | Grand Haven, MI | 10,966 | 46.4 | 38.0% | 20.5% |
| 15 | Woodhaven, MI | 12,761 | 45.5 | 39.0% | 23.4% |
| 16 | Alpena, MI | 10,178 | 45.2 | 32.0% | 21.0% |
| 17 | Northville, MI | 6,080 | 46.1 | 36.0% | 27.4% |
| 18 | Trenton, MI | 18,242 | 48.3 | 41.0% | 24.2% |
| 19 | Huntington Woods, MI | 6,322 | 43.8 | 46.0% | 34.6% |
| 20 | Rockford, MI | 6,162 | 40.9 | 43.0% | 30.0% |
| 21 | New Baltimore, MI | 12,060 | 42.9 | 46.0% | 27.6% |
| 22 | Ironwood, MI | 5,004 | 50.4 | 27.0% | 16.2% |
| 23 | Brighton, MI | 7,576 | 46.7 | 36.0% | 18.8% |
| 24 | Iron Mountain, MI | 7,508 | 42.9 | 33.0% | 23.5% |
| 25 | Livonia, MI | 94,058 | 45.1 | 38.0% | 25.0% |
| 26 | Holly, MI | 5,971 | 43.4 | 43.0% | 21.3% |
| 27 | Milford, MI | 6,467 | 42.1 | 40.0% | 28.0% |
| 28 | Midland, MI | 42,461 | 38.9 | 35.0% | 28.6% |
| 29 | Escanaba, MI | 12,374 | 43.5 | 31.0% | 22.3% |
| 30 | Davison, MI | 5,082 | 43.3 | 32.0% | 30.0% |
| 31 | Flat Rock, MI | 10,418 | 38.3 | 39.0% | 36.6% |
| 32 | Burton, MI | 29,529 | 42.5 | 32.0% | 26.1% |
| 33 | Mason, MI | 8,239 | 41.1 | 33.0% | 27.3% |
| 34 | Grosse Pointe Woods, MI | 16,177 | 43.3 | 44.0% | 28.3% |
| 35 | Gladstone, MI | 5,240 | 41.5 | 34.0% | 26.6% |
| 36 | Saline, MI | 8,976 | 46.0 | 29.0% | 24.4% |
| 37 | Fenton, MI | 11,950 | 38.3 | 37.0% | 27.3% |
| 38 | Allen Park, MI | 28,128 | 43.2 | 41.0% | 27.1% |
| 39 | Belding, MI | 5,949 | 37.2 | 31.0% | 35.5% |
| 40 | Kingsford, MI | 5,138 | 40.9 | 34.0% | 27.1% |
| 41 | Zeeland, MI | 5,691 | 39.9 | 40.0% | 27.0% |
| 42 | Hastings, MI | 7,515 | 41.7 | 34.0% | 22.3% |
| 43 | Eaton Rapids, MI | 5,197 | 40.2 | 33.0% | 31.1% |
| 44 | Hudsonville, MI | 7,711 | 32.4 | 50.0% | 41.8% |
| 45 | Ludington, MI | 7,664 | 43.8 | 35.0% | 22.2% |
| 46 | Plymouth, MI | 9,234 | 44.1 | 33.0% | 28.7% |
| 47 | Manistee, MI | 6,275 | 47.2 | 33.0% | 21.2% |
| 48 | Rochester Hills, MI | 76,086 | 40.9 | 30.0% | 31.8% |
| 49 | Flushing, MI | 8,323 | 39.5 | 42.0% | 27.4% |
| 50 | Novi, MI | 66,224 | 39.9 | 23.0% | 36.0% |
| 51 | Walker, MI | 25,201 | 36.3 | 37.0% | 25.7% |
| 52 | Romulus, MI | 24,951 | 35.5 | 33.0% | 35.5% |
| 53 | Grosse Pointe, MI | 5,561 | 43.5 | 41.0% | 30.3% |
| 54 | Grosse Pointe Park, MI | 11,394 | 40.5 | 41.0% | 32.0% |
| 55 | Troy, MI | 87,307 | 42.2 | 25.0% | 32.0% |
| 56 | Cadillac, MI | 10,404 | 40.4 | 32.0% | 23.7% |
| 57 | St. Louis, MI | 6,926 | 38.8 | 19.0% | 29.8% |
| 58 | Milan, MI | 6,070 | 37.2 | 35.0% | 29.6% |
| 59 | Dundee, MI | 5,584 | 36.2 | 29.0% | 27.5% |
| 60 | St. Clair Shores, MI | 58,287 | 43.7 | 38.0% | 19.9% |
| 61 | Lapeer, MI | 9,053 | 38.8 | 29.0% | 25.1% |
| 62 | Grandville, MI | 16,135 | 34.4 | 44.0% | 30.3% |
| 63 | Menominee, MI | 8,370 | 49.0 | 17.0% | 18.8% |
| 64 | Greenville, MI | 8,897 | 37.8 | 31.0% | 27.4% |
| 65 | Fraser, MI | 14,604 | 41.6 | 31.0% | 28.1% |
| 66 | Ishpeming, MI | 6,173 | 35.5 | 34.0% | 29.3% |
| 67 | Farmington Hills, MI | 83,316 | 41.4 | 28.0% | 25.4% |
| 68 | Portage, MI | 49,015 | 37.2 | 33.0% | 28.3% |
| 69 | Riverview, MI | 12,269 | 41.2 | 34.0% | 27.7% |
| 70 | Charlotte, MI | 9,269 | 35.9 | 32.0% | 32.8% |
| 71 | Coldwater, MI | 13,847 | 40.2 | 19.0% | 30.1% |
| 72 | East Grand Rapids, MI | 11,394 | 37.0 | 45.0% | 50.5% |
| 73 | Birmingham, MI | 21,612 | 41.1 | 33.0% | 29.8% |
| 74 | Richmond, MI | 5,839 | 38.3 | 27.0% | 26.9% |
| 75 | Ionia, MI | 12,950 | 38.2 | 24.0% | 26.8% |
| 76 | Utica, MI | 5,184 | 44.8 | 26.0% | 18.8% |
| 77 | Southgate, MI | 29,551 | 39.4 | 34.0% | 27.1% |
| 78 | Monroe, MI | 20,330 | 36.9 | 31.0% | 29.2% |
| 79 | Sterling Heights, MI | 133,473 | 41.5 | 27.0% | 27.0% |
| 80 | Berkley, MI | 15,084 | 37.7 | 41.0% | 23.9% |
| 81 | Battle Creek, MI | 52,392 | 37.6 | 23.0% | 28.8% |
| 82 | South Lyon, MI | 11,825 | 41.8 | 35.0% | 24.3% |
| 83 | Wyandotte, MI | 24,593 | 40.7 | 34.0% | 23.4% |
| 84 | Mount Clemens, MI | 15,567 | 42.4 | 27.0% | 19.6% |
| 85 | Grand Blanc, MI | 7,995 | 36.2 | 33.0% | 30.9% |
| 86 | Owosso, MI | 14,658 | 38.1 | 32.0% | 28.4% |
| 87 | St. Joseph, MI | 7,805 | 43.4 | 22.0% | 14.7% |
| 88 | Farmington, MI | 11,472 | 39.6 | 29.0% | 22.9% |
| 89 | Walled Lake, MI | 7,275 | 40.7 | 26.0% | 21.2% |
| 90 | Allegan, MI | 5,182 | 32.4 | 29.0% | 30.7% |
| 91 | New Haven, MI | 6,341 | 31.1 | 31.0% | 51.4% |
| 92 | Southfield, MI | 76,025 | 42.1 | 22.0% | 21.9% |
| 93 | Howell, MI | 10,074 | 38.6 | 29.0% | 19.2% |
| 94 | Rochester, MI | 12,939 | 39.4 | 32.0% | 26.3% |
| 95 | Wixom, MI | 17,126 | 36.3 | 25.0% | 18.6% |
| 96 | Warren, MI | 138,128 | 37.9 | 28.0% | 29.0% |
| 97 | Dowagiac, MI | 5,677 | 37.3 | 21.0% | 26.2% |
| 98 | Clawson, MI | 11,314 | 40.8 | 31.0% | 18.3% |
| 99 | Roseville, MI | 47,240 | 40.0 | 29.0% | 24.8% |
| 100 | Niles, MI | 11,838 | 39.2 | 21.0% | 27.5% |
Wow! What about Marine City or Algonac? This last seemed to be more of a personal list and a way to vent your frustrations for being single. I grew up in Saginaw….Rochester and Troy have things to do compared to Saginaw. I suggest you post your pity party on your own Facebook page next time!
That’s certainly one way to look at data… Accuracy aside, the article is hilarious. I live in RH and do see some of what you mentioned. Though it really depends on what you like. Funny stuff. 🙂
My list:
1. Meade
2. Merrill
3. Reed City
4. Big Rapids
5. Trenton
6. Peck
7. Manton
8. Almont
9. Riley
10. Forestville