
Now that we’re headed towards the next big election, we wanted to get a better sense of what parts of Michigan would be the most likely to back Donald Trump again.
Specifically, which cities have the highest number of conservative voters in the Wolverine State?
To do so, we used Saturday Night Science to measure how each city in Michigan with populations greater than 5,000 voted in past elections. The cities with the highest percentage of voters who voted Republican were named the most conservative cities in the state.
Table Of Contents: Top Ten | Methodology | Summary | Table
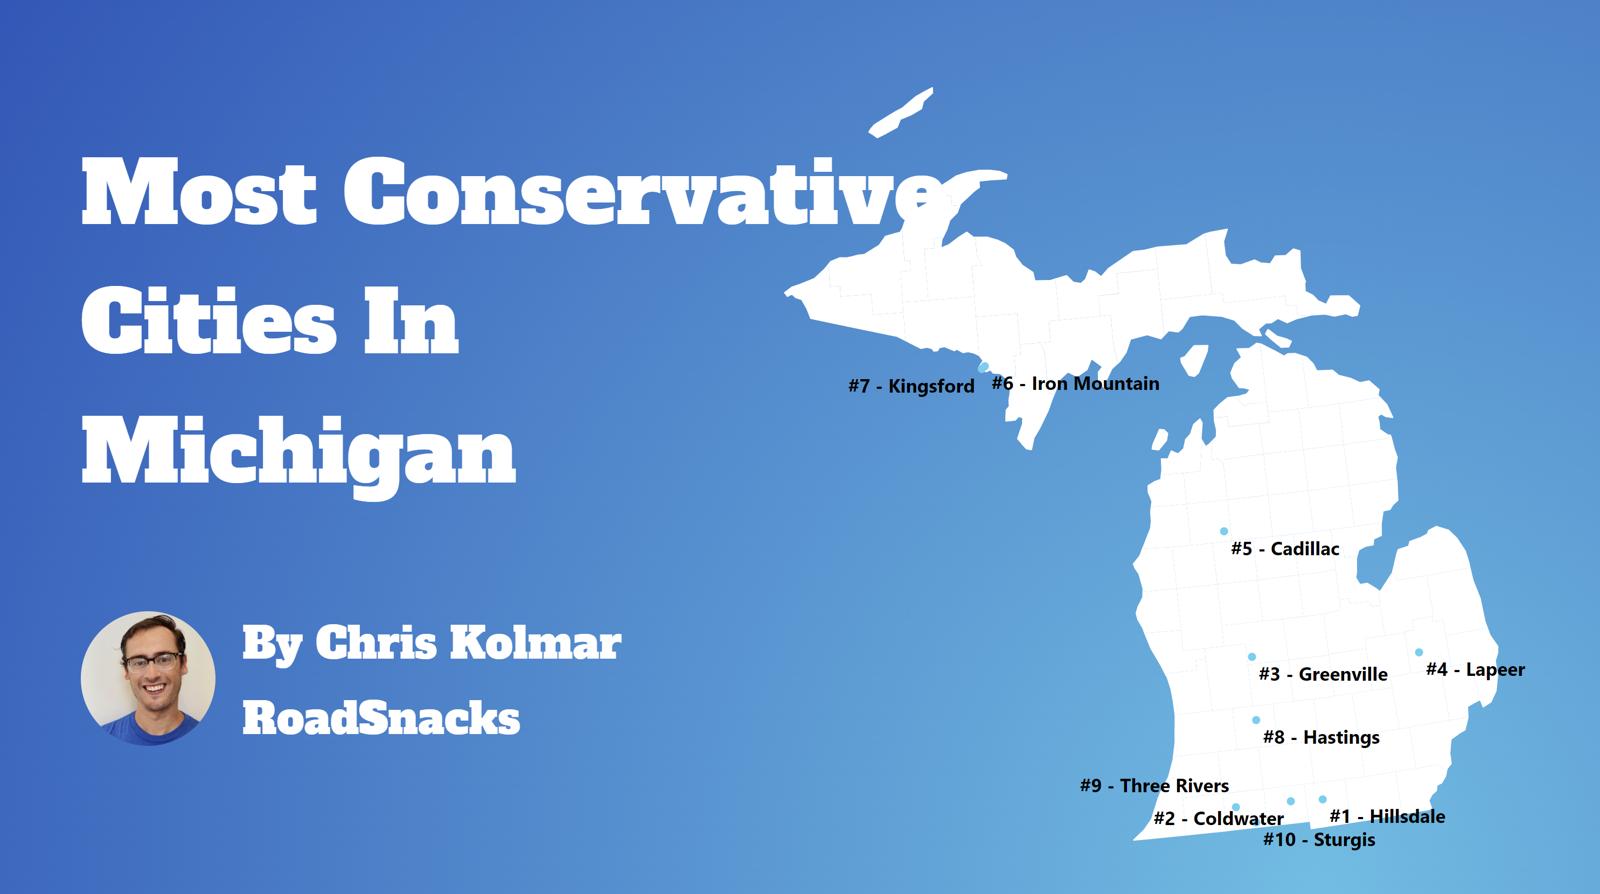
The 10 most conservative places in Michigan for 2025
If you’re wondering, Ann Arbor is the most liberal city in Michigan of all those we measured.
And to be clear, we didn’t form this list based on our own biases — we relied on the cold hard data. For more on how we ran the numbers, keep on reading. Then we’ll take a closer look at each of our top 10 most conservative cities in Michigan.
Additional reading about Michigan and the most conservative places in the country:
The 10 Most Conservative Places In Michigan For 2025

/10
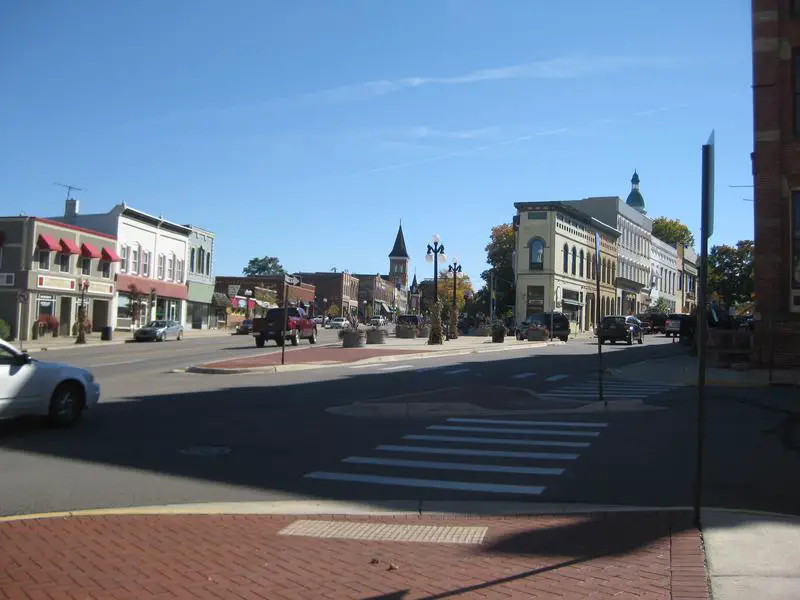
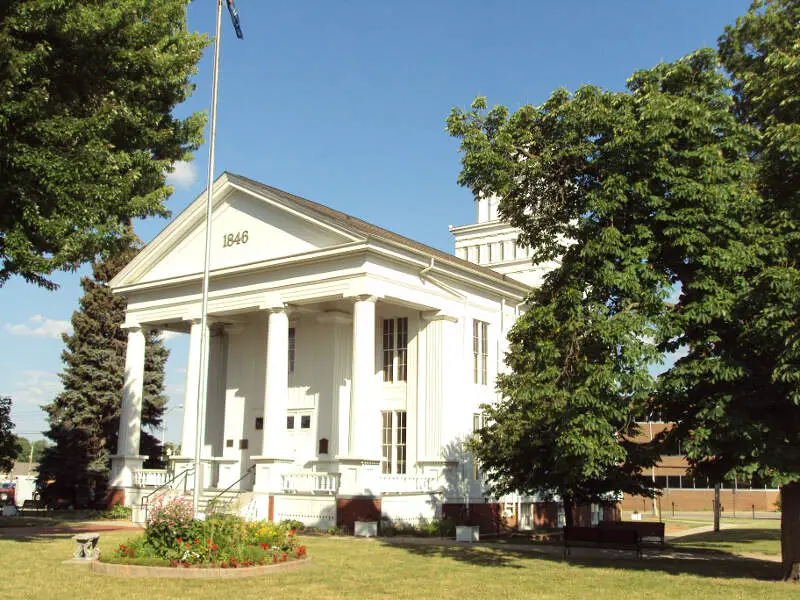
Percent Republican: 73.1%
More on Hillsdale: Data

/10
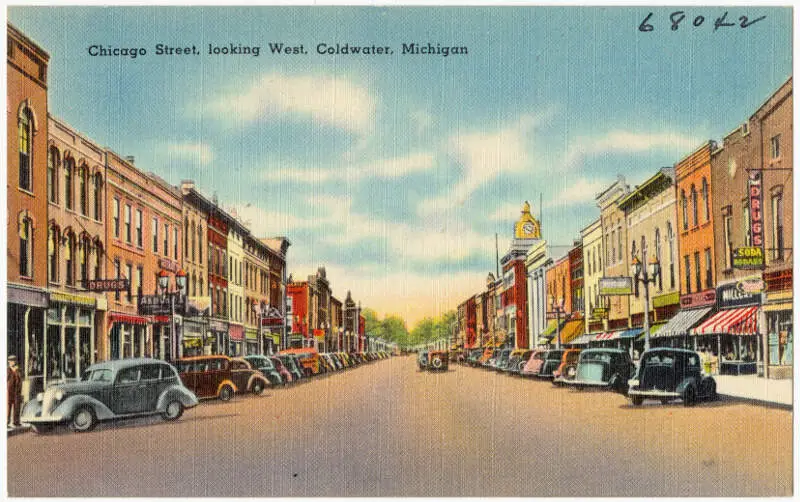
Percent Republican: 68.5%
More on Coldwater: Data

/10
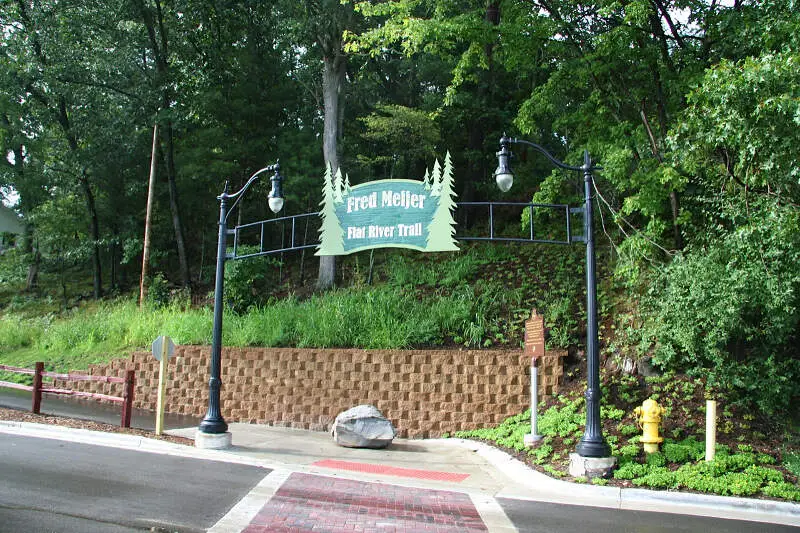
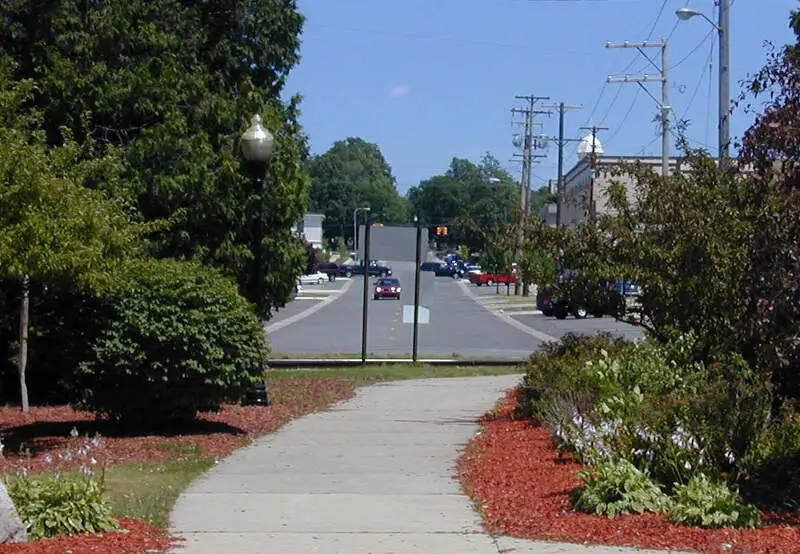
Percent Republican: 68.0%
More on Greenville: Data

/10
Percent Republican: 67.4%
More on Lapeer: Data

/10
Percent Republican: 66.3%
More on Cadillac: Data

/10
Percent Republican: 65.9%
More on Iron Mountain: Data
/10
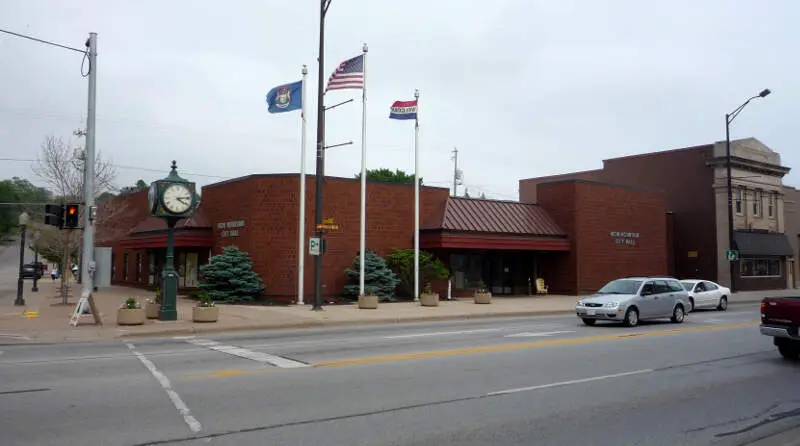
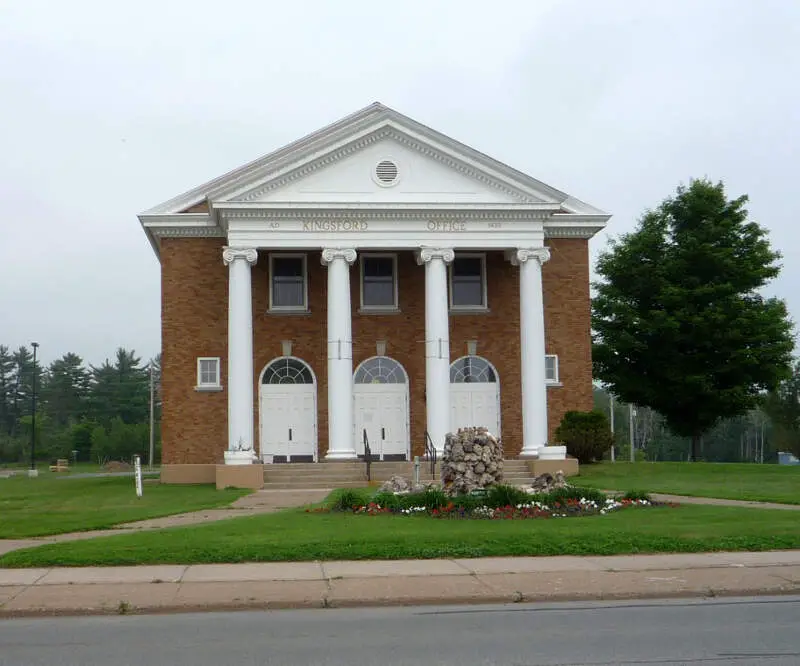
Percent Republican: 65.9%
More on Kingsford: Data

/10
Percent Republican: 65.4%
More on Hastings: Data

/10
Percent Republican: 64.9%
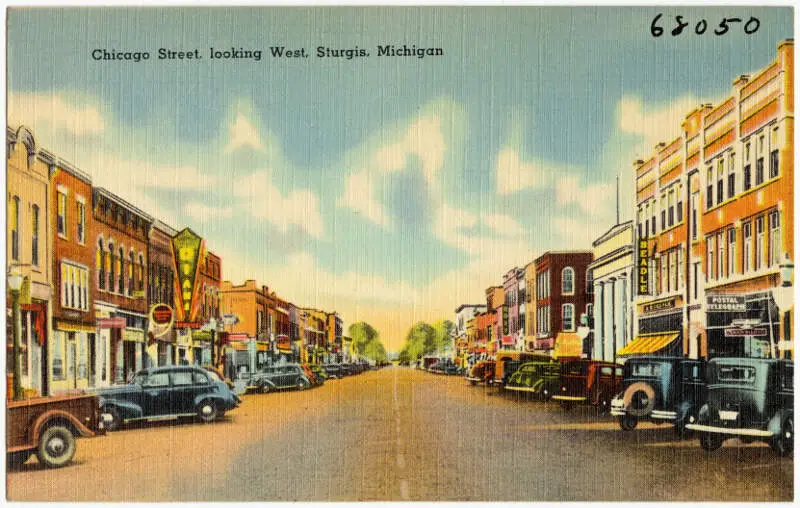
More on Sturgis: Data

/10
Percent Republican: 64.9%
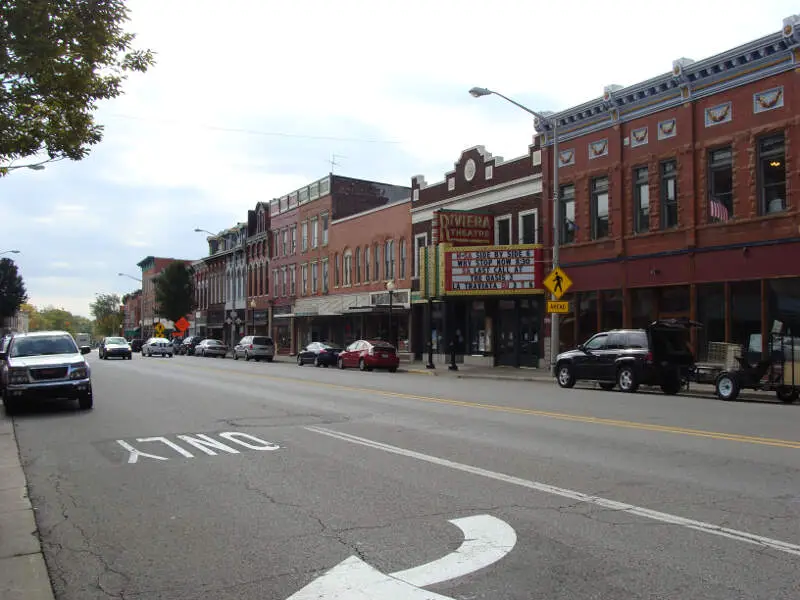
More on Three Rivers: Data
How we determined the most conservative cities in Michigan for 2025
To find the most conservative places in Michigan, we used Saturday Night Science – the argument you’d make at a bar – to find the cities with the most conservatives.
We started by making a list of every city in Michigan over 5,000 people based on the 2019-2023 American Community Survey. That left us with 154 cities and towns.
We then measured the voting record and MIT election data to determine which places rock the most rightward in their allegiances by:
- Percentage Of Votes For The Republican President In 2020
Because no voting data exists at the city level, we used county-level election results from the 2020 election. We assigned every city in a county the percentage of votes that went to the Republicans, effectively extending the county’s results to the city level. In cases where larger cities encompassed an entire county, the election outcomes accurately reflected the city’s political landscape.
Next, we ranked each city from 1 to 154 for each criterion, where number one was the most conservative.
The winner, Hillsdale, is “The Most Conservative City in Michigan For 2025”. The most liberal place in Michigan was Ann Arbor.
We updated this article for 2025. This report is our tenth time ranking the most conservative places to live in Michigan.
Summing Up The Conservative Strongholds in Michigan
Well, there you have it, the places in Michigan that have the highest number of conservatives per capita, with Hillsdale ranking as the most conservative in the entire state.
The most conservative cities in Michigan are Hillsdale, Coldwater, Greenville, Lapeer, Cadillac, Iron Mountain, Kingsford, Hastings, Sturgis, and Three Rivers.
If you’re curious, here are the least conservative cities in Michigan:
- Ann Arbor
- Chelsea
- Ypsilanti
For more Michigan reading, check out:
- Best Places To Live In Michigan
- Cheapest Places To Live In Michigan
- Most Dangerous Places in Michigan
- Richest Cities In Michigan
- Safest Places In Michigan
- Worst Places To Live In Michigan
- Most Expensive Places To Live In Michigan
Most Conservative Places In Michigan
| Rank | City | Population | % Conservative |
|---|---|---|---|
| 1 | Hillsdale, MI | 8,013 | 73.1% |
| 2 | Coldwater, MI | 13,847 | 68.5% |
| 3 | Greenville, MI | 8,897 | 68.0% |
| 4 | Lapeer, MI | 9,053 | 67.4% |
| 5 | Cadillac, MI | 10,404 | 66.3% |
| 6 | Iron Mountain, MI | 7,508 | 65.9% |
| 7 | Kingsford, MI | 5,138 | 65.9% |
| 8 | Hastings, MI | 7,515 | 65.4% |
| 9 | Sturgis, MI | 11,077 | 64.9% |
| 10 | Three Rivers, MI | 7,936 | 64.9% |
| 11 | Menominee, MI | 8,370 | 64.4% |
| 12 | St. Clair, MI | 5,581 | 64.3% |
| 13 | Richmond, MI | 5,839 | 64.3% |
| 14 | Port Huron, MI | 28,724 | 64.3% |
| 15 | Marysville, MI | 9,942 | 64.3% |
| 16 | Ionia, MI | 12,950 | 64.1% |
| 17 | Belding, MI | 5,949 | 64.1% |
| 18 | Dowagiac, MI | 5,677 | 63.7% |
| 19 | Niles, MI | 11,838 | 63.7% |
| 20 | Alma, MI | 9,421 | 63.3% |
| 21 | St. Louis, MI | 6,926 | 63.3% |
| 22 | Big Rapids, MI | 7,847 | 63.0% |
| 23 | Alpena, MI | 10,178 | 63.0% |
| 24 | Escanaba, MI | 12,374 | 62.4% |
| 25 | Gladstone, MI | 5,240 | 62.4% |
| 26 | Allegan, MI | 5,182 | 61.7% |
| 27 | Holland, MI | 34,266 | 61.7% |
| 28 | Sault Ste. Marie, MI | 13,373 | 60.5% |
| 29 | Brighton, MI | 7,576 | 60.5% |
| 30 | Howell, MI | 10,074 | 60.5% |
| 31 | Fenton, MI | 11,950 | 60.5% |
| 32 | Dundee, MI | 5,584 | 60.5% |
| 33 | Milan, MI | 6,070 | 60.5% |
| 34 | Monroe, MI | 20,330 | 60.5% |
| 35 | Flat Rock, MI | 10,418 | 60.5% |
| 36 | Grand Haven, MI | 10,966 | 59.8% |
| 37 | Hudsonville, MI | 7,711 | 59.8% |
| 38 | Zeeland, MI | 5,691 | 59.8% |
| 39 | Ludington, MI | 7,664 | 59.2% |
| 40 | Adrian, MI | 20,493 | 59.1% |
| 41 | Tecumseh, MI | 8,655 | 59.1% |
| 42 | Owosso, MI | 14,658 | 59.0% |
| 43 | Jackson, MI | 31,206 | 58.6% |
| 44 | Manistee, MI | 6,275 | 56.8% |
| 45 | Midland, MI | 42,461 | 56.4% |
| 46 | Houghton, MI | 8,341 | 56.1% |
| 47 | Ironwood, MI | 5,004 | 55.6% |
| 48 | Bay City, MI | 32,445 | 55.0% |
| 49 | Petoskey, MI | 5,851 | 54.7% |
| 50 | Marshall, MI | 6,797 | 54.6% |
| 51 | Springfield, MI | 5,295 | 54.6% |
| 52 | Albion, MI | 7,608 | 54.6% |
| 53 | Battle Creek, MI | 52,392 | 54.6% |
| 54 | Mount Clemens, MI | 15,567 | 53.4% |
| 55 | Warren, MI | 138,128 | 53.4% |
| 56 | Sterling Heights, MI | 133,473 | 53.4% |
| 57 | Center Line, MI | 8,448 | 53.4% |
| 58 | Eastpointe, MI | 34,003 | 53.4% |
| 59 | Roseville, MI | 47,240 | 53.4% |
| 60 | New Baltimore, MI | 12,060 | 53.4% |
| 61 | Utica, MI | 5,184 | 53.4% |
| 62 | New Haven, MI | 6,341 | 53.4% |
| 63 | St. Clair Shores, MI | 58,287 | 53.4% |
| 64 | Fraser, MI | 14,604 | 53.4% |
| 65 | St. Joseph, MI | 7,805 | 52.8% |
| 66 | Benton Harbor, MI | 9,023 | 52.8% |
| 67 | Lansing, MI | 112,546 | 52.4% |
| 68 | Grand Ledge, MI | 7,797 | 52.4% |
| 69 | St. Johns, MI | 7,712 | 52.4% |
| 70 | East Lansing, MI | 45,394 | 52.4% |
| 71 | Traverse City, MI | 15,491 | 50.6% |
| 72 | Mount Pleasant, MI | 21,420 | 50.4% |
| 73 | Eaton Rapids, MI | 5,197 | 49.4% |
| 74 | Charlotte, MI | 9,269 | 49.4% |
| 75 | Frankenmuth, MI | 5,108 | 49.1% |
| 76 | Saginaw, MI | 43,879 | 49.1% |
| 77 | Norton Shores, MI | 25,000 | 48.8% |
| 78 | Muskegon Heights, MI | 9,902 | 48.8% |
| 79 | Muskegon, MI | 37,203 | 48.8% |
| 80 | Wyoming, MI | 76,865 | 45.9% |
| 81 | Grand Rapids, MI | 197,768 | 45.9% |
| 82 | Rockford, MI | 6,162 | 45.9% |
| 83 | Grandville, MI | 16,135 | 45.9% |
| 84 | Kentwood, MI | 54,114 | 45.9% |
| 85 | East Grand Rapids, MI | 11,394 | 45.9% |
| 86 | Walker, MI | 25,201 | 45.9% |
| 87 | Davison, MI | 5,082 | 44.6% |
| 88 | Flushing, MI | 8,323 | 44.6% |
| 89 | Flint, MI | 80,835 | 44.6% |
| 90 | Grand Blanc, MI | 7,995 | 44.6% |
| 91 | Burton, MI | 29,529 | 44.6% |
| 92 | Swartz Creek, MI | 5,856 | 44.6% |
| 93 | Marquette, MI | 20,691 | 43.5% |
| 94 | Ishpeming, MI | 6,173 | 43.5% |
| 95 | Ferndale, MI | 19,156 | 42.3% |
| 96 | Hazel Park, MI | 14,945 | 42.3% |
| 97 | Northville, MI | 6,080 | 42.3% |
| 98 | Huntington Woods, MI | 6,322 | 42.3% |
| 99 | Clawson, MI | 11,314 | 42.3% |
| 100 | Berkley, MI | 15,084 | 42.3% |