
Like all states, New Jersey has certain places that are going on hard times. These New Jersey places have an above-average percentage of people living in poverty, out of work, or not making as much as they should be.
Even as the economy continues to improve, it’s worthwhile to look at the places in each state struggling to make ends meet. So we set our sites on locating the poorest places in New Jersey.
To do so, we used Saturday Night Science to analyze the newest Census data from the American Community Survey for the 189 cities in New Jersey with more than 5,000 people.
Table Of Contents: Top Ten | Methodology | Summary | Table
The 10 Poorest Places In New Jersey For 2025:
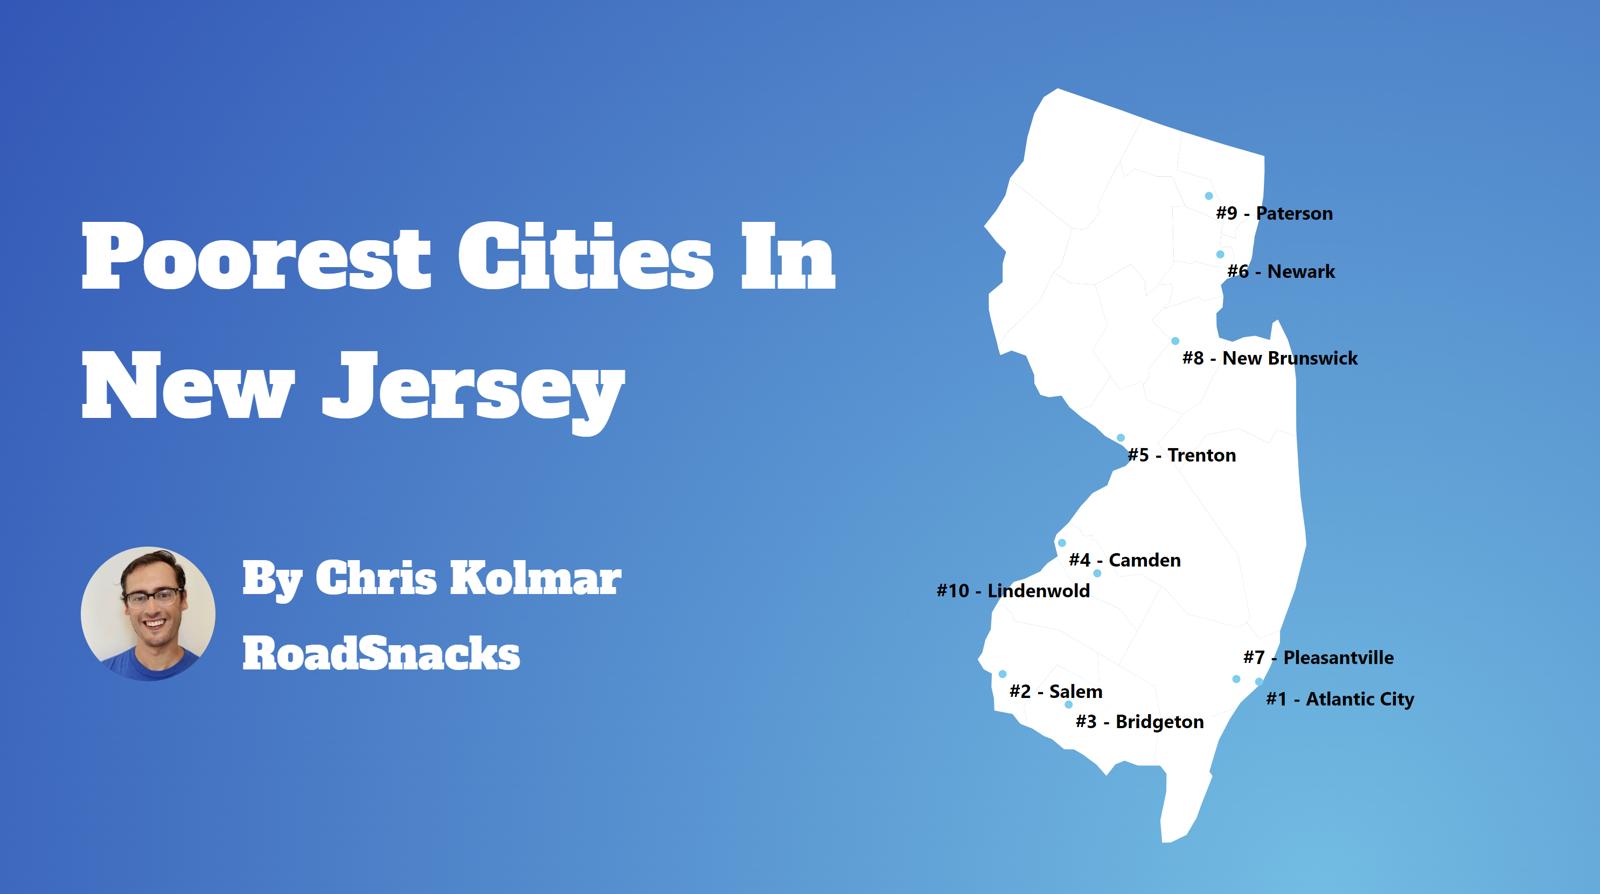
What’s the poorest city in New Jersey? According to the facts, Atlantic City is the poorest place in New Jersey for 2025.
This isn’t a commentary on the people that live there or the vibrant culture and traditions of these places. Instead, it’s just a look at the facts.
For more New Jersey reading, check out:
- Best Places To Live In New Jersey
- Cheapest Places To Live In New Jersey
- Most Dangerous Cities In New Jersey
- The poorest states in the US
- The poorest cities in the US
The 10 Poorest Cities In New Jersey For 2025
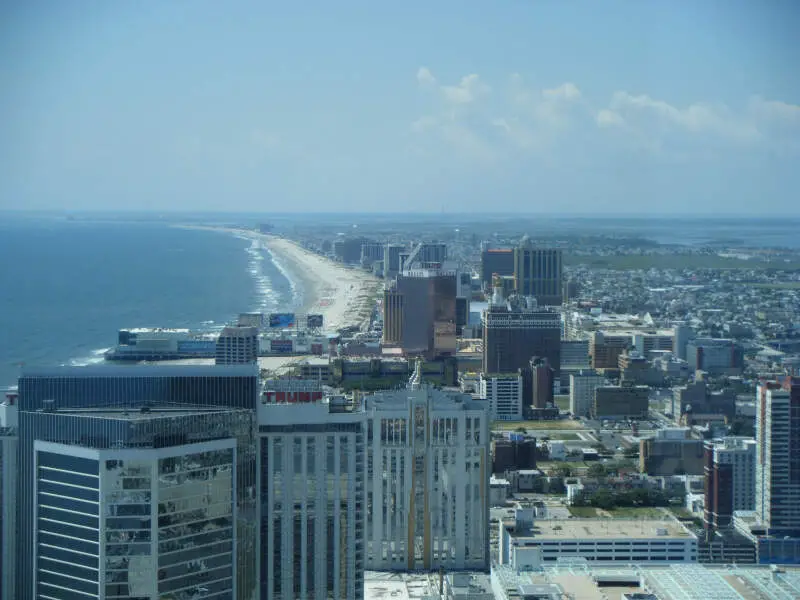
1. Atlantic City
/10
Population: 38,486
Rank Last Year: 1 (No Change)
Median Income: $36,220 (lowest)
Poverty Rate: 33.9% (highest)
People In Poverty: 13,039
More on Atlantic City: Data
Atlantic City, unfortunately, ranks as the poorest place in New Jersey thanks to combination of low pay and and a lack of jobs.
The city of 38,486 people averages the lowest median household income in New Jersey and the highest poverty rate. At the very least, the cost of living ranks in the bottom 15% of place in the state, so things like housing are relatively affordable.
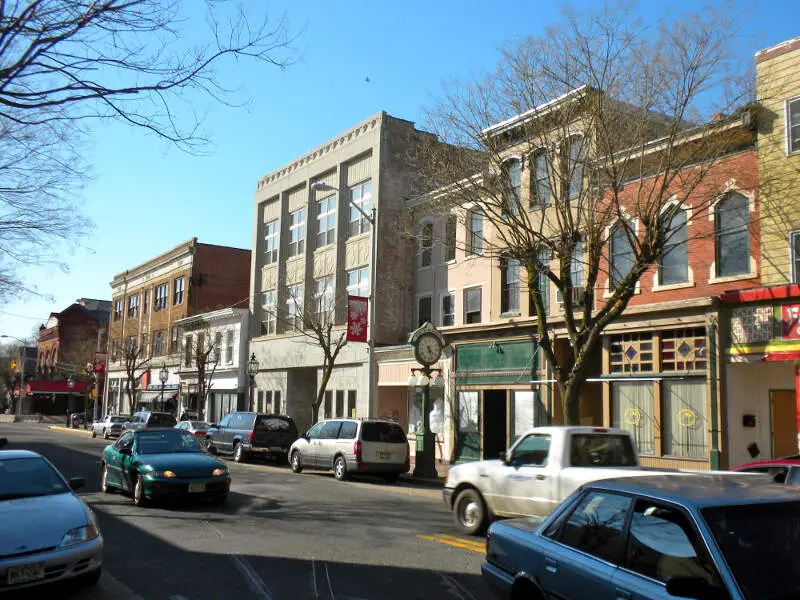
2. Bridgeton
/10
Population: 26,836
Rank Last Year: 2 (No Change)
Median Income: $46,124 (4th lowest)
Poverty Rate: 31.7% (2nd highest)
People In Poverty: 8,507
More on Bridgeton: Data
The second poorest city in New Jersey is Bridgeton.
The city ranks as having the 2nd highest incidence of poverty and 4th lowest median household income. However, the unemployment rate ‘only’ ranks as the 87th highest in the Garden State.
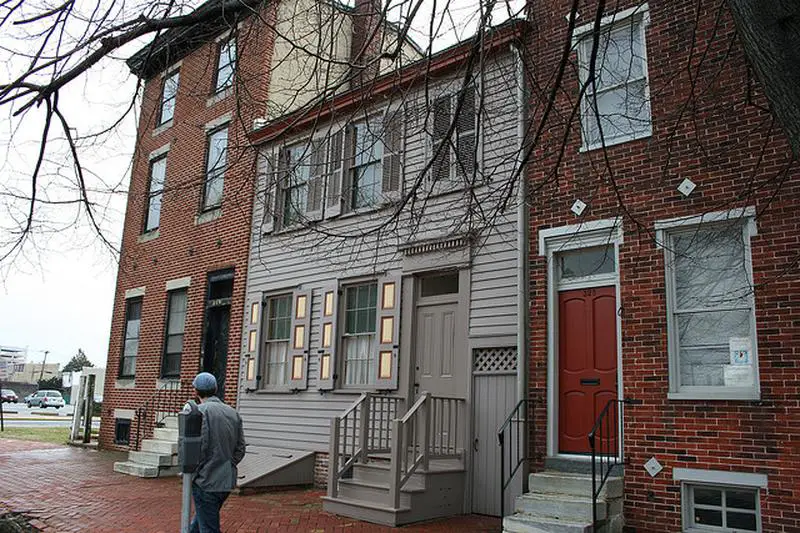
3. Camden
/10
Population: 71,471
Rank Last Year: 4 (Up 1)
Median Income: $40,450 (2nd lowest)
Poverty Rate: 28.5% (5th highest)
People In Poverty: 20,340
More on Camden: Data
Placing as the third poorest city, Camden’s median income ranks as the 2nd lowest.
And that’s a sign that there’s a relatively substantial jump in the quality of the economy from second to third place on our list. The poverty rate is 28.46% and ranks near the bottom of places in the state.
But what makes up for the relatively low incomes of the city is its low cost of living. The income you do make here goes further than in most parts of the Garden State.
4. Salem
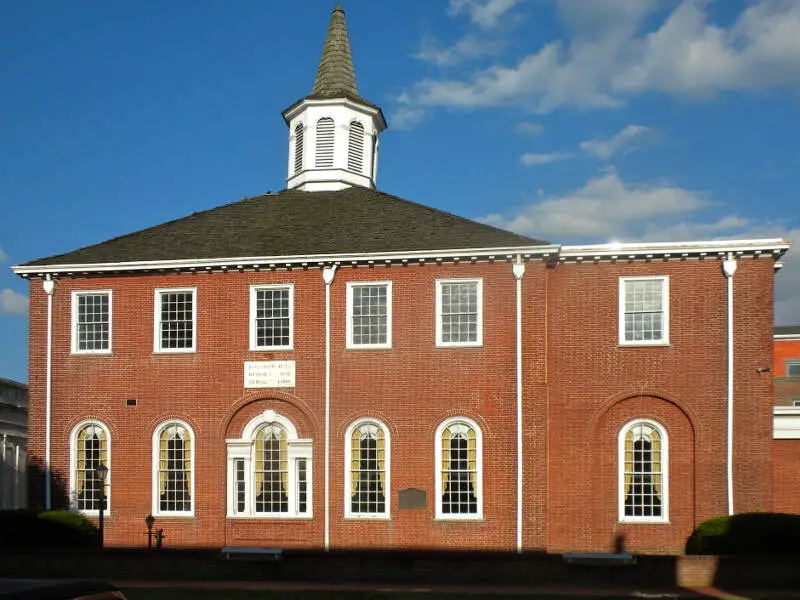
/10
Population: 5,315
Rank Last Year: 3 (Down 1)
Median Income: $40,650 (3rd lowest)
Poverty Rate: 31.2% (4th highest)
People In Poverty: 1,658
More on Salem: Data
Salem ranks as the fourth poorest place in New Jersey.
The town ranks as having the 3rd lowest median household income and the 4th highest incidence of poverty in the state.
That being said, there’s still a ton of cultural diversity in the city as it hosts many events throughout the year.
5. Trenton
/10
Population: 89,966
Rank Last Year: 5 (No Change)
Median Income: $47,102 (5th lowest)
Poverty Rate: 24.7% (7th highest)
People In Poverty: 22,194
More on Trenton: Data
The fifth poorest city in New Jersey is Trenton.
The city ranks as having the 5th lowest median income in the state. However, an extremely low cost of living prevents a good number of folks from living in poverty as the poverty rate only ranks as the 7th highest in New Jersey.
Still not the best news for Trenton.
6. Prospect Park
/10
Population: 6,286
Rank Last Year: 15 (Up 9)
Median Income: $48,615 (7th lowest)
Poverty Rate: 24.9% (6th highest)
People In Poverty: 1,562
More on Prospect Park: Data
Prospect Park ranks as the sixth poorest place in the Garden State.
It ranks as having the 6th highest incidence of poverty and the 35th highest unemployment rate.
7. Newark
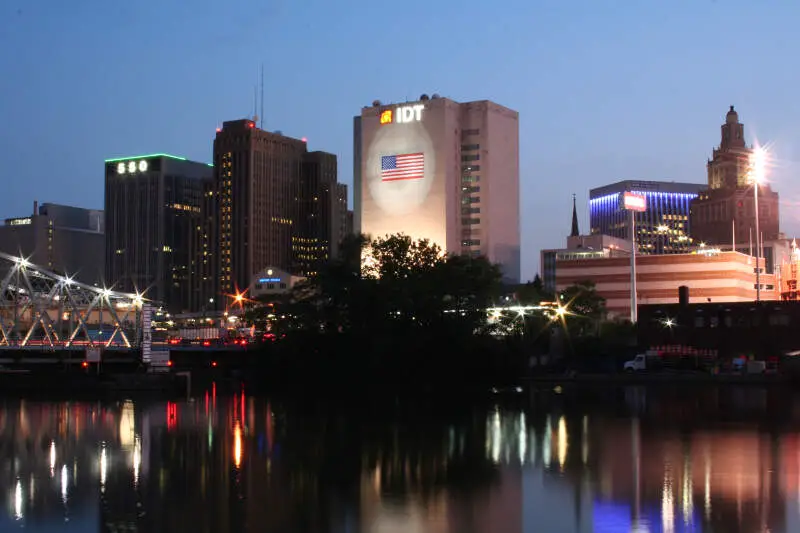
/10
Population: 307,188
Rank Last Year: 7 (No Change)
Median Income: $48,416 (6th lowest)
Poverty Rate: 24.7% (8th highest)
People In Poverty: 75,752
More on Newark: Data
Newark places as the seventh poorest city in New Jersey.
The city of over 307,188 ranks as having the 8th highest incidence of poverty in the state. However, it has a very low cost of living which helps to pay the bills each month.
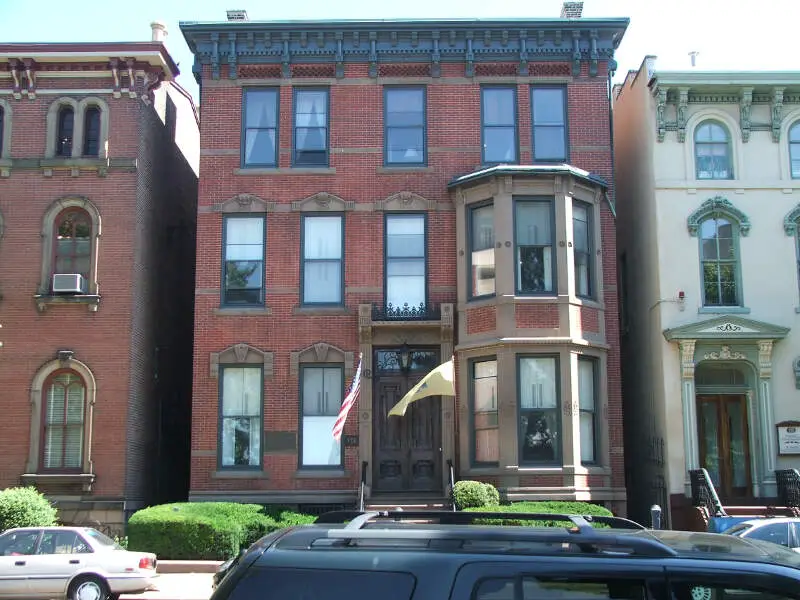
8. New Brunswick
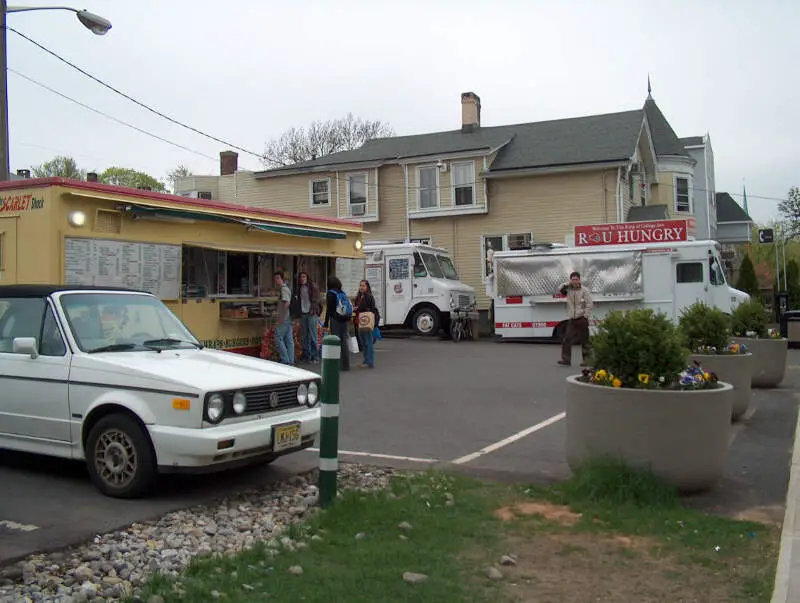
/10
Population: 55,744
Rank Last Year: 8 (No Change)
Median Income: $60,248 (15th lowest)
Poverty Rate: 31.6% (3rd highest)
People In Poverty: 17,603
More on New Brunswick: Data
New Brunswick ranks as the eighth poorest city in New Jersey.
The big issue for the town is the unemployment rate which ranks as one of the highest in the state.
9. Pleasantville
/10
Population: 20,604
Rank Last Year: 6 (Down 3)
Median Income: $52,403 (9th lowest)
Poverty Rate: 23.3% (11th highest)
People In Poverty: 4,800
More on Pleasantville: Data
Pleasantville couldn’t stay out of the top ten poorest places in New Jersey; it ranks number 9.
While the median income is the 9th lowest, there are a substantial number of people that live below the poverty line. Overall, Pleasantville ranks as having the 11th most people living in poverty of all the places we analyzed in New Jersey.
10. Lindenwold
/10
Population: 21,534
Rank Last Year: 10 (No Change)
Median Income: $55,099 (11th lowest)
Poverty Rate: 24.3% (9th highest)
People In Poverty: 5,234
More on Lindenwold: Data
And rounding out the top ten poorest cities in New Jersey is Lindenwold.
The city of 21,534 people ranks in the bottom 20% for both median income and poverty rate in the Garden State.
Methodology: How We Determined The Poorest Places In New Jersey for 2025
The first thing that comes to most people’s minds when they think about determining the poorest places is to simply the poverty rate. That is, the number of people living below a federally established level of income for a household of a certain size.
However, we don’t think that one statistic wholly encompasses what it means to be one of the “poorest places”. So we used Saturday Night Science to look at this set of criteria from the newly released 2019-2023 American Community Survey:
- Poverty Level
- Median Household Income
After we collected the data for all 189 places with more than 5,000 people in New Jersey, we ranked each place from 1 to 189 for each of the criteria, with 1 being the poorest.
We then averaged all the rankings for a place into a “Poor Score” with the place having the lowest overall Poor Score, Atlantic City, crowned the “Poorest Place In New Jersey For 2025”.
This report has been updated for 2025, which is our tenth time ranking the poorest places in New Jersey.
Summary: The Poorest Cities In New Jersey For 2025
Like we said earlier, when we set out to identify the poorest places in New Jersey, we weren’t sure what we’d encounter, but it ended up being some of the best places to live in New Jersey.
When you look at the data, the cities and places mentioned above meet the criteria for being at the very bottom of the income ladder for everyone that lives there.
If you’re curious enough, here are the richest cities in New Jersey, according to data:
-
Richest: Glen Ridge
2nd Richest: Bernardsville
3rd Richest: Fair Haven
For more New Jersey reading, check out:
- Richest Cities In New Jersey
- Safest Places In New Jersey
- Worst Places To Live In New Jersey
- Most Expensive Places To Live In New Jersey
Detailed List Of The Poorest Places To Live In New Jersey
| Rank | City | Population | Poverty Rate | Median Income | People In Poverty |
|---|---|---|---|---|---|
| 1 | Atlantic City | 38,486 | 33.9% | $36,220 | 13,039 |
| 2 | Bridgeton | 26,836 | 31.7% | $46,124 | 8,507 |
| 3 | Camden | 71,471 | 28.5% | $40,450 | 20,340 |
| 4 | Salem | 5,315 | 31.2% | $40,650 | 1,658 |
| 5 | Trenton | 89,966 | 24.7% | $47,102 | 22,194 |
| 6 | Prospect Park | 6,286 | 24.9% | $48,615 | 1,562 |
| 7 | Newark | 307,188 | 24.7% | $48,416 | 75,752 |
| 8 | New Brunswick | 55,744 | 31.6% | $60,248 | 17,603 |
| 9 | Pleasantville | 20,604 | 23.3% | $52,403 | 4,800 |
| 10 | Lindenwold | 21,534 | 24.3% | $55,099 | 5,234 |
| 11 | Paterson | 157,660 | 23.6% | $53,766 | 37,144 |
| 12 | Passaic | 69,651 | 23.1% | $56,780 | 16,054 |
| 13 | Wildwood | 5,140 | 18.1% | $51,996 | 932 |
| 14 | Perth Amboy | 55,278 | 20.0% | $58,490 | 11,050 |
| 15 | Union City | 66,375 | 21.3% | $65,369 | 14,137 |
| 16 | West New York | 51,683 | 21.4% | $67,139 | 11,054 |
| 17 | East Orange | 69,183 | 17.6% | $59,872 | 12,190 |
| 18 | Fairview | 14,920 | 17.7% | $64,152 | 2,637 |
| 19 | Phillipsburg | 15,251 | 17.4% | $67,782 | 2,659 |
| 20 | Asbury Park | 15,239 | 18.8% | $71,080 | 2,861 |
| 21 | Elizabeth | 135,887 | 15.3% | $63,874 | 20,790 |
| 22 | Pine Hill | 10,762 | 15.4% | $68,725 | 1,657 |
| 23 | Long Branch | 32,184 | 16.2% | $73,381 | 5,223 |
| 24 | Vineland | 60,692 | 13.9% | $65,854 | 8,448 |
| 25 | Newton | 8,336 | 15.0% | $73,679 | 1,252 |
| 26 | Millville | 27,432 | 13.0% | $67,190 | 3,571 |
| 27 | Burlington | 9,904 | 16.2% | $78,009 | 1,605 |
| 28 | Plainfield | 54,515 | 17.1% | $80,334 | 9,343 |
| 29 | Glassboro | 23,375 | 16.4% | $80,388 | 3,824 |
| 30 | Paulsboro | 6,213 | 12.7% | $68,750 | 787 |
| 31 | Gloucester City | 11,465 | 13.2% | $70,942 | 1,517 |
| 32 | Somerdale | 5,535 | 15.5% | $79,101 | 857 |
| 33 | Dunellen | 7,711 | 23.1% | $84,789 | 1,777 |
| 34 | Garfield | 32,502 | 14.2% | $75,701 | 4,621 |
| 35 | Woodbury | 9,992 | 13.9% | $74,769 | 1,386 |
| 36 | Clementon | 5,351 | 12.1% | $69,536 | 645 |
| 37 | Dover | 18,420 | 11.6% | $70,519 | 2,144 |
| 38 | Guttenberg | 11,638 | 13.8% | $77,636 | 1,604 |
| 39 | Somers Point | 10,461 | 11.2% | $68,542 | 1,173 |
| 40 | Bayonne | 70,468 | 14.4% | $81,285 | 10,126 |
| 41 | Freehold | 12,504 | 14.3% | $82,183 | 1,786 |
| 42 | Lodi | 25,946 | 16.0% | $84,570 | 4,153 |
| 43 | Harrison | 19,599 | 13.9% | $82,290 | 2,724 |
| 44 | Wharton | 7,254 | 18.8% | $92,548 | 1,362 |
| 45 | North Plainfield | 22,667 | 14.0% | $83,529 | 3,182 |
| 46 | Washington | 7,287 | 11.5% | $79,280 | 838 |
| 47 | Ventnor City | 9,220 | 10.3% | $74,619 | 952 |
| 48 | Wallington | 11,825 | 12.1% | $82,422 | 1,430 |
| 49 | Kearny | 40,570 | 12.5% | $83,212 | 5,055 |
| 50 | Jersey City | 289,691 | 15.6% | $94,813 | 45,249 |
| 51 | Hackensack | 45,768 | 11.2% | $82,212 | 5,148 |
| 52 | Bound Brook | 12,023 | 10.6% | $80,876 | 1,269 |
| 53 | Bellmawr | 11,678 | 9.6% | $74,812 | 1,116 |
| 54 | Hammonton | 14,746 | 11.2% | $83,044 | 1,645 |
| 55 | Keansburg | 9,729 | 11.4% | $87,484 | 1,105 |
| 56 | Roselle | 22,455 | 10.4% | $82,967 | 2,326 |
| 57 | Collingswood | 14,163 | 10.8% | $83,917 | 1,531 |
| 58 | Keyport | 7,159 | 9.3% | $79,036 | 667 |
| 59 | Manville | 10,870 | 12.3% | $93,872 | 1,334 |
| 60 | Absecon | 9,099 | 8.7% | $77,516 | 788 |
| 61 | Ridgefield Park | 13,167 | 13.0% | $98,184 | 1,714 |
| 62 | Little Ferry | 10,942 | 8.5% | $79,476 | 931 |
| 63 | Carteret | 25,187 | 10.0% | $87,553 | 2,523 |
| 64 | Cliffside Park | 25,580 | 11.3% | $94,960 | 2,887 |
| 65 | Carlstadt | 6,343 | 10.5% | $94,854 | 667 |
| 66 | Brigantine | 7,702 | 9.4% | $88,906 | 723 |
| 67 | Palmyra | 7,447 | 8.8% | $85,014 | 659 |
| 68 | Linden | 43,614 | 9.0% | $91,036 | 3,907 |
| 69 | South River | 16,007 | 11.3% | $101,853 | 1,808 |
| 70 | Stratford | 6,965 | 10.2% | $100,735 | 707 |
| 71 | Haledon | 8,936 | 9.3% | $94,178 | 831 |
| 72 | Elmwood Park | 21,287 | 10.0% | $100,852 | 2,120 |
| 73 | Runnemede | 8,310 | 9.6% | $100,366 | 796 |
| 74 | Palisades Park | 20,192 | 10.0% | $101,295 | 2,019 |
| 75 | Belmar | 5,861 | 8.6% | $92,859 | 502 |
| 76 | Hackett | 10,143 | 7.8% | $91,250 | 795 |
| 77 | Englewood | 29,342 | 9.8% | $101,398 | 2,875 |
| 78 | Clayton | 8,867 | 7.0% | $89,375 | 622 |
| 79 | East Rutherford | 10,154 | 7.4% | $91,789 | 752 |
| 80 | Barrington | 7,047 | 6.1% | $84,334 | 429 |
| 81 | Rahway | 29,748 | 6.8% | $90,852 | 2,016 |
| 82 | Woodland Park | 13,284 | 6.1% | $85,638 | 815 |
| 83 | Clifton | 89,247 | 7.4% | $99,003 | 6,631 |
| 84 | Red Bank | 12,864 | 8.9% | $101,738 | 1,143 |
| 85 | Highland Park | 14,981 | 9.2% | $101,991 | 1,385 |
| 86 | Boonton | 8,803 | 7.5% | $100,417 | 661 |
| 87 | Butler | 8,072 | 9.3% | $110,375 | 754 |
| 88 | Ocean City | 11,260 | 7.9% | $101,782 | 892 |
| 89 | Mount Arlington | 5,901 | 6.3% | $99,511 | 371 |
| 90 | Eato | 13,537 | 5.8% | $90,174 | 778 |
| 91 | Rockaway | 6,589 | 6.2% | $100,028 | 411 |
| 92 | Fort Lee | 39,818 | 8.4% | $105,535 | 3,348 |
| 93 | Sayreville | 45,237 | 6.0% | $98,629 | 2,718 |
| 94 | Bloomingdale | 7,686 | 10.9% | $126,221 | 840 |
| 95 | Matawan | 9,636 | 10.1% | $122,026 | 970 |
| 96 | Middlesex | 14,518 | 8.0% | $107,063 | 1,155 |
| 97 | Pompton Lakes | 11,010 | 9.7% | $119,038 | 1,063 |
| 98 | Hasbrouck Heights | 12,067 | 9.4% | $118,670 | 1,137 |
| 99 | Morristown | 20,256 | 9.2% | $115,409 | 1,869 |
| 100 | Tinton Falls | 19,252 | 8.6% | $113,844 | 1,663 |