
Like all states, Washington has certain places that are going on hard times. These Washington places have an above-average percentage of people living in poverty, out of work, or not making as much as they should be.
Even as the economy continues to improve, it’s worthwhile to look at the places in each state struggling to make ends meet. So we set our sites on locating the poorest places in Washington.
To do so, we used Saturday Night Science to analyze the newest Census data from the American Community Survey for the 122 cities in Washington with more than 5,000 people.
Table Of Contents: Top Ten | Methodology | Summary | Table
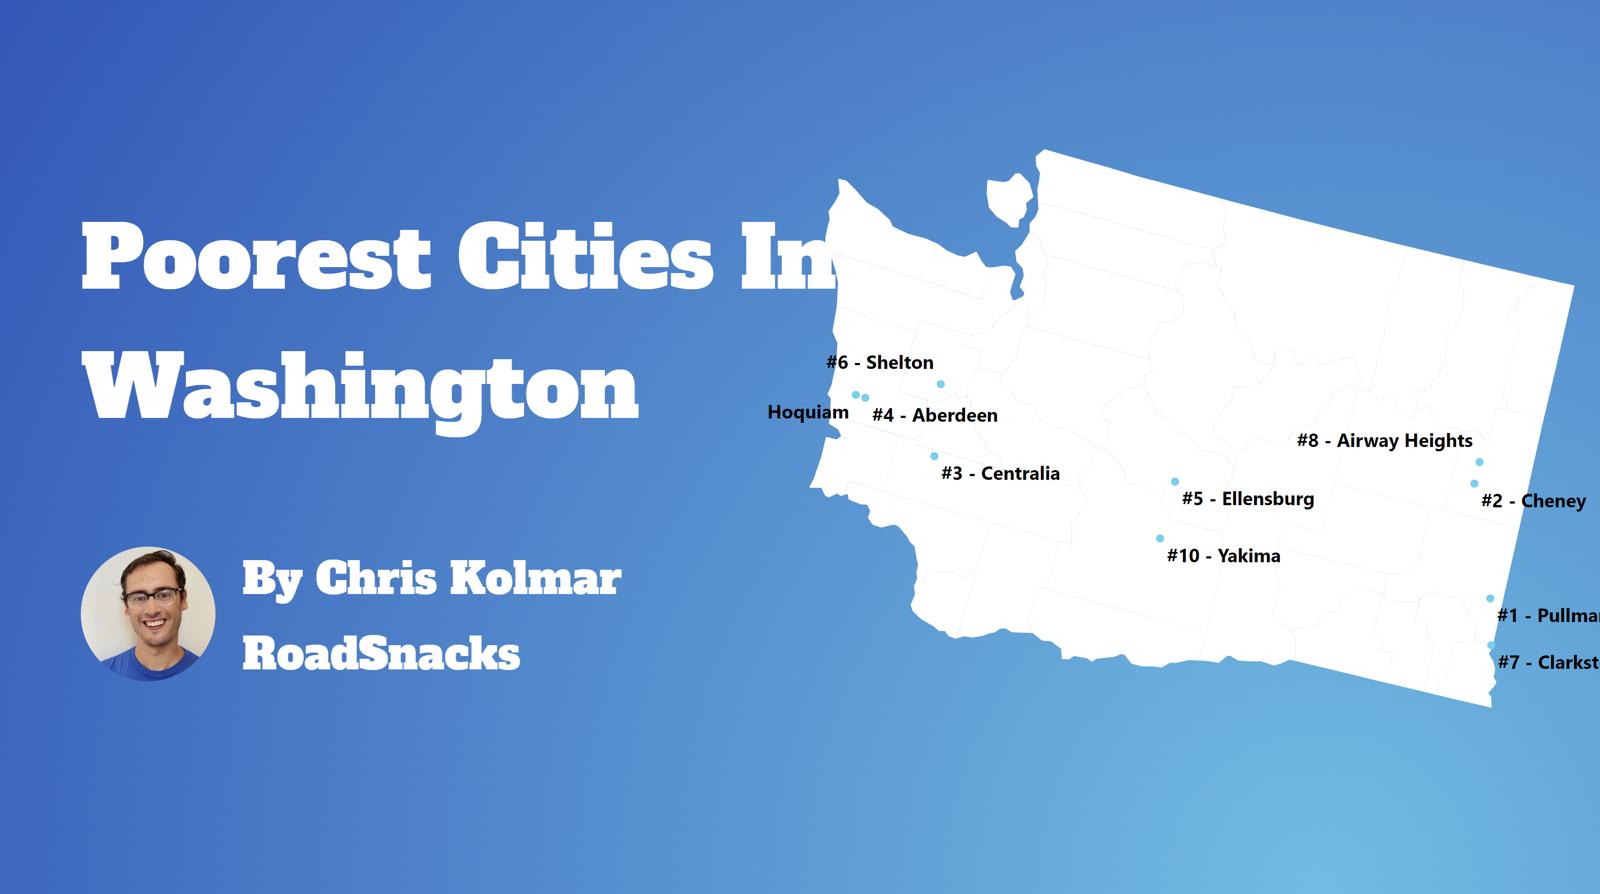
What’s the poorest city in Washington? According to the facts, Pullman is the poorest place in Washington for 2026.
This isn’t a commentary on the people that live there or the vibrant culture and traditions of these places. Instead, it’s just a look at the facts.
For more Washington reading, check out:
- Best Places To Live In Washington
- Cheapest Places To Live In Washington
- Most Dangerous Cities In Washington
- The poorest states in the US
- The poorest cities in the US
The 10 Poorest Cities In Washington For 2026
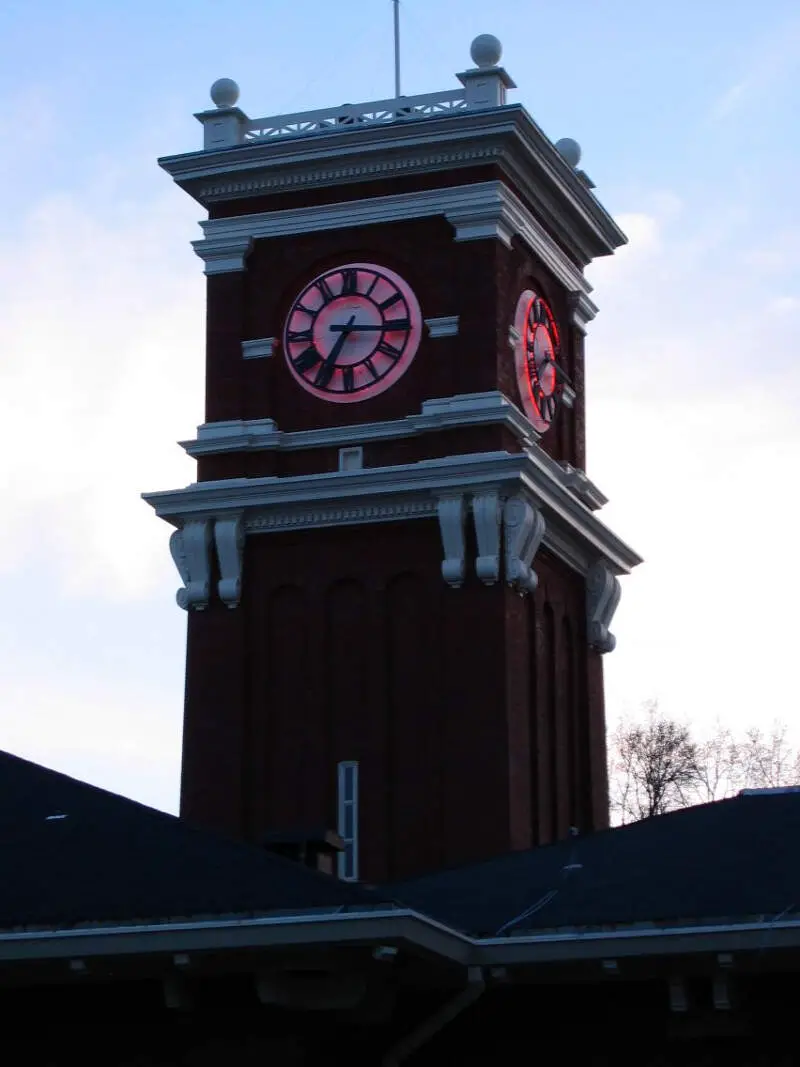
1. Pullman
/10
Population: 32,229
Rank Last Year: 1 (No Change)
Median Income: $46,812 (lowest)
Poverty Rate: 30.4% (2nd highest)
People In Poverty: 9,794
More on Pullman: Data | Crime | Cost Of Living | Movers
Pullman, unfortunately, ranks as the poorest place in Washington thanks to combination of low pay and and a lack of jobs.
The city of 32,229 people averages the lowest median household income in Washington and the 2nd highest poverty rate. At the very least, the cost of living ranks in the bottom 15% of place in the state, so things like housing are relatively affordable.
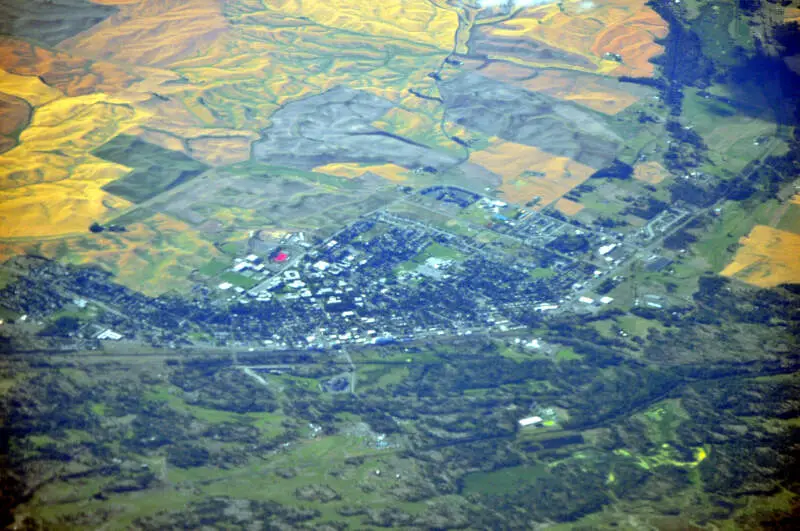
2. Cheney
/10
Population: 12,804
Rank Last Year: 2 (No Change)
Median Income: $54,503 (5th lowest)
Poverty Rate: 31.2% (highest)
People In Poverty: 4,001
More on Cheney: Data | Crime | Cost Of Living | Movers
The second poorest city in Washington is Cheney.
The city ranks as having the highest incidence of poverty and 5th lowest median household income. However, the unemployment rate ‘only’ ranks as the 2nd highest in the Evergreen State.
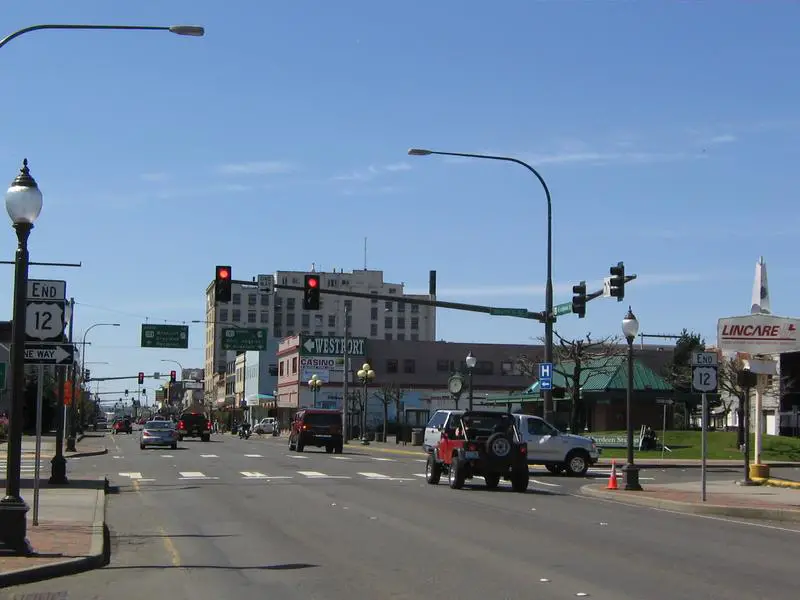
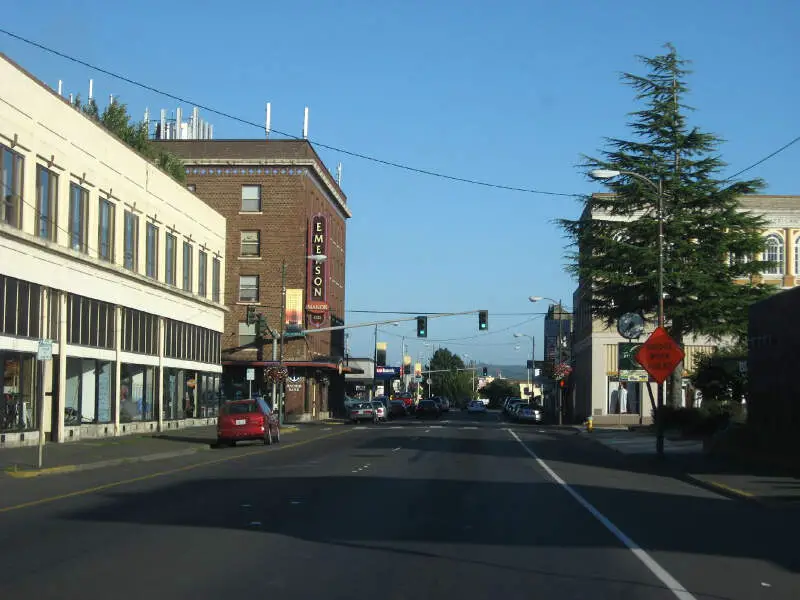
3. Aberdeen
/10
Population: 17,088
Rank Last Year: 4 (Up 1)
Median Income: $52,195 (3rd lowest)
Poverty Rate: 23.8% (5th highest)
People In Poverty: 4,061
More on Aberdeen: Data | Crime | Cost Of Living | Movers
Placing as the third poorest city, Aberdeen’s median income ranks as the 3rd lowest.
And that’s a sign that there’s a relatively substantial jump in the quality of the economy from second to third place on our list. The poverty rate is 23.77% and ranks near the bottom of places in the state.
But what makes up for the relatively low incomes of the city is its low cost of living. The income you do make here goes further than in most parts of the Evergreen State.
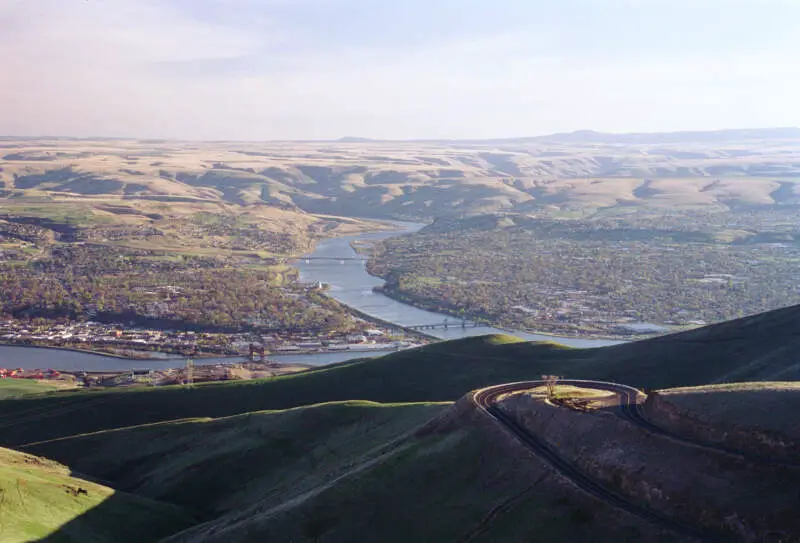
4. Clarkston
/10
Population: 7,191
Rank Last Year: 6 (Up 2)
Median Income: $54,152 (4th lowest)
Poverty Rate: 20.7% (8th highest)
People In Poverty: 1,491
More on Clarkston: Data | Cost Of Living | Movers
Clarkston ranks as the fourth poorest place in Washington.
The town ranks as having the 4th lowest median household income and the 8th highest incidence of poverty in the state.
That being said, there’s still a ton of cultural diversity in the city as it hosts many events throughout the year.
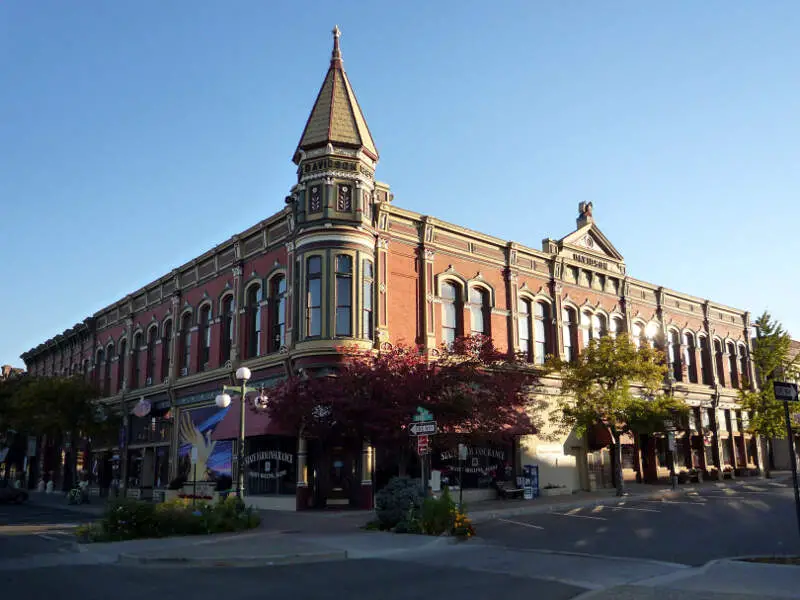
5. Ellensburg
/10
Population: 20,874
Rank Last Year: 3 (Down 2)
Median Income: $55,438 (6th lowest)
Poverty Rate: 22.4% (6th highest)
People In Poverty: 4,682
More on Ellensburg: Data | Crime | Cost Of Living | Movers
The fifth poorest city in Washington is Ellensburg.
The city ranks as having the 6th lowest median income in the state. However, an extremely low cost of living prevents a good number of folks from living in poverty as the poverty rate only ranks as the 6th highest in Washington.
Still not the best news for Ellensburg.
6. Centralia
/10
Population: 18,830
Rank Last Year: 5 (Down 1)
Median Income: $56,219 (7th lowest)
Poverty Rate: 19.6% (9th highest)
People In Poverty: 3,688
More on Centralia: Data | Crime | Cost Of Living | Movers
Centralia ranks as the sixth poorest place in the Evergreen State.
It ranks as having the 9th highest incidence of poverty and the 44th highest unemployment rate.
7. Hoquiam
/10
Population: 8,800
Rank Last Year: 9 (Up 2)
Median Income: $49,795 (2nd lowest)
Poverty Rate: 17.2% (16th highest)
People In Poverty: 1,512
More on Hoquiam: Data | Crime | Cost Of Living | Movers
Hoquiam places as the seventh poorest city in Washington.
The city of over 8,800 ranks as having the 16th highest incidence of poverty in the state. However, it has a very low cost of living which helps to pay the bills each month.
8. Sunnyside
/10
Population: 16,277
Rank Last Year: 10 (Up 2)
Median Income: $60,923 (11th lowest)
Poverty Rate: 18.5% (12th highest)
People In Poverty: 3,011
More on Sunnyside: Data | Crime | Cost Of Living | Movers
Sunnyside ranks as the eighth poorest city in Washington.
The big issue for the town is the unemployment rate which ranks as one of the highest in the state.
9. Othello
/10
Population: 8,795
Rank Last Year: 13 (Up 4)
Median Income: $65,849 (19th lowest)
Poverty Rate: 24.1% (4th highest)
People In Poverty: 2,120
More on Othello: Data | Crime | Cost Of Living | Movers
Othello couldn’t stay out of the top ten poorest places in Washington; it ranks number 9.
While the median income is the 19th lowest, there are a substantial number of people that live below the poverty line. Overall, Othello ranks as having the 4th most people living in poverty of all the places we analyzed in Washington.
10. Grandview
/10
Population: 11,187
Rank Last Year: 11 (Up 1)
Median Income: $61,106 (12th lowest)
Poverty Rate: 17.9% (14th highest)
People In Poverty: 1,999
More on Grandview: Data | Crime | Cost Of Living | Movers
And rounding out the top ten poorest cities in Washington is Grandview.
The city of 11,187 people ranks in the bottom 20% for both median income and poverty rate in the Evergreen State.
Methodology: How We Determined The Poorest Places In Washington for 2026
The first thing that comes to most people’s minds when they think about determining the poorest places is to simply the poverty rate. That is, the number of people living below a federally established level of income for a household of a certain size.
However, we don’t think that one statistic wholly encompasses what it means to be one of the “poorest places”. So we used Saturday Night Science to look at this set of criteria from the newly released 2020-2024 American Community Survey:
- Poverty Level
- Median Household Income
After we collected the data for all 122 places with more than 5,000 people in Washington, we ranked each place from 1 to 122 for each of the criteria, with 1 being the poorest.
We then averaged all the rankings for a place into a “Poor Score” with the place having the lowest overall Poor Score, Pullman, crowned the “Poorest Place In Washington For 2026”.
This report has been updated for 2026, which is our eleventh time ranking the poorest places in Washington.
Summary: The Poorest Cities In Washington For 2026
Like we said earlier, when we set out to identify the poorest places in Washington, we weren’t sure what we’d encounter, but it ended up being some of the best places to live in Washington.
When you look at the data, the cities and places mentioned above meet the criteria for being at the very bottom of the income ladder for everyone that lives there.
If you’re curious enough, here are the richest cities in Washington, according to data:
-
Richest: Snoqualmie
2nd Richest: Mercer Island
3rd Richest: Sammamish
For more Washington reading, check out:
- Richest Cities In Washington
- Safest Places In Washington
- Worst Places To Live In Washington
- Most Expensive Places To Live In Washington
Detailed List Of The Poorest Places To Live In Washington
| Rank | City | Population | Poverty Rate | Median Income | People In Poverty |
|---|---|---|---|---|---|
| 1 | Pullman | 32,229 | 30.4% | $46,812 | 9,794 |
| 2 | Cheney | 12,804 | 31.2% | $54,503 | 4,001 |
| 3 | Aberdeen | 17,088 | 23.8% | $52,195 | 4,061 |
| 4 | Clarkston | 7,191 | 20.7% | $54,152 | 1,491 |
| 5 | Ellensburg | 20,874 | 22.4% | $55,438 | 4,682 |
| 6 | Centralia | 18,830 | 19.6% | $56,219 | 3,688 |
| 7 | Hoquiam | 8,800 | 17.2% | $49,795 | 1,512 |
| 8 | Sunnyside | 16,277 | 18.5% | $60,923 | 3,011 |
| 9 | Othello | 8,795 | 24.1% | $65,849 | 2,120 |
| 10 | Grandview | 11,187 | 17.9% | $61,106 | 1,999 |
| 11 | Airway Heights | 11,245 | 19.5% | $62,874 | 2,188 |
| 12 | Ephrata | 8,560 | 20.8% | $69,551 | 1,777 |
| 13 | Longview | 38,069 | 16.1% | $61,747 | 6,110 |
| 14 | Bellingham | 93,438 | 18.6% | $66,755 | 17,379 |
| 15 | Yakima | 96,961 | 16.6% | $62,815 | 16,134 |
| 16 | Toppenish | 8,723 | 18.0% | $67,854 | 1,572 |
| 17 | Union Gap | 6,584 | 13.8% | $59,651 | 908 |
| 18 | Omak | 5,036 | 26.1% | $76,544 | 1,315 |
| 19 | Shelton | 10,612 | 17.4% | $69,598 | 1,849 |
| 20 | Walla Walla | 33,925 | 14.3% | $66,748 | 4,844 |
| 21 | Port Townsend | 10,438 | 13.5% | $62,606 | 1,404 |
| 22 | Sequim | 8,161 | 12.9% | $59,707 | 1,051 |
| 23 | Chehalis | 7,587 | 15.0% | $73,702 | 1,139 |
| 24 | Kennewick | 85,295 | 14.3% | $73,576 | 12,205 |
| 25 | Moses Lake | 26,083 | 15.8% | $74,752 | 4,113 |
| 26 | Mount Vernon | 35,377 | 16.1% | $75,777 | 5,681 |
| 27 | Prosser | 6,305 | 16.8% | $76,985 | 1,056 |
| 28 | Ocean Shores | 7,302 | 12.3% | $58,202 | 898 |
| 29 | Spokane | 230,293 | 13.8% | $70,064 | 31,711 |
| 30 | Selah | 8,437 | 13.9% | $74,783 | 1,171 |
| 31 | Bremerton | 44,830 | 13.8% | $74,940 | 6,177 |
| 32 | Sedro-Woolley | 12,831 | 15.8% | $80,885 | 2,020 |
| 33 | Lakewood | 62,937 | 13.2% | $74,720 | 8,288 |
| 34 | Burlington | 10,003 | 14.5% | $80,475 | 1,451 |
| 35 | Lynnwood | 40,110 | 14.2% | $77,704 | 5,675 |
| 36 | College Place | 9,854 | 11.3% | $61,914 | 1,116 |
| 37 | Port Angeles | 20,118 | 11.5% | $62,606 | 2,313 |
| 38 | Spokane Valley | 106,365 | 12.9% | $74,042 | 13,763 |
| 39 | Kelso | 12,684 | 12.0% | $66,751 | 1,527 |
| 40 | Olympia | 55,951 | 14.0% | $81,302 | 7,838 |
| 41 | Tukwila | 21,451 | 13.1% | $78,381 | 2,799 |
| 42 | Blaine | 6,100 | 13.1% | $84,030 | 800 |
| 43 | Wenatchee | 35,484 | 10.4% | $73,040 | 3,700 |
| 44 | Everett | 111,845 | 12.9% | $83,512 | 14,450 |
| 45 | Woodland | 6,487 | 12.8% | $81,193 | 833 |
| 46 | Federal Way | 99,493 | 13.0% | $86,909 | 12,973 |
| 47 | Pasco | 79,575 | 12.6% | $85,586 | 10,018 |
| 48 | Ferndale | 15,999 | 12.8% | $87,579 | 2,039 |
| 49 | Tacoma | 222,758 | 12.4% | $85,884 | 27,666 |
| 50 | Arlington | 21,095 | 12.7% | $88,231 | 2,674 |
| 51 | Burien | 51,513 | 12.9% | $91,318 | 6,634 |
| 52 | Oak Harbor | 24,362 | 8.3% | $76,084 | 2,014 |
| 53 | Vancouver | 195,300 | 10.2% | $81,338 | 19,940 |
| 54 | SeaTac | 32,414 | 9.3% | $81,104 | 3,020 |
| 55 | Lacey | 57,737 | 11.6% | $90,625 | 6,680 |
| 56 | East Wenatchee | 14,199 | 8.0% | $77,558 | 1,138 |
| 57 | Fife | 10,949 | 11.2% | $90,532 | 1,227 |
| 58 | Des Moines | 32,823 | 12.1% | $92,483 | 3,978 |
| 59 | Pacific | 7,066 | 13.8% | $115,625 | 972 |
| 60 | Connell | 5,054 | 7.9% | $77,721 | 400 |
| 61 | Port Orchard | 17,149 | 9.7% | $89,795 | 1,661 |
| 62 | Kent | 135,603 | 10.8% | $92,302 | 14,658 |
| 63 | Milton | 8,894 | 10.2% | $96,540 | 907 |
| 64 | Steilacoom | 6,686 | 11.1% | $100,851 | 739 |
| 65 | Stanwood | 8,373 | 8.0% | $90,242 | 671 |
| 66 | Washougal | 17,490 | 11.2% | $106,368 | 1,964 |
| 67 | Richland | 62,753 | 9.0% | $95,813 | 5,647 |
| 68 | Auburn | 85,676 | 8.9% | $97,884 | 7,650 |
| 69 | Snohomish | 10,239 | 6.7% | $87,250 | 683 |
| 70 | Anacortes | 17,966 | 7.3% | $91,951 | 1,307 |
| 71 | University Place | 34,911 | 8.2% | $99,031 | 2,855 |
| 72 | Quincy | 7,998 | 6.2% | $87,902 | 495 |
| 73 | Renton | 105,317 | 8.1% | $100,432 | 8,562 |
| 74 | Tumwater | 26,956 | 7.0% | $95,212 | 1,897 |
| 75 | Marysville | 73,002 | 8.1% | $103,974 | 5,905 |
| 76 | Shoreline | 61,431 | 8.8% | $112,751 | 5,430 |
| 77 | Poulsbo | 12,165 | 9.3% | $116,250 | 1,130 |
| 78 | Yelm | 11,102 | 6.0% | $90,750 | 671 |
| 79 | Puyallup | 42,746 | 7.0% | $97,826 | 2,996 |
| 80 | Seattle | 754,195 | 9.9% | $123,860 | 74,514 |
| 81 | Lynden | 16,234 | 7.2% | $103,233 | 1,176 |
| 82 | West Richland | 17,586 | 8.5% | $119,892 | 1,489 |
| 83 | Monroe | 19,755 | 7.3% | $110,461 | 1,446 |
| 84 | Buckley | 5,371 | 9.3% | $124,583 | 501 |
| 85 | Sultan | 6,116 | 5.8% | $94,730 | 352 |
| 86 | Duvall | 8,526 | 12.8% | $197,361 | 1,089 |
| 87 | Mountlake Terrace | 23,104 | 7.0% | $107,687 | 1,612 |
| 88 | Enumclaw | 12,798 | 7.5% | $121,250 | 961 |
| 89 | Battle Ground | 21,886 | 5.9% | $104,977 | 1,282 |
| 90 | Gig Harbor | 12,424 | 7.0% | $118,395 | 868 |
| 91 | Sumner | 10,733 | 4.9% | $98,191 | 525 |
| 92 | Fircrest | 7,069 | 5.7% | $113,926 | 402 |
| 93 | Mill Creek | 20,956 | 6.4% | $124,364 | 1,345 |
| 94 | Brier | 6,545 | 6.7% | $132,045 | 437 |
| 95 | Ridgefield | 13,408 | 5.7% | $116,389 | 757 |
| 96 | Lake Stevens | 40,253 | 5.2% | $122,336 | 2,101 |
| 97 | Liberty Lake | 12,737 | 5.0% | $118,723 | 635 |
| 98 | Edgewood | 13,032 | 4.6% | $116,132 | 596 |
| 99 | Bellevue | 151,847 | 7.2% | $165,576 | 10,993 |
| 100 | Mukilteo | 21,323 | 5.7% | $132,861 | 1,206 |