
Cities with highest divorce rate in Tennessee research summary. We used Saturday Night Science to analyze Tennessee’s most recent Census data to determine the divorce rate for each city in Tennessee based on the percentage of currently divorced residents. Here are the results of our analysis:
-
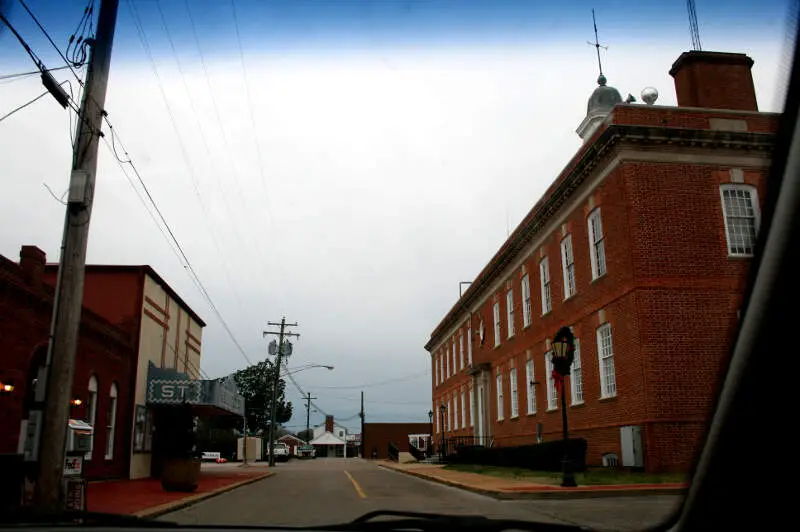
The city with the highest divorce rate in Tennessee is Fayetteville based on the most recent Census data.
-
Fayetteville is 15.0% Divorced.
-
The city with the lowest divorce rate in Tennessee is Thompson’s Station.
-
Thompson’s Station is 2.0% Divorced.
-
Tennessee is 6.0% Divorced.
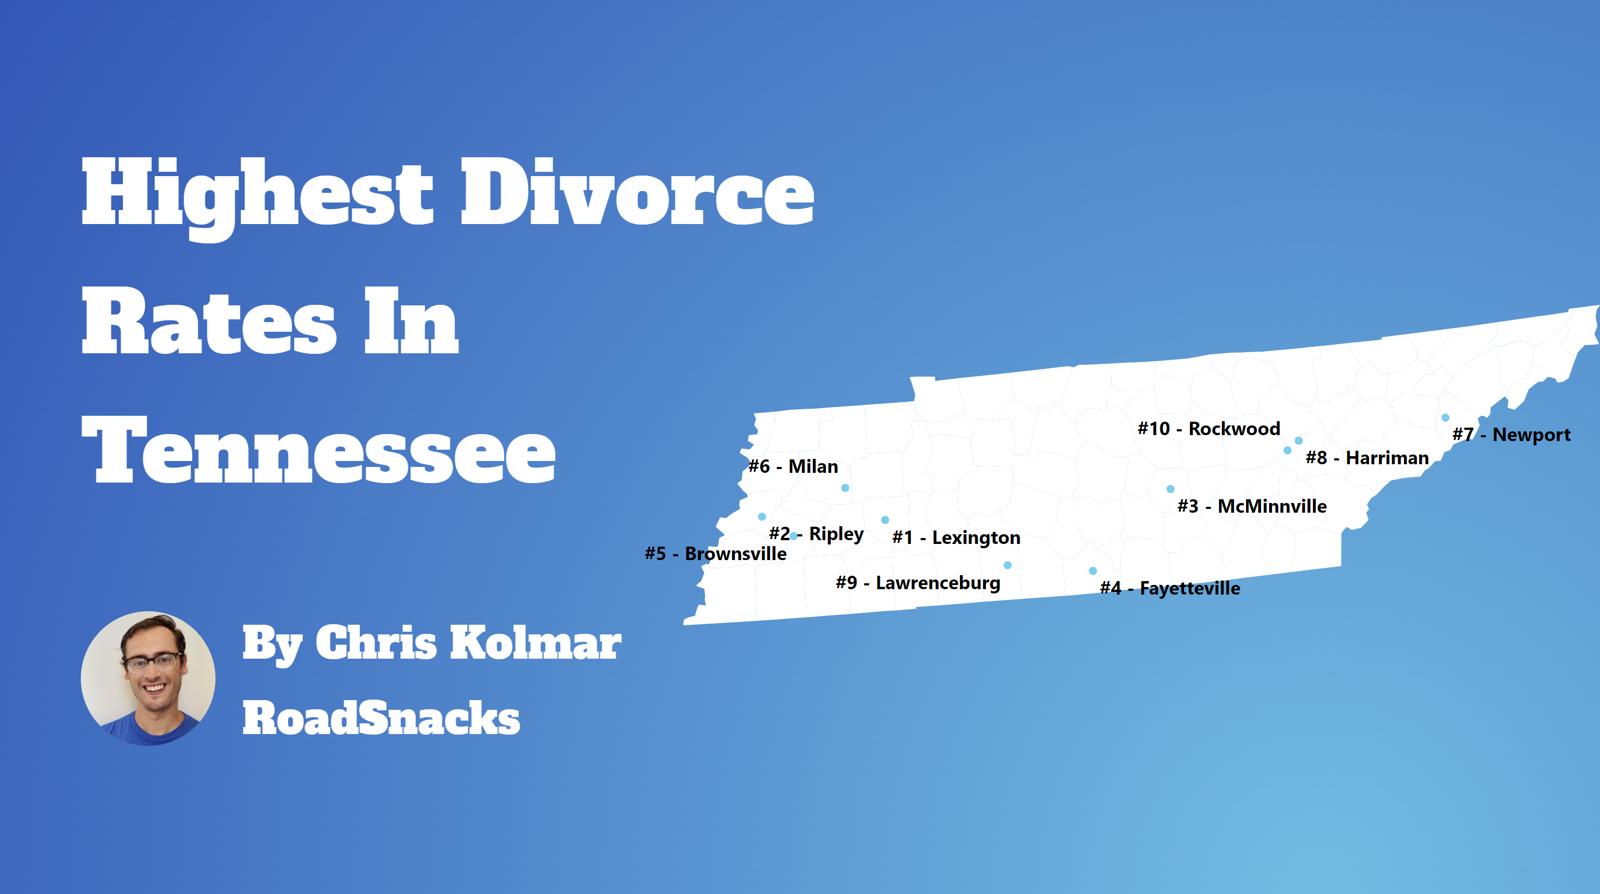
Table Of Contents: Top Ten | Methodology | Summary | Table
There are some 339,186 people living in Tennessee over fifteen years of age who are divorced. You can compare that to the 28,339,199 Americans who are currently divorced in 2026.
Many people decide to run away – or split up – across the Volunteer State.
Isn’t the divorce rate in America close to 50%? Yes indeed. But we’re measuring something else; we are looking at counts and percentages of people over 15 years old who are currently divorced. That 50% statistic is for the percentage of people who have ever been divorced.
For today’s analysis, the focus will be on the number of currently divorced people.
So now that we have you biting your nails, rethinking your worldview, and pulling out your hair, let’s look at the places in Tennessee with the highest rates of divorcees.
The 10 Cities In Tennessee With The Highest Divorce Rates
Let’s quickly recap before we dive into the Saturday Night Science behind the data.
What is the city in Tennessee with the highest divorce rate? That would be Fayetteville, with 15.0% of people over 15 years of age being divorced, per the most recent census data.
What is the overall Tennessee divorce rate? According to the 2020-2024 Community Survey, the overall divorce rate in Tennessee is 6.0%, which compares to the US divorce rate of 10.9%.
Alrighty, on to how we calculated the places with the highest divorce rates in Tennessee.
For more Tennessee reading, check out:
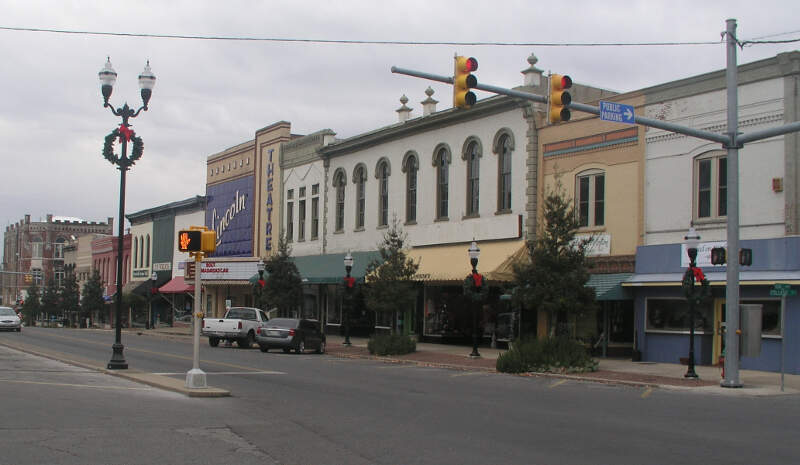
The 10 Places With The Highest Divorce Rate In Tennessee For 2026

/10
Population: 7,057
Divorce Rate: 15.0%
Divorcees: 846
Median Income: $49,223
More on Fayetteville: Data | Crime | Cost Of Living | Movers

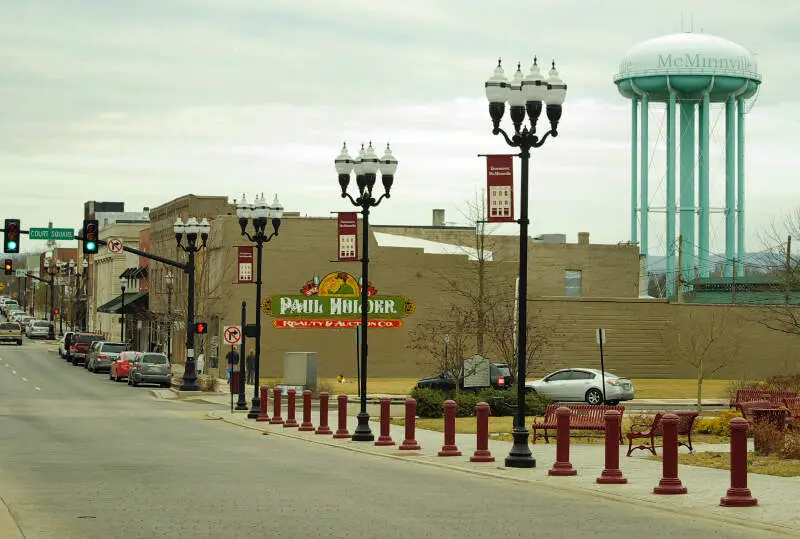
/10
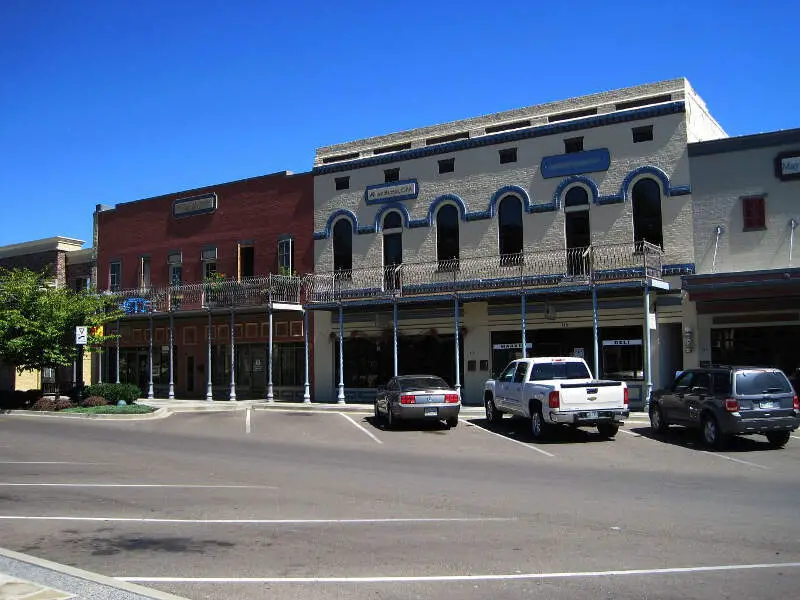
Population: 13,844
Divorce Rate: 15.0%
Divorcees: 1,661
Median Income: $47,179
More on Mcminnville: Data | Crime | Cost Of Living | Movers

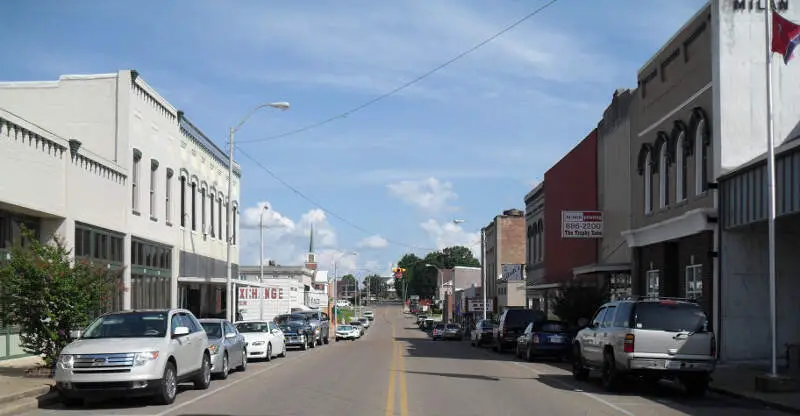
/10
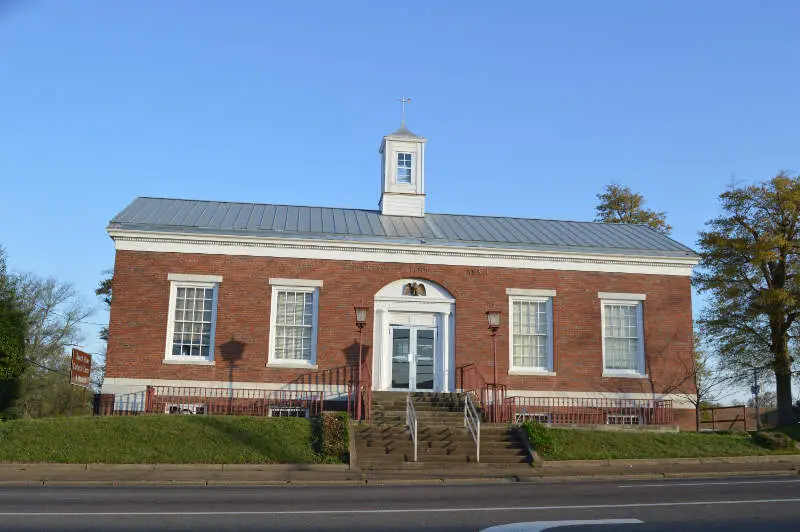
Population: 8,244
Divorce Rate: 14.0%
Divorcees: 923
Median Income: $43,886
More on Milan: Data | Crime | Cost Of Living | Movers

/10
Population: 7,412
Divorce Rate: 14.0%
Divorcees: 830
Median Income: $39,712
More on Savannah: Data | Crime | Cost Of Living | Movers

/10
Population: 7,658
Divorce Rate: 14.0%
Divorcees: 857
Median Income: $37,432
More on Ripley: Data | Crime | Cost Of Living | Movers
/10
Population: 5,727
Divorce Rate: 14.0%
Divorcees: 641
Median Income: $51,736
More on Lafayette: Data | Crime | Cost Of Living | Movers

/10
Population: 7,962
Divorce Rate: 13.0%
Divorcees: 828
Median Income: $49,057
More on Lexington: Data | Crime | Cost Of Living | Movers

/10
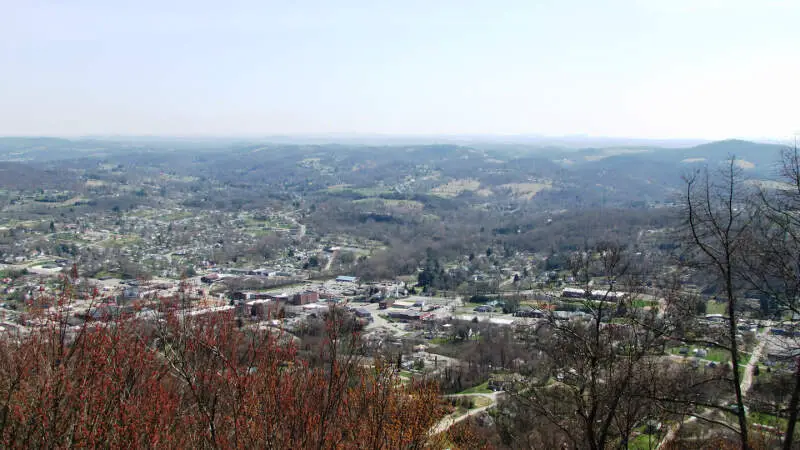
Population: 7,273
Divorce Rate: 13.0%
Divorcees: 756
Median Income: $37,581
More on La Follette: Data | Crime | Cost Of Living | Movers

/10
Population: 9,622
Divorce Rate: 13.0%
Divorcees: 1,000
Median Income: $43,494
More on Brownsville: Data | Crime | Cost Of Living | Movers

/10
Population: 15,979
Divorce Rate: 12.0%
Divorcees: 1,533
Median Income: $52,064
More on Dyersburg: Data | Crime | Cost Of Living | Movers
How We Determined The Places In Tennessee That Get Un-Hitched The Most
Since this is the 58th category of rankings we are compiling for the site, we had a pretty good idea of where to find data on marriage and divorce in America. We used Saturday Night Science to look at the U.S. Census Bureau on divorce rates. Because who likes tracking misery more than the U.S. government?
Specifically, we looked at the 2020-2024 American Community Survey table S1201 — Marital Status.
Pretty straightforward on that front — we just had to extract the following column of data:
- Population 15 Years and Over -> Divorced
There are some interesting/fun/sad data like .1% of female Americans aged 15-19 are divorced, but 0% of males (That’s probably a rounding issue, but still).
But the national data is for another day. Today, the analysis focuses on the 101 places in Tennessee with a population of over 5,000.
We ranked each place by the percentage of divorcees over 15 years of age from highest to lowest. We crowned the divorce capital of Tennessee the place with the highest incidence of divorcees, Fayetteville.
And if you’re trying to avoid divorce, check out Thompson’s Station, the city with the lowest divorce rate in Tennessee.
We updated this article for 2026 and this list is our fifth time ranking the cities in Tennessee with the highest divorce rates.
Getting Some Closure In Tennessee After Untying The Know
Besides just coming up with what we thought would be a great new blog/book title, “Untying the Knot In Tennessee: Life After Divorce,” we now have a sense of what places in the Volunteer State don’t pay much attention to the whole “’til death do we part” phrase.
The cities with the highest divorce rate in Tennessee are Fayetteville, McMinnville, Milan, Savannah, Ripley, Lafayette, Lexington, La Follette, Brownsville, and Dyersburg.
Try to keep in mind that the reason cities rank where they do in Tennessee could be because of the age, education, and income distribution, as all of those things impact the rate of divorce.
And that’s probably for the best. Getting out of a toxic relationship is much better than staying in it.
Just make sure you have your running shoes ready to go.
For more Tennessee reading, check out:
Cities With The Highest Divorce Rates In Tennessee
| Rank | City | Population | Divorcees | Divorce Rate |
|---|---|---|---|---|
| 1 | Fayetteville, TN | 7,057 | 846 | 15.0% |
| 2 | Mcminnville, TN | 13,844 | 1,661 | 15.0% |
| 3 | Milan, TN | 8,244 | 923 | 14.0% |
| 4 | Savannah, TN | 7,412 | 830 | 14.0% |
| 5 | Ripley, TN | 7,658 | 857 | 14.0% |
| 6 | Lafayette, TN | 5,727 | 641 | 14.0% |
| 7 | Lexington, TN | 7,962 | 828 | 13.0% |
| 8 | La Follette, TN | 7,273 | 756 | 13.0% |
| 9 | Brownsville, TN | 9,622 | 1,000 | 13.0% |
| 10 | Dyersburg, TN | 15,979 | 1,533 | 12.0% |
| 11 | Humboldt, TN | 7,787 | 747 | 12.0% |
| 12 | Newport, TN | 6,881 | 660 | 12.0% |
| 13 | Athens, TN | 14,471 | 1,273 | 11.0% |
| 14 | Soddy-Daisy, TN | 13,231 | 1,164 | 11.0% |
| 15 | Manchester, TN | 12,944 | 1,139 | 11.0% |
| 16 | Sweetwater, TN | 6,532 | 574 | 11.0% |
| 17 | Madisonville, TN | 5,241 | 461 | 11.0% |
| 18 | Rockwood, TN | 5,566 | 489 | 11.0% |
| 19 | Lawrenceburg, TN | 11,844 | 1,042 | 11.0% |
| 20 | Hartsville/trousdale County, TN | 11,957 | 1,052 | 11.0% |
| 21 | Paris, TN | 10,338 | 909 | 11.0% |
| 22 | Greeneville, TN | 15,646 | 1,251 | 10.0% |
| 23 | Winchester, TN | 9,799 | 783 | 10.0% |
| 24 | Henderson, TN | 6,411 | 512 | 10.0% |
| 25 | Dickson, TN | 16,424 | 1,313 | 10.0% |
| 26 | Harriman, TN | 6,090 | 487 | 10.0% |
| 27 | Church Hill, TN | 7,139 | 571 | 10.0% |
| 28 | Clinton, TN | 10,239 | 819 | 10.0% |
| 29 | Bolivar, TN | 5,144 | 411 | 10.0% |
| 30 | Medina, TN | 5,407 | 432 | 10.0% |
| 31 | Shelbyville, TN | 24,661 | 1,775 | 9.0% |
| 32 | Mckenzie, TN | 5,631 | 405 | 9.0% |
| 33 | Jackson, TN | 68,435 | 4,927 | 9.0% |
| 34 | Millersville, TN | 5,836 | 420 | 9.0% |
| 35 | Pulaski, TN | 8,285 | 596 | 9.0% |
| 36 | Smithville, TN | 5,288 | 380 | 9.0% |
| 37 | Kingsport, TN | 56,262 | 4,050 | 9.0% |
| 38 | Elizabethton, TN | 14,374 | 1,034 | 9.0% |
| 39 | Lewisburg, TN | 12,861 | 925 | 9.0% |
| 40 | Jefferson City, TN | 8,579 | 549 | 8.0% |
| 41 | Union City, TN | 10,982 | 702 | 8.0% |
| 42 | Millington, TN | 11,289 | 722 | 8.0% |
| 43 | Kingston, TN | 6,224 | 398 | 8.0% |
| 44 | Morristown, TN | 31,527 | 2,017 | 8.0% |
| 45 | Erwin, TN | 5,988 | 383 | 8.0% |
| 46 | Goodlettsville, TN | 17,597 | 1,126 | 8.0% |
| 47 | Greenbrier, TN | 6,971 | 390 | 7.0% |
| 48 | Red Bank, TN | 12,010 | 672 | 7.0% |
| 49 | Ashland City, TN | 5,424 | 303 | 7.0% |
| 50 | Oakland, TN | 9,979 | 558 | 7.0% |
| 51 | Lenoir City, TN | 11,110 | 622 | 7.0% |
| 52 | Columbia, TN | 45,441 | 2,544 | 7.0% |
| 53 | Chattanooga, TN | 185,783 | 10,403 | 7.0% |
| 54 | Dayton, TN | 7,625 | 427 | 7.0% |
| 55 | Knoxville, TN | 195,185 | 10,930 | 7.0% |
| 56 | Tullahoma, TN | 21,103 | 1,181 | 7.0% |
| 57 | Munford, TN | 6,588 | 368 | 7.0% |
| 58 | Springfield, TN | 19,255 | 1,078 | 7.0% |
| 59 | East Ridge, TN | 22,070 | 1,059 | 6.0% |
| 60 | Bristol, TN | 27,636 | 1,326 | 6.0% |
| 61 | Pigeon Forge, TN | 6,375 | 306 | 6.0% |
| 62 | Oak Ridge, TN | 32,693 | 1,569 | 6.0% |
| 63 | Crossville, TN | 12,428 | 596 | 6.0% |
| 64 | Fairview, TN | 10,009 | 480 | 6.0% |
| 65 | Mount Carmel, TN | 5,472 | 262 | 6.0% |
| 66 | Memphis, TN | 618,980 | 29,711 | 6.0% |
| 67 | Johnson City, TN | 72,222 | 3,466 | 6.0% |
| 68 | Portland, TN | 13,449 | 645 | 6.0% |
| 69 | Cleveland, TN | 48,829 | 2,343 | 6.0% |
| 70 | Lebanon, TN | 44,788 | 2,149 | 6.0% |
| 71 | Covington, TN | 8,587 | 412 | 6.0% |
| 72 | Maryville, TN | 32,392 | 1,554 | 6.0% |
| 73 | White House, TN | 14,631 | 702 | 6.0% |
| 74 | Lakeland, TN | 14,192 | 681 | 6.0% |
| 75 | Atoka, TN | 10,385 | 498 | 6.0% |
| 76 | Hendersonville, TN | 63,091 | 2,523 | 5.0% |
| 77 | Pleasant View, TN | 5,276 | 211 | 5.0% |
| 78 | Dunlap, TN | 5,678 | 227 | 5.0% |
| 79 | Cookeville, TN | 36,088 | 1,443 | 5.0% |
| 80 | Jonesborough, TN | 6,232 | 249 | 5.0% |
| 81 | Martin, TN | 10,915 | 436 | 5.0% |
| 82 | Bartlett, TN | 56,876 | 2,275 | 5.0% |
| 83 | Arlington, TN | 15,205 | 486 | 4.0% |
| 84 | Sevierville, TN | 18,397 | 588 | 4.0% |
| 85 | Signal Mountain, TN | 8,860 | 283 | 4.0% |
| 86 | Smyrna, TN | 56,692 | 1,814 | 4.0% |
| 87 | Mount Juliet, TN | 42,073 | 1,346 | 4.0% |
| 88 | Murfreesboro, TN | 161,445 | 5,166 | 4.0% |
| 89 | Collierville, TN | 51,515 | 1,648 | 4.0% |
| 90 | La Vergne, TN | 40,243 | 1,287 | 4.0% |
| 91 | Alcoa, TN | 12,222 | 391 | 4.0% |
| 92 | Gallatin, TN | 48,532 | 1,553 | 4.0% |
| 93 | Collegedale, TN | 11,330 | 271 | 3.0% |
| 94 | Farragut, TN | 24,634 | 591 | 3.0% |
| 95 | Clarksville, TN | 176,456 | 4,234 | 3.0% |
| 96 | Franklin, TN | 87,133 | 2,091 | 3.0% |
| 97 | Brentwood, TN | 45,556 | 728 | 2.0% |
| 98 | Spring Hill, TN | 55,765 | 892 | 2.0% |
| 99 | Nolensville, TN | 15,074 | 241 | 2.0% |
| 100 | Germantown, TN | 40,673 | 650 | 2.0% |