
Do you live in one of the most miserable places in Connecticut?
Only a third of Connecticuters say they are truly happy. That’s too bad, considering that folks in Connecticut don’t really have it too bad in the grand scheme of things.
But, we were curious – which Connecticut cities might be the most miserable? We’re about to find out, using Saturday Night Science and data.
After analyzing the 57 largest cities, we sadly present the most miserable cities in the Constitution State.
Table Of Contents: Top Ten | Methodology | Summary | Table
The 10 Most Miserable Places In Connecticut
Read on below to see how we crunched the numbers and how your town ranked. If you have a smile on your face, you probably don’t live in one of these cities.
Oh, and by the way, Storrs is the happiest place in Connecticut.
For more Connecticut reading, check out:
The 10 Most Miserable Places In Connecticut For 2023
/10
Population: 148,529
Poverty Level: 23.2%
Median Home Price $194,100
Married Households 6.0%
Households With Kids 34.96%
More on Bridgeport: Data | Crime | Cost Of Living
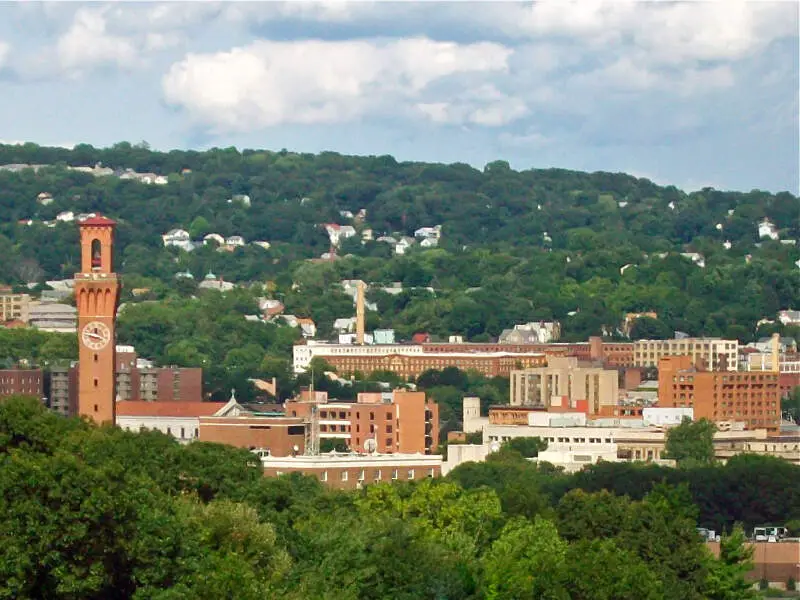
/10
Population: 113,783
Poverty Level: 21.7%
Median Home Price $140,700
Married Households 14.0%
Households With Kids 31.04%
More on Waterbury: Data | Crime | Cost Of Living
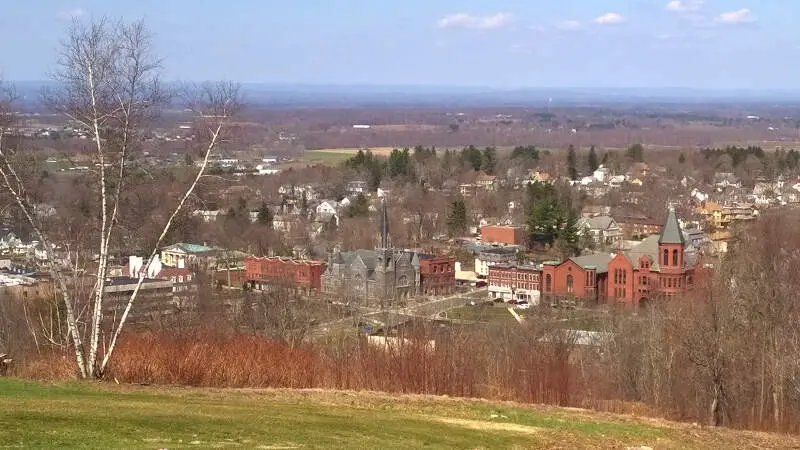
/10
Population: 7,612
Poverty Level: 21.1%
Median Home Price $164,900
Married Households 16.0%
Households With Kids 38.44%
More on Rockville: Data | Cost Of Living

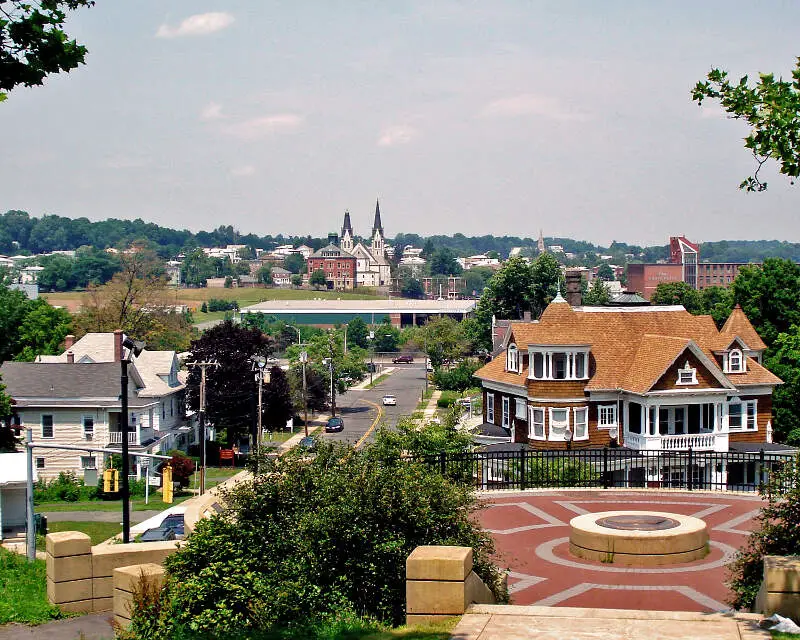
/10
Population: 121,562
Poverty Level: 28.4%
Median Home Price $172,100
Married Households 6.0%
Households With Kids 32.42%
More on Hartford: Data | Crime | Cost Of Living
/10
Population: 74,022
Poverty Level: 20.5%
Median Home Price $166,100
Married Households 10.0%
Households With Kids 31.03%
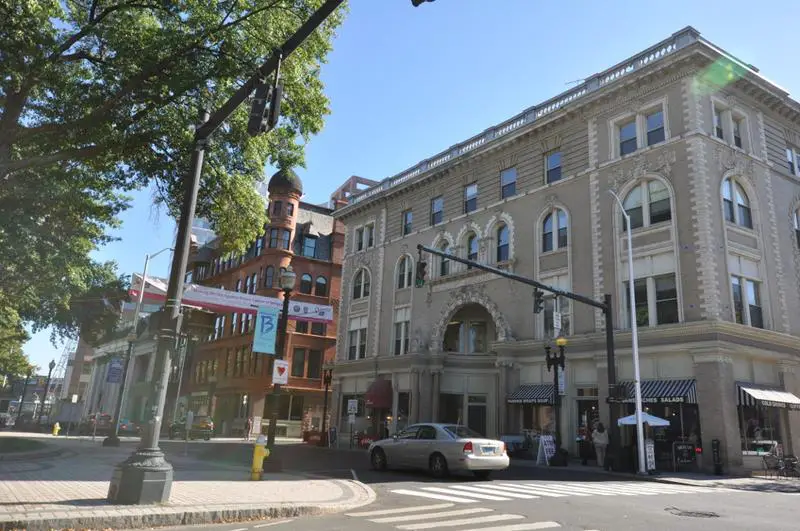
More on New Britain: Data | Crime | Cost Of Living
/10
Population: 31,586
Poverty Level: 4.9%
Median Home Price $197,800
Married Households 27.0%
Households With Kids 29.86%
More on Naugatuck: Data | Crime | Cost Of Living
/10
Population: 7,105
Poverty Level: 8.3%
Median Home Price $187,800
Married Households 16.0%
Households With Kids 30.51%
More on Putnam: Data | Crime | Cost Of Living
/10
Population: 50,971
Poverty Level: 13.1%
Median Home Price $172,000
Married Households 14.0%
Households With Kids 32.46%
More on East Hartford: Data | Crime | Cost Of Living
/10
Population: 9,133
Poverty Level: 3.1%
Median Home Price $1,570,200
Married Households 6.0%
Households With Kids 47.17%
More on Riverside: Data | Cost Of Living
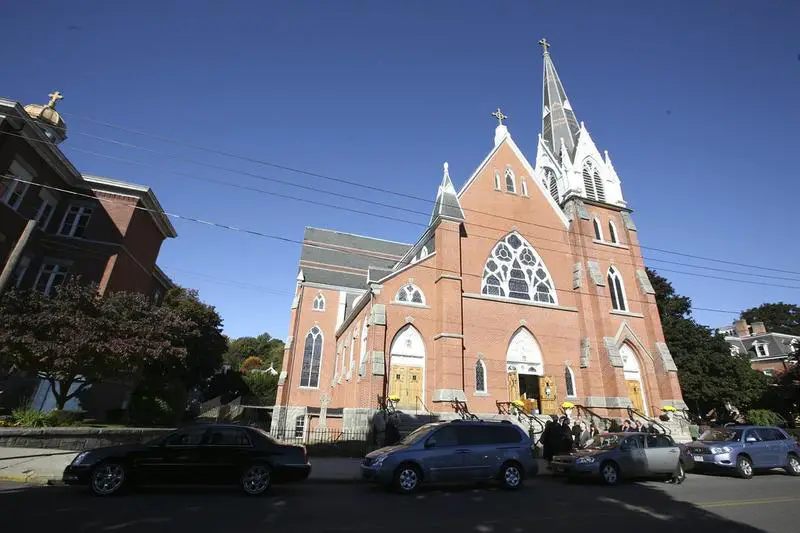
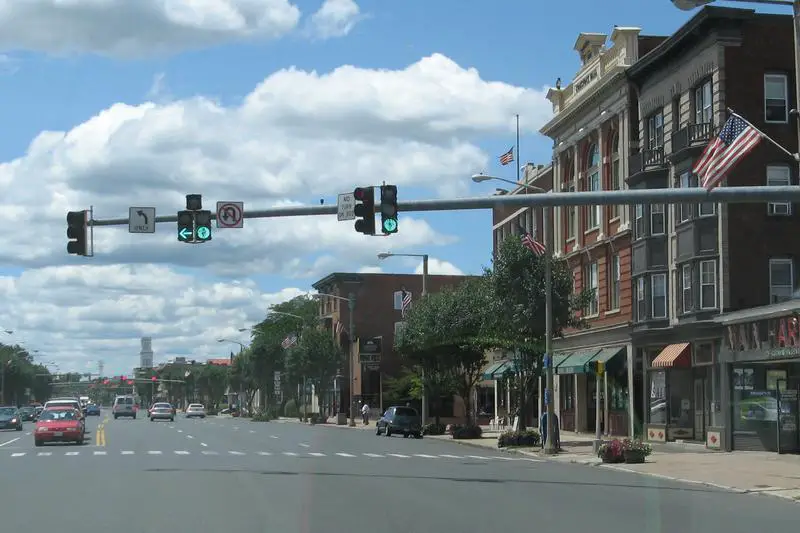
/10
Population: 18,150
Poverty Level: 30.7%
Median Home Price $152,700
Married Households 8.0%
Households With Kids 29.27%
More on Willimantic: Data | Crime | Cost Of Living
Methodology: How We Measured The Most Miserable Cities In The Constitution State
To rank the unhappiest places in Connecticut, we had to determine what criteria make people happy. It isn’t a stretch to assume that happy people earn great salaries, are relatively stress-free, and have a stable home life.
So we went to the Census’s American Community Survey 2017-2021 report for the happy criteria, flipped the list with Saturday Night Science, and it spit out the answer.
Like magic.
Here are the criteria we used to measure misery:
- Percentage of residents with a college degree
- Average commute times
- Unemployment rates
- Cost of living
- % of married couples
- % of families with kids
- Poverty rate
After we decided on the criteria, we gathered the data for the 57 places in Connecticut with over 5,000 people.
We then ranked each place from one to 57 for each of the seven criteria, with a score of one being the most miserable (Any ties were given to the larger place).
Next, we averaged the seven rankings into a Miserable Index for each place with the lowest overall Miserable Index “earning” the title “Most Miserable City In Connecticut.”
If you’d like to see the complete list of states, most miserable to happiest, scroll to the bottom of this post to see the unabridged chart.
We updated this article for 2023, and it’s our tenth time ranking the most miserable cities in Connecticut.
There You Have It – The Least Happy Cities In Connecticut
As we said earlier, trying to determine the most miserable cities in Connecticut is usually a subjective matter.
But if you’re analyzing cities where people are not stable, where you’re stuck in traffic, and no one spent the time to go to college, then this is an accurate list.
If you’re curious enough, here are the happiest cities in Connecticut, according to science:
- Storrs
- Cheshire Village
- Glastonbury Center
For more Connecticut reading, check out:
- Best Places To Live In Connecticut
- Cheapest Places To Live In Connecticut
- Most Dangerous Cities In Connecticut
- Richest Cities In Connecticut
- Safest Places In Connecticut
- Worst Places To Live In Connecticut
- Most Expensive Places To Live In Connecticut
Miserable Cities In Connecticut For 2023
| Rank | City | Population | Poverty Level | Median Home Value | % Married | % Kids |
|---|---|---|---|---|---|---|
| 1 | Bridgeport, CT | 148,529 | 23.2% | $194,100 | 6.0% | 34.96% |
| 2 | Waterbury, CT | 113,783 | 21.7% | $140,700 | 14.0% | 31.04% |
| 3 | Rockville, CT | 7,612 | 21.1% | $164,900 | 16.0% | 38.44% |
| 4 | Hartford, CT | 121,562 | 28.4% | $172,100 | 6.0% | 32.42% |
| 5 | New Britain, CT | 74,022 | 20.5% | $166,100 | 10.0% | 31.03% |
| 6 | Naugatuck, CT | 31,586 | 4.9% | $197,800 | 27.0% | 29.86% |
| 7 | Putnam, CT | 7,105 | 8.3% | $187,800 | 16.0% | 30.51% |
| 8 | East Hartford, CT | 50,971 | 13.1% | $172,000 | 14.0% | 32.46% |
| 9 | Riverside, CT | 9,133 | 3.1% | $1,570,200 | 6.0% | 47.17% |
| 10 | Willimantic, CT | 18,150 | 30.7% | $152,700 | 8.0% | 29.27% |
| 11 | Thompsonville, CT | 8,134 | 23.7% | $181,000 | 15.0% | 25.52% |
| 12 | West Haven, CT | 55,518 | 11.8% | $210,900 | 19.0% | 31.5% |
| 13 | Danbury, CT | 86,197 | 10.6% | $315,000 | 10.0% | 31.14% |
| 14 | Norwich, CT | 40,020 | 10.6% | $178,900 | 18.0% | 27.62% |
| 15 | Ridgefield, CT | 7,216 | 2.3% | $711,100 | 11.0% | 31.1% |
| 16 | Meriden, CT | 60,790 | 13.6% | $175,700 | 21.0% | 25.17% |
| 17 | Lake Pocotopaug, CT | 5,124 | 4.8% | $272,000 | 29.0% | 33.32% |
| 18 | Bethel, CT | 11,374 | 5.6% | $338,700 | 13.0% | 31.19% |
| 19 | Greenwich, CT | 13,978 | 7.8% | $1,237,000 | 8.0% | 31.23% |
| 20 | Ansonia, CT | 18,945 | 12.2% | $224,000 | 24.0% | 27.24% |
| 21 | Old Greenwich, CT | 6,929 | 2.4% | $1,444,800 | 13.0% | 48.89% |
| 22 | New Haven, CT | 133,874 | 24.6% | $207,600 | 7.0% | 29.72% |
| 23 | Windsor Locks, CT | 12,559 | 7.4% | $207,500 | 25.0% | 27.38% |
| 24 | Bristol, CT | 60,733 | 8.9% | $207,400 | 28.0% | 29.88% |
| 25 | Cos Cob, CT | 7,089 | 7.7% | $1,019,100 | 14.0% | 42.5% |
| 26 | Torrington, CT | 35,447 | 13.6% | $158,000 | 29.0% | 23.77% |
| 27 | New London, CT | 27,585 | 24.3% | $189,200 | 8.0% | 26.34% |
| 28 | Portland, CT | 6,224 | 7.0% | $226,700 | 40.0% | 29.44% |
| 29 | Pawcatuck, CT | 5,383 | 11.7% | $283,200 | 12.0% | 31.68% |
| 30 | Sherwood Manor, CT | 5,710 | 7.3% | $201,200 | 18.0% | 24.42% |
| 31 | East Haven, CT | 28,054 | 8.2% | $230,800 | 26.0% | 23.67% |
| 32 | Winsted, CT | 6,662 | 17.4% | $175,700 | 25.0% | 21.42% |
| 33 | New Milford, CT | 7,011 | 7.6% | $267,800 | 25.0% | 36.32% |
| 34 | Norwalk, CT | 90,821 | 9.7% | $447,200 | 14.0% | 28.87% |
| 35 | Derby, CT | 12,387 | 13.1% | $212,900 | 28.0% | 19.66% |
| 36 | Stamford, CT | 134,820 | 9.4% | $550,600 | 9.0% | 28.59% |
| 37 | Wallingford Center, CT | 19,211 | 9.1% | $254,900 | 22.0% | 23.01% |
| 38 | Orange, CT | 14,225 | 2.3% | $406,100 | 34.0% | 34.38% |
| 39 | Terryville, CT | 5,110 | 11.6% | $192,400 | 34.0% | 19.84% |
| 40 | Manchester, CT | 36,832 | 13.7% | $170,700 | 18.0% | 26.53% |
| 41 | Hazardville, CT | 6,070 | 5.4% | $192,500 | 31.0% | 22.63% |
| 42 | Simsbury Center, CT | 6,072 | 5.6% | $315,800 | 21.0% | 29.21% |
| 43 | Branford Center, CT | 5,934 | 10.8% | $234,600 | 23.0% | 20.0% |
| 44 | Milford, CT | 50,694 | 4.1% | $326,300 | 28.0% | 23.95% |
| 45 | Groton, CT | 9,333 | 15.3% | $223,200 | 13.0% | 21.73% |
| 46 | Shelton, CT | 40,944 | 6.0% | $358,900 | 28.0% | 24.51% |
| 47 | Southwood Acres, CT | 7,875 | 7.3% | $209,800 | 22.0% | 24.15% |
| 48 | Oakville, CT | 9,507 | 3.0% | $226,100 | 30.0% | 20.7% |
| 49 | West Hartford, CT | 64,034 | 6.3% | $336,500 | 17.0% | 29.66% |
| 50 | Kensington, CT | 9,626 | 5.5% | $259,800 | 38.0% | 31.52% |
| 51 | Middletown, CT | 47,164 | 11.2% | $240,700 | 20.0% | 21.49% |
| 52 | Wethersfield, CT | 27,162 | 5.4% | $266,100 | 30.0% | 27.11% |
| 53 | North Haven, CT | 24,217 | 5.8% | $304,300 | 36.0% | 28.39% |
| 54 | Newington, CT | 30,493 | 8.2% | $237,700 | 23.0% | 23.51% |
| 55 | Glastonbury Center, CT | 8,187 | 3.9% | $307,600 | 21.0% | 20.31% |
| 56 | Cheshire Village, CT | 6,006 | 6.4% | $351,400 | 27.0% | 20.82% |
| 57 | Storrs, CT | 16,784 | 45.4% | $263,500 | 1.0% | 6.73% |
How does Greenwich get on the list twice?